The Star Formation History of the Large Magellanic Cloud 11affiliation: Based on observations made with the NASA/ESA Hubble Space Telescope, obtained at the Space Telescope Science Institute, which is operated by the Association of Universities for Research in Astronomy, Inc., under NASA contract 5-26555. 6 6affiliationmark:
Abstract
Using WFPC2 aboard the Hubble Space Telescope, we have created deep color-magnitude diagrams in the V and I passbands for approximately stars in a field at the center of the LMC bar and another in the disk. The main–sequence luminosity functions (LFs) from 19 V 23.5, the red clump and horizontal branch morphologies, and the differential Hess diagram of the two fields all strongly imply that the disk and bar have significantly different star-formation histories (SFHs). The disk’s SFH has been relatively smooth and continuous over the last Gyr while the bar’s SFH was dominated by star formation episodes at intermediate ages. Comparison of the LF against predictions based on Padova theoretical stellar evolution models and an assumed age-metallicity relationship allows us to identify the dominant stellar populations in the bar with episodes of star formation that occurred from 4 to 6 and 1 to 2 Gyr ago. These events accounted, respectively, for 25% and 15% of its stellar mass. The disk field may share a mild enhancement in SF for the younger episode, and thus we identify the 4 to 6 Gyr episode with the formation of the LMC bar.
1 Introduction
The Large Magellanic Cloud (d 50 kpc) is the nearest galaxy to our own that has significant mass (1010 M☉). Its small distance allows individual stars to be resolved and makes it an ideal target for studying its global SFH and chemical evolution. The detailed SFH of the LMC is tractable now because of the high angular resolution imaging possible with the Hubble Space Telescope (e.g., Gallagher et al. 1999 and references therein), and the potential for obtaining chemical abundances for many individual stars with new multi-object spectrographs on ground-based 4-meter telescopes. Even so, the global history of the LMC is not yet known with significant precision or age resolution.
The Wide–Field/Planetary Camera 2 (WFPC2) aboard HST allows the photometric study of main–sequence stars with masses as low as 0.6 M☉, i.e., stars which have not evolved significantly during the lifetime of the LMC (Gallagher et al., 1996). However, the ability to draw conclusions about the global history of the LMC is hampered by the extremely small size of the WFPC2 field of view, which results in a large uncertainty due to small number statistics in analyses of color-magnitude diagrams (CMDs). To overcome this limitation, we have obtained deep images for numerous WFPC2 pointings in the LMC bar and disk and produced CMDs with stars per field. In order to overcome the degeneracy of age and metallicity in CMDs, we are directly measuring the metallicity distribution by determining chemical abundances with 0.2 dex precision for hundreds of red giant stars in these fields using the strength of the calcium infrared triplet lines (Cole, Smecker-Hane & Gallagher 2000 [CSG00], Smecker-Hane et al. 2001). By combining the metallicity distributions with CMDs, we will obtain the clearest picture yet of the evolution of the LMC.
Up to now, the SFH of the LMC’s bar, as distinct from its disk, has been poorly constrained. In this Letter, we report the first results of our program — a direct comparison of the CMDs of the bar and disk fields, which shows that the LMC bar has experienced a significantly different SFH than the disk. We also model the main–sequence luminosity functions to derive the SFHs. A more detailed analysis of the CMDs incorporating our spectroscopic results will be reported in future papers.
2 Data: Observations, Reductions, Photometry
Our data were obtained in 1997 October–November under HST Guest Observer Proposal #7382 (PI = Smecker-Hane). The bar field adopted here consists of 2 out of a total of 4 WFPC2 pointings near the open cluster HS 275 ( = 5h24m, = 6946 [J2000.0]), near the optical center of the bar. The disk field, referred to as “Disk 1” (CSG00), lies 17 southwest of the center of the LMC along the direction of the bar’s minor axis, near the open cluster SL 336, ( = 5h14m, = 7113, [J2000.0]). The Disk 1 field is well outside the bar, and hence the CMD produced here samples a pure disk population. In Disk 1, 10 WFPC2 pointings were mosaiced in order to sample about as many stars as in the bar field. Each pointing consisted of 4500 sec integrations in the F555W filter and 2300 sec and 2700 sec in F814W. Exposures were dithered in non-integer pixel amounts to mitigate the undersampling of the point-spread function. The data were reduced in the standard HST pipeline. Profile-fitting photometry was performed on the individual images using DAOPHOT II/ALLFRAME software (Stetson, 1987, 1994), and calibrated to Johnson V and Kron-Cousins I magnitudes (Holtzman et al., 1995). Further details of our reductions, photometry, and artificial star tests will be reported in a subsequent paper; here we report our most important early results.
3 Color-Magnitude Diagrams

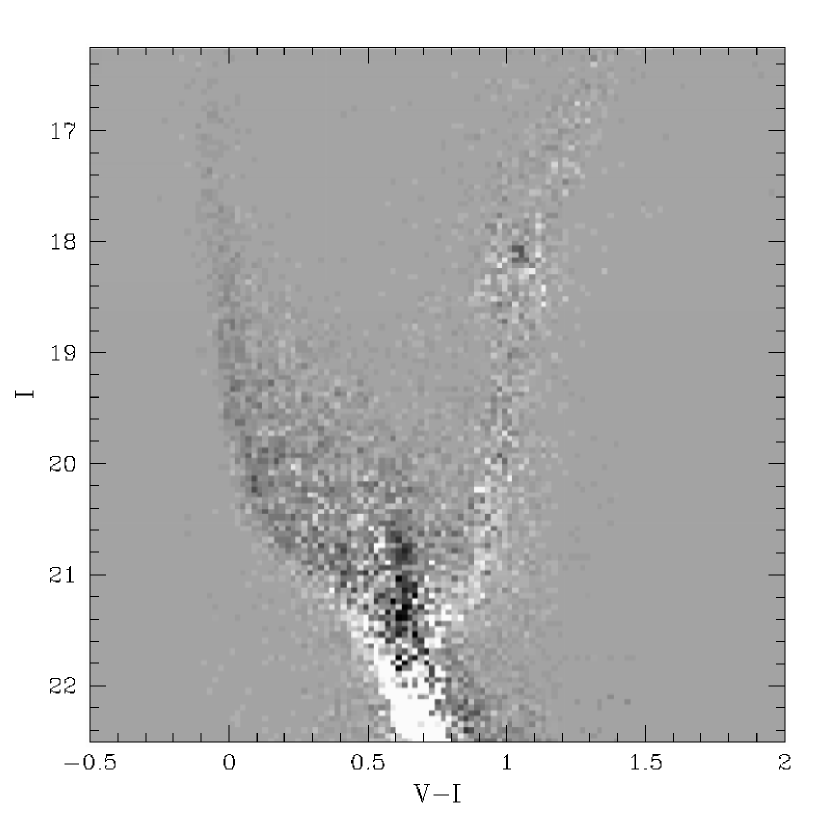
The CMDs for the Disk 1 and Bar fields are shown in Figure 1. They extend more than 2.5 magnitudes below the oldest main–sequence turnoffs (MSTOs) in the LMC. The CMDs are similar in their gross properties, showing a strong upper main sequence of youthful stars, prominent red clumps characteristic of intermediate-age populations, and corresponding structures in the MSTO/subgiant region suggesting continuous star formation with resulting chemical enrichment. Photometric completeness in the bar field drops below 50% for I , and saturation occurs for V . Thus we focus our analysis on the intervening region, where our photometry is reliable and complete.
Although broadly similar, the two CMDs differ in a number of significant ways. In the bar field, the main sequence brighter than I is much more concentrated towards the zero–age main sequence suggesting a larger fraction of young stars. Note that, because of saturation, we can measure only MSTOs with ages 200 Myr. A small fraction of the stars in the bar field is younger than this, but such a population is weaker in Disk 1. The red horizontal branch region of the Disk 1 CMD ( VI , I ) is sparsely populated, but more richly than the corresponding region of the bar CMD. This implies a deficiency of metal-poor, ancient (t 10 Gyr) stars relative to younger stars in the bar, when compared to Disk 1. The red clump morphologies of the two fields differ strongly, as discussed below and shown in Figure 1c–d. Perhaps most significantly, the bar field shows a large excess of stars at VI 0.65 from I .
These differences in CMD morphology are independent of assumed distance, mean reddening and stellar evolution models. However, their detailed quantitative interpretation requires us to adopt values for these. We have estimated a reddening of E(BV) for Disk 1 based on Strömgren photometry (CSG00); by comparing the colors of the upper main sequences, we find the bar field has slightly higher reddening, E(BV) 0.05. The distance to the LMC is controversial (see, e.g., Cole 2000 and references therein), but the assumption of a fiducial (mM)0 = 18.5 is reasonable. Our CMDs are not ideal for estimating the stellar metallicities in the fields. However, the colors of the red clump and lower main sequence can be used to infer that Disk 1 and the bar have roughly similar metallicities. For reference, from spectra of 39 red giants in Disk 1, we find a mean metallicity of [Fe/H] 0.6 (CSG00).
4 Bar and Disk: A Comparative Analysis
We begin by examining the main–sequence luminosity functions (LFs) of the two fields. These are presented in Figure 2; note that we give the LF in units of number of star per magnitude per square area to account for the differences in area surveyed in each field. The LFs have been corrected for incompleteness using artificial star tests; the uncorrected LFs are shown as dashed lines. Error bars show the 1 errors derived from Poisson statistics. We find that: 1) the bar and disk LFs both show a “knee” at V 22.2, which indicates the oldest MSTO of the LMC has an age Gyr; 2) the bar LF is shallower than the Disk 1 LF, implying a larger fraction of young and intermediate-age stars in the bar; 3) the bar LF shows large variations compared to the relatively smooth Disk 1 LF, which translates to a more burst-dominated SFH for the bar. The knees in the LFs occur at fainter magnitudes than had been derived using ground-based telescopes; this shows that even for relatively bright stars, the high resolution obtainable from space is vital for accurate photometry.

The spikes in the bar LF at V , 20.6, and 19.7, and the corresponding changes in the LF slope at those magnitudes, indicate large temporal variations in the star-formation rate (SFR). Smaller amplitude variations, of marginal statistical significance, are seen in the Disk 1 LF; note the almost complete lack of a feature corresponding to the peak in the bar LF at V = 21.5. This provides model-independent evidence that a major episode of star formation, beginning several Gyr after the oldest LMC stars formed, occurred in the bar.
To derive the SFH from the LFs, we need to adopt three key ingredients: 1) a stellar initial mass function, 2) a set of stellar evolutionary models, and 3) an age–metallicity relationship. We assume the initial mass function from Kroupa, Tout & Gilmore (1993). We adopt the newest stellar evolutionary models from the Padova group (Girardi et al. 2000). Using equivalent evolutionary points, we interpolate them to arbitrary age and metallicity. We began our analysis by adopting the age-metallicity relationship of Pagel & Tautvaišienė (1998), but comparisons of the observed CMDs to model CMDs showed that the observed CMDs clearly did not have as many metal-poor stars as predicted. (The observed red giant branch was narrower and redder than predicted, and the observed CMD lacked the extended blue HB predicted by the models.) We believe the lack of metal–poor stars in these fields is indeed real because we find very few stars with metallicities Z in our spectroscopic surveys of red giant stars in the Disk 1 field (CGS00), and in our subsequent work in the Disk 1 field and another disk field at similar galactocentric radius (Smecker-Hane et al. 2001). Therefore, we have adopted the age–metallicity relationship from Pagel & Tautvaišienė (1998) for ages Gyr and assumed a constant metallicity, Z , for ages Gyr. In future papers, we will derive both the age–metallicity relationship and the SFH in a self-consistent way by simultaneously modeling the CMDs and metallicity distribution functions.
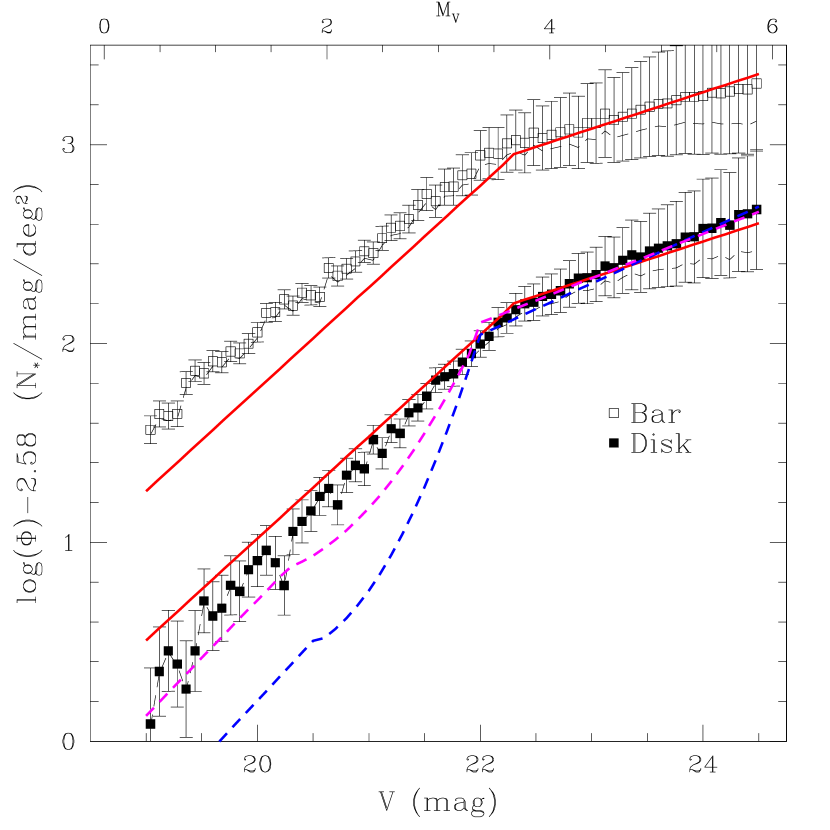
Figure 3 compares the observed and model LFs. We show three model LFs computed assuming a constant SFR with the onset of star formation, , assumed to be 14.2 Gyr ago, and exponentially declining rates, SFR , with and 4 Gyr. For comparison with observed LFs, model LFs have been normalized to have the same number of stars in the magnitude range . A constant SFR gives . The Disk 1 LF calculated in the magnitude range of 20 V 22 is , which is in good agreement with that expected from a constant or slightly declining ( Gyr) SFR. In comparison, the bar LF is shallower, with , indicating that its SFR has increased with time. The SFHs are quantified below. The LFs clearly suggest the mean age of stars in the bar are younger than those in the disk.
A closer look at the red clump morphology of the two CMDs is shown in Figure 1c–d. Although the red clumps have very similar colors, the Disk 1 red clump is mag fainter in I than the bar red clump. This suggests that the typical red clump star in the disk is older than the typical red clump star in the bar (e.g., Cole 1998, Girardi & Salaris 2001). This conclusion is supported by the extension of the Disk 1 red clump, but not the bar red clump, to fainter and bluer colors: the classical red horizontal branch characteristic of an ancient population. In contrast, the bar clump shows a vertical feature at its blue edge, extending from I : the signature of a stellar population component aged 1 Gyr for metallicity Z 0.008 (Girardi, 1999), as appropriate for the metallicity of the young population in the LMC ([Fe/H] ; Hill et al. 1995).
Strong evidence for a younger, burst-dominated bar can be seen in Figure 4, which shows the differential Hess diagram created by subtracting the scaled disk Hess diagram from the bar Hess diagram. The CMDs were binned in 0.02 mag intervals in VI and 0.05 mag in I, and normalized such that the total number of stars were equal. Each pixel in the resulting image has been divided by its Poisson-noise error to produce Figure 4. The blackest pixels represent an excess near in the bar, and the whitest pixels show an excess near in the disk. The differences between the fields are dramatically highlighted. The differential Hess diagram emphasizes two other features that reinforce the inferences from Figures 1 and 2. Disk 1 contains more faint subgiants in the range of I and VI , and has a trememendous excess on the blue side of the main sequence below I 21.4. Differences in incompleteness can account for only half of this difference. These differences indicate that the disk has a higher fraction of older and/or more metal-poor stars than the bar.
Using the adopted distance, reddening, IMF, stellar models, and age-metallicity relationship, we have quantify the Disk 1 and Bar SFHs by modeling the LF; we do so by minimizing the of model LFs created by sampling the isochrones with a Monte Carlo procedure. We calculate the SFRs in logarithmically-spaced time bins and show the results in Figure 5. The dominant starbirth event in the bar took place from 4 to 6 Gyr ago assuming the metallicity increased from 0.004 Z 0.008 during this time. The metallicity evolution of the bar is poorly known, and it is the main factor limiting our ability to constrain the exact time and duration of the inferred burst of star formation. (We plan to obtain spectra of individual red giant stars in the bar with the multi-object spectrograph on the Gemini South 8-meter telescope once it comes online.) The 5 Gyr event also generates the excess on the red clump seen at I = 18.1, VI = 1.05 in Figure 4. During this 2 Gyr window, the average bar SFR was at least twice the previous average; the bar also experienced enhanced star-formation 1 to 2 Gyr ago. The SFR has also been high for much of the past Gyr, although saturation limits our ability to constrain it in the last 200 Myr. The signature morphology of the red clump implies that the 1 Gyr event really was short in duration; in a future paper, we will compare these two bar fields to two others to explore the possibility that a dissolved star cluster might give rise to this recent spike in the SFR. We estimate from inspection of the isochrones that the specific ages of the SFH features are subject to a 10 to 15% uncertainty, due mainly to the uncertainties in the adopted age-metallicity relationship.

The derived SFH for the bar predicts that, by mass, 35% of the stars are younger than 3 Gyr, and 71% are younger than 7.5 Gyr. For Disk 1, the corresponding fractions at the same ages are only 19% and 41%, respectively. During the interval 7.5 Gyr Gyr, the bar formed 29% of its stellar mass, while Disk 1 formed 59%. The total stellar surface density in the bar fields is times that of Disk 1. However, if we consider only stars with ages Gyr, the ratio of the surface densities drops to 2.7; the main uncertainty in the estimate being the assumed age-metallicity relationship. This ratio roughly agrees with the factor of 2.0 we would expect given that the exponential scale length of the disk (excluding the bar) is 25 (Weinberg & Nikolaev, 2001). Therefore, the bar and Disk 1 fields may have shared similar SFHs for Gyr. Disk 1 is found to have experienced a smoother SFH than the bar, forming a larger fraction of its stars during the first half of its lifetime. After an initial epoch of star-formation, Disk 1 shows only mild variations (a factor ) in SFR until Gyr ago. The SFR seems to have been mildly elevated at t 2 Gyr, at the same time as the younger enhancement in the bar. In contrast to the bar, Disk 1 shows a very low recent SFR. This picture of the LMC’s SFH will be further sharpened through detailed modeling of the CMDs and metallicity distribution functions in our future papers.
5 Discussion
Our data represent the largest sample of LMC stars reaching down to the oldest MSTO and beyond. This has allowed us to compare the SFHs of the LMC disk and bar with unprecedented power. From analysis of the LFs, we find that the disk and bar experienced similar SFHs at older ages (7.5 to 15 Gyr). However, there is a dramatic difference in the derived SFH for younger ages. The bar’s SFH was dominated by two distinct enhancements in the SFR from 4 to 6 and 1 to 2 Gyr ago, while the Disk maintained a nearly constant SFR. We associate the 4 to 6 Gyr enhancement in the SFR seen only in the bar field with the epoch of the formation of the LMC bar. The timing of the enhancements in the SFR of the bar is intriguing, because of the similarity they bear to the predicted times of close interaction between the LMC, SMC, and Milky Way (see, e.g., Gardiner et al. 1994). We hypothesize that tidal interactions during perigalactic passage 4.5 Gyr ago triggered an instability in the LMC’s gaseous disk that resulted in the formation of the bar. Large gas flows into the bar during this interaction could have resulted in the birth of a large number of stars on bar-type orbits.
How does our derived SFH of the bar compare to previous estimates based on other WFPC2 data? Elson, Gilmore & Santiago (1997) studied a single field near the bar-disk interface and suggested that the bar formed much later than the disk, 1 Gyr ago. Because they were limited to one WFPC2 field, they based their conclusions on assigning substructures within the CMD to the bar or disk based on similarity to outer disk fields. The direct differential comparison provided in our Figure 4 should be more robust than correlating spatial and CMD structures within a single field. Ardeberg et al. (1997) analyzed a central bar field and found a large fraction of old stars, with a hiatus in star-formation from 0.5 to 2 Gyr ago. However, they sampled only 5% of the number of stars in our bar field; the resulting uncertainties due to small number statistics likely account for the discrepancy between their conclusion and ours. Olsen (1999) studied several bar fields and found the bar to be dominated by stars older than 4 Gyr. With our larger sample size, we are able to identify the contribution of the starbirth event at 5 Gyr to this bar population. This event seems to be recognizable, at lower signal-to-noise, within Olsen’s Figures 13–14, although our data suggest a smoother SFH prior to the 5 Gyr event than was derived by Olsen. Holtzman et al. 1999 analyzed a single WFPC2 field in the immediate vicinity of our bar field, and found similar results to Olsen (1999). As we do here, H99 used a differential Hess diagram to compare the bar to the disk. The higher fraction of ancient stars found by H99 may be due in part to the smaller number of stars analyzed, or to differences in the analysis. We will investigate this further in future papers.
References
- Ardeberg et al. (1997) Ardeberg, A., Gustafsson, B., Linde, P., & Nissen, P.-E. 1997, A&A, 322, L13
- Cole (1998) Cole, A.A. 1998, ApJ, 500, L137
- Cole (2000) Cole, A.A. 2000, Science, 289, 1149
- Cole, Smecker-Hane & Gallagher (2000) Cole, A.A., Smecker-Hane, T.A., & Gallagher, J.S., III 2000, AJ, 120, 1808 (CSG00)
- Elson, Gilmore & Santiago (1997) Elson, R.A.W., Gilmore, G.F., & Santiago, B.X. 1997, MNRAS, 289, 157
- Gallagher et al. (1996) Gallagher, J.S., III, Mould, J.R. de Feijter, E., Holtzman, J., Stappers, B., Watson, A., Trauger, J., & The WFPC2 Team 1996, ApJ, 466, 732
- Gallagher et al. (1999) Gallagher, J.S., III, Cole, A.A., Holtzman, J.A., & Smecker-Hane, T.A. 1999, in IAU Symp. 190, “New Views of the Magellanic Clouds”, eds. Y.-H. Chu, N.B. Suntzeff, J.E. Hesser, & D.A. Bohlender, (PASP, San Francisco), 306
- Gardiner, Sawa & Fujimoto (1994) Gardiner, L.T., Sawa, M., & Fujimoto, M. 1994, MNRAS, 266, 567
- Girardi (1999) Girardi, L. 1999, MNRAS, 308, 818
- Girardi et al. (2000) Girardi, L., Bressan, A., Bertelli, G., & Chiosi, C. 2000, A&AS, 141, 1
- Girardi & Salaris (2001) Girardi, L. & Salaris, M. 2001, MNRAS, 323, 109
- Hill et al. (1995) Hill, V., Andrievsky, S., & Spite, M. 1995, A&A, 293, 347
- Holtzman et al. (1995) Holtzman, J.A., Burrows, C.J., Casertano, S., Hester, J.J., Trauger, J.T., Watson, A.M., & Worthey, G. 1995, PASP, 107, 1065
- Holtzman et al. (1999) Holtzman, J.A., Gallagher, J.S., III, Cole, A.A., Mould, J.R., Grillmair, C.J., & The WFPC2 Team 1999, AJ, 118, 2262 (H99)
- Kroupa, Tout & Gilmore (1993) Kroupa, P., Tout, C.A., & Gilmore, G. 1993, MNRAS, 262, 545
- Olsen (1999) Olsen, K. 1999, AJ, 117, 2244
- Pagel & Tautvaišienė (1998) Pagel, B.E.J., & Tautvaišienė, G. 1998, MNRAS, 299, 535
- Smecker-Hane et al. (2001a) Smecker-Hane, T.A., Cole, A.A., Mandushev, G., & Gallagher, J.S., III 2001a, in preparation
- Stetson (1987) Stetson, P.B. 1987, PASP, 99, 191
- Stetson (1994) Stetson, P.B. 1994, PASP, 106, 250
- Weinberg & Nikolaev (2001) Weinberg, M.D. & Nikolaev, S. 2001, ApJ, 548, 712