The Spectra and Classification of L and T Dwarfs
Abstract
In this contribution, I discuss some of the salient features of L and T dwarf spectra in both the red optical (6300–10000 Å) and near-infrared (1–2.5 m) wavelength regimes. Important absorption bands and lines, including those of H2O, CH4, FeH, CrH, CO, and the alkali metal lines, are identified, and the development of recent classification schemes based on these features are discussed. I briefly point out future work required in these wavelength regions and in the mid-infrared that are required to garner a complete picture of these low-luminosity dwarfs.
1. Introduction
The advent of sensitive near-infrared detectors, and the implementation of large-scale imaging surveys (e.g., 2MASS, SDSS, and DENIS) at wavelengths outside of the classical optical regime, have resulted in a major revolution in cool star research. In the past decade, we have witnessed an avalanche of ultra-cool star and brown dwarf discoveries in the field, in young stellar clusters, and as companions to nearby stars (see Basri 2000 for an excellent review), pushing to temperatures below 1000 K. These discoveries have required the definition of two new spectral classes, L dwarfs and T dwarfs, the first major additions to the widely-accepted MK system in over half a century (see the contribution by S. Hawley in these proceedings for more information). Indeed, the initially unique companion objects GD 165B (Becklin & Zuckerman 1989) and Gliese 229B (Nakajima et al. 1995) are now understood to be the prototypes to these very late classes of stars and brown dwarfs. “Avalanche” is an appropriate term here; despite their recent identification, hundreds of L dwarfs and at least 30 T dwarfs are now known.
In this contribution, I review some of the spectral properties of L and T dwarfs in two well-studied wavelength regimes: first, the red optical, typically covering 6300–10000 Å, is discussed in 2; second, the near-infrared, conventionally 1–2.5 m, is discussed in 3. In 4, I address future work necessary in both these spectral regions and beyond that will result in a more complete understanding of these cool objects.
2. Red Optical Spectra
The red optical has been an important region of study for the coolest stars, being the brightest spectral region for these objects accessible by CCD detectors. The first spectrum of an L dwarf, GD 165B, was obtained in the red optical by Kirkpatrick et al. (1993), and shown to lack the strong TiO bands that characterize M dwarfs. With the discovery of additional “post-M” objects (see Basri 2000), it became clear that a new spectral class, the L dwarfs, had been identified. For the T dwarfs, initial work in this regime was done by Oppenheimer et al. (1998) in their analysis of Gliese 229B. These authors identified a number of distinct features, including a steep red slope extending from 8600–10000 Å that initially defied adequate explanation.
2.1. L Dwarfs
Figure 1 shows the spectral sequence of late-M and L dwarfs in the red optical from Kirkpatrick et al. (1999); see Fig. 3 in the contribution by S. Hawley for the identification of the features present in these spectra. As originally observed in GD 165B, the hallmark TiO and VO bands weaken in the L dwarfs, resulting in a fairly transparent atmosphere in which hydrides and alkali lines become prominent. FeH (8692, 9896 Å), CrH (8611, 9969 Å), and CaH (6750 Å) are all present, strengthening in the early-type L dwarfs and weakening in the later types. H2O also produces an important feature at 9250 Å, which strengthens toward later spectral types and is important in the T dwarfs as well.
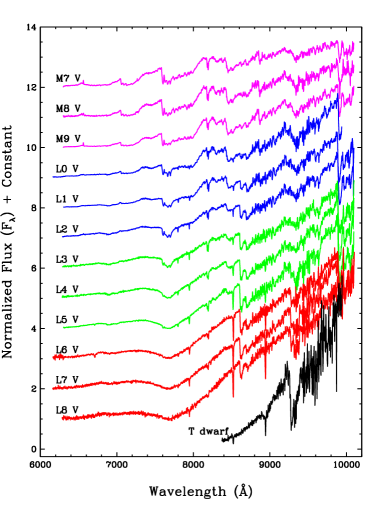
The depletion of molecular species, likely caused by the formation and rainout of dust (Tsuji, Ohnaka, & Aoki 1996; Ackerman & Marley 2001), allows the less refractory alkali doublet lines to come into prominence, including Na I (5890/5896 and 8183/8195 Å), K I (7665/7699 Å), Cs I (8521/8943 Å), and Rb I (7800/7948 Å). The large column abundances of both Sodium and Potassium in these clear atmospheres enable their resonance doublet features to become quite pronounced via pressure-broadening. This can be seen in the case of K I by the wide trough centered at 7700 Å in the latest L dwarfs, growing from the sharper features present in the late M dwarfs and early L dwarfs. The Na I 5890/5896 Å D lines produce a similar feature at shorter wavelengths (Reid et al. 2000). The Li I line at 6708 Å is also present in L dwarfs with masses below 0.06M⊙; Rebolo et al. (1992) first pointed out the utility of this feature as an indicator for substellarity. Kirkpatrick et al. (1999) estimate that over 1/3 of the field L dwarfs identified by 2MASS are brown dwarfs, based on the presence of this line in their spectra. The other line feature frequently seen in these spectra is H emission at 6563 Å. Contributions by S. Hawley and S. Mohanty provide further discussion on H emission in L dwarfs.
The seemingly smooth variation of these features in the observed L dwarf population has resulted in two competing classification schemes: that of Kirkpatrick et al. (1999), which spans subtypes L0 V to L8 V; and that of Martín et al. (1999), which spans subtypes L0 V to L6 V. Utilizing both band and color indices to classify subtypes, these systems agree fairly well for the early and mid-L dwarfs, but diverge beyond type L4. Hopefully the current treasury of L dwarf spectra will allow convergence of these two schemes in the near future.
2.2. T Dwarfs
The last spectrum in Figure 1 is that of the prototype T dwarf, Gliese 229B, from Oppenheimer et al. (1998). Its spectrum is quite different that those of the latest L dwarfs, due to deeper H2O absorption, absence of hydrides, and steeper spectral slope. However, it was unclear at the time of its discovery if the photosphere of Gliese 229B is influenced by its primary, which could naturally lead to an unusually red spectrum (Griffith, Yelle, & Marley 1998).
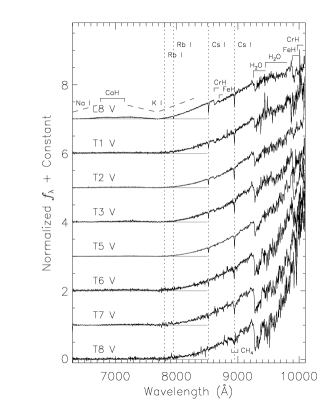

Figure 2 shows red optical spectra of a series of T dwarfs and one L8 dwarf from Burgasser (2001); subtypes are those defined in Burgasser et al. (2001) (see 3.2). All of these T dwarfs are field objects and show the same steep spectral slope in the red as Gliese 229B. Liebert et al. (2000) have shown that the increasingly broadened K I doublet seen in the L dwarfs is generally responsible for this slope and the corresponding red optical/near-infrared colors of T dwarfs, as is obvious in the spectra in the right panel of Figure 2. Na I D lines suppress flux shortward of 7000 Å, an extension of the behavior seen in the latest L dwarfs. There are also a number of unbroadened atomic features present in these spectra, including Cs I at 8521/8943 Å and the much weaker Rb I doublet at 7800/7948 Å. The former lines appear to be strong throughout the T sequence, although they fade rapidly in the latest subtypes. The latter are only seen in the highest signal-to-noise spectra and are generally weak, buried in the broadened K I feature. Note that Li I at 6708 Å has not yet been detected in any of the T dwarfs.
The most prominent molecular features in the red optical spectra of T dwarfs are the H2O bands starting at 9250 and 9450 Å, respectively. These bands strengthen considerably throughout the T sequence, and provide powerful diagnostics for classification. An FeH band at 9896 Å is also seen in some of the spectra of Figure 2, appearing to strengthen somewhat between the latest L dwarfs and the mid-T dwarfs, then fading again toward the latest T subtypes. Its higher-order counterpart at 8692 Å is seen only in the earliest T dwarfs, which is also the case for CrH at 8611 Å. The 9969 Å band of CrH is weak or absent in all of the T dwarfs. A weak signature of CaH around 6750–7150 Å, seen in M and L dwarfs, also appears to be present but weak in the brightest early T dwarfs. Finally, CH4, which is ubiquitous in the near-infrared spectra of T dwarfs (see 3.2), produces a weak band centered at 8950 Å in the latest subtypes. The presence of this feature is made ambiguous by its coincidence with Cs I at 8943 Å.
Finally, steady H emission has been detected in the spectrum of 2MASS 1237+6526 (Burgasser et al. 2000b), and a much weaker line has been seen in the spectrum of 2MASS 1254-0122 (Kirkpatrick et al. 2002). None of the other T dwarf spectra show emission features. We refer the reader to the contribution of S. Hawley in these proceedings for further discussion of H emission in T dwarfs.
3. Near-infrared Spectra
The near-infrared is an useful region for the study of L and T dwarfs, as the spectral energy distributions of both classes peak at roughly 1 m. The first spectrum of an L dwarf, GD 165B, was obtained by Jones et al. (1994), who noted the importance of H2O and CO absorption in these cool dwarfs, as well as their apparent reddening as compared to warmer M dwarfs (cause by thermal dust emission). Nearly all of the spectroscopic work on T dwarfs has been done in the near-infrared due to sensitivity considerations111For Gliese 229B, R–J 9 (Golimowski et al. 1998).. Indeed, it is the difference in the near-infrared spectra of L dwarfs and Gliese 229B due to CH4 absorption that prompted Kirkpatrick et al. (1999) to designate a new class for these cool brown dwarfs.
3.1. L Dwarfs
Figure 3 shows the near-infrared spectra of three late M dwarfs and three L dwarfs from Leggett et al. (2001). The deepening of the H2O bands at 1.15, 1.4, and 1.85 m for these objects is readily apparent in the data. Not surprisingly, the H2O bands split the near-infrared spectra of L dwarfs into peaks centered at the three telluric windows, around 1.2, 1.65, and 2.15 m; the L dwarf H2O bands are significantly broader than telluric absorptions, however, due to the higher temperatures of L dwarf atmospheres. The relative brightness of these flux peaks (increasing importance of K-band) reflects the reddening of L dwarfs in near-infrared colors.

CO is a key absorber at K-band; the bandheads beyond 2.3 m are clearly seen in the M9 dwarfs, with the some slight strengthening in the L dwarfs. The latest-type objects also show absorption beyond the 2.1 m peak; this was originally attributed to CH4 by Delfosse et al. (1997), but later identified as collision-induced absorption (CIA) of H2 by Tokunaga & Kobayashi (1999). CIA H2 is an important contributor to the total opacity in the cold, high-gravity atmospheres of both L and T dwarfs. Recently, Geballe et al. (2001) have found indications of weak CH4 absorption at K-band in their latest L9 dwarfs in addition to the CIA H2 opacity.
There are finer features present at J-band in the L dwarfs. In particular, K I doublet lines at 1.169/1.177 and 1.243/1.252 m are quite strong in the L dwarfs, weakening somewhat for the latest subtypes (McLean et al. 2000). These are higher-order lines than the 7700 Å resonance doublet, and hence do not broaden as strongly. Na I lines at 1.138/1.141 m show similar behavior. Additional alkali lines of Rb I and Cs I are likely present but buried in the broad 1.4 m H2O band. FeH features at 1.194, 1.210, and 1.237 m are present and strong in the early subtypes, eventually fading along with the 9896 Å band (McLean et al. 2000).
In analogy to the red optical, the evolution of features in the near-infrared has allowed the derivation of classification schemes for L dwarfs in this wavelength regime. Reid et al. (2001) and Testi et al. (2000) have made use of H2O and color indices to derive spectral classification schemes tied to the Kirkpatrick et al. (1999) optical sequence. Geballe et al. (2001) have defined an independent near-infrared classification scheme that extends to subtype L9, consistent with both the Kirkpatrick et al. (1999) and Martín et al. (1999) optical classifications at early types, but diverging somewhat for the latest subclasses. See the contribution by T. Geballe in these proceedings for further discussion. It is hoped that ongoing analysis will ultimately produce a consistent system that matches red optical and near-infrared subclasses.
3.2. T dwarfs
Figure 4 shows low-resolution spectra of T dwarfs and two L dwarfs in the 1–2.5 m region, with important molecular and atomic features indicated (higher resolution spectra are given in the contribution by T. Geballe). These data show that both H2O and CH4 absorption bands are the dominant features shaping the spectra of T dwarfs. The addition of CH4 bands (beginning at 1.05, 1.3, 1.6, and 2.2 m) to the H2O bands seen in the L dwarfs ultimately confine the emitted flux of these objects into narrow peaks centered at 1.08, 1.27, 1.59, and 2.07 m. CH4 absorption effectively removes half of the emitted flux from the H- and K-bands, while the gradually developing slope between the 1.27 m peak and the 1.4 m H2O band is caused by CH4 at 1.3 m. Earlier-type T dwarfs than those shown here have weaker CH4 absorption, resulting in the dual presence of CH4 and CO bands at 2.2 and 2.3 m (Leggett et al. 2000). CIA H2 is also present at K-band, suppressing flux throughout the 2–2.5 m region222CIA H2 absorption also peaks around 1.2 m but is 100 times weaker.. Variation in the strength of H2 absorption amongst the known T dwarf population has been noted by Burgasser et al. (2001) in the peculiar T dwarf 2MASS 0937+2931, possibly indicative of extreme gravity and/or metallicity differences. See the contribution by S. Leggett in these proceedings for further observations of this effect.

Atomic lines of K I at J-band appear to remain strong from the L dwarfs through most of the T dwarfs, but weaken somewhat in the very latest T subtypes. Indeed, both Burgasser et al. (2001) and Geballe et al. (2000a) note an absence of these lines in the coolest known T dwarf Gliese 570D (Burgasser et al. 2000a). The spectra of Figure 4 are generally too low to resolve the K I lines, but their trends can be seen in the evolution of the notch feature around 1.25 m. FeH lines seen in the L dwarfs at J-band are not seen in the T dwarfs.

T dwarf classification has only recently been addressed by Burgasser et al. (2001) and Geballe et al. (2001), with both authors using near-infrared features of H2O, CH4, and color to derive very similar schemes. We defer discussion of T classification to the contribution of T. Geballe, but show in Figure 5 the spectral standards from Burgasser et al. (2001). These data highlight the clear strengthening of band features and weakening of the K I lines throughout the sequence.
4. Future Work
Since their first discovery, there have been significant advances made in the observational study of brown dwarfs. The focus of these studies has primarily been in the red optical and near-infrared, enabling the thorough characterization of brown dwarfs in these wavelength regimes as described in this article. There is a great deal to be learned in this region, however, particularly in the interpretation of the spectra. Theoretical modeling of brown dwarf atmospheres has advanced greatly (see Burrows et al. 2001 and Chabrier & Baraffe (2000) for recent reviews), but significant work remains in detailing the differential effects of temperature, gravity, and metallicity on emergent spectra; updating molecular opacities for adequate modeling; and incorporating self-consistent treatment of dust and grain opacities, including cloud formation and rainout (see the contribution by M. Marley in these proceedings). The latter problem is particularly critical in understanding the transition between the dusty L and relatively dust-free T subtypes.
There has been interesting work recently done outside of the 0.6–2.5 m regime for both L and T dwarfs. Strong CO absorption has been detected in the T dwarfs Gliese 229B (Noll, Geballe, & Marley 1997, Oppenheimer et al. 1998) and 2MASS 0559-1404 (Burgasser 2001), indicative of upwhelling in a dynamic photosphere, a complex process requiring more advanced theoretical modeling (Saumon et al. 2000). In addition, the fundamental band of CH4 at 3.3 m has been detected in mid- to late-L dwarfs, which has possible implications on the temperature scale of L and T subclasses (Noll et al. 2000). Further work beyond 5 m, which can be accomplished via SIRTF and SOFIA, could potentially enable the direct detection of dust species in this objects, as well as strong bands of NH3, H2S, and alkali chlorides (the repository for atomic alkali species below 800 K; Lodders 1999). The spectra of L and T dwarfs clearly have many secrets left to be revealed.
Acknowledgments.
I would like to acknowledge all of my collaborators on the 2MASS Rare Objects Team: A. Burrows, R. M. Cutri, C. C. Dahn, J. E. Gizis, J. D. Kirkpatrick, J. Liebert, P. J. Lowrance, D. G. Monet, I. N. Reid, and M. F. Skrutskie; and my advisor M. E. Brown at Caltech. I recognize the support of the Jet Propulsion Laboratory, California Institute of Technology, which is operated under contract with the National Aeronautics and Space Administration.
Online resources for L and T dwarf spectra may be found at I. N. Reid’s L and M dwarf spectra page, D. Montes’ L and M dwarf spectra page, C. Gelino’s Brown Dwarf Catalog, S. Leggett’s Spectra Repository, and my own T Dwarf page.
References
Ackerman, A. S., & Marley, M. S. 2001, ApJ, 556, in press
Basri, G. 2000, ARA&A, 38, 485
Becklin, E. E., & Zuckerman, B. 1988, Nature, 336, 656
Burgasser, A. J. 2001, Ph.D. Thesis, California Institute of Technology
Burgasser, A. J., et al. 2001, ApJ, 563, in press
Burgasser, A. J., et al. 2000a, ApJ, 531, L57
Burgasser, A. J., Kirkpatrick, J. D., Reid, I. N., Liebert, J., Gizis, J. E., & Brown, M. E. 2000b, AJ, 120, 473
Burrows, A., Hubbard, W. B., Lunine, J. I., & Liebert, J. 2001, Rev. of Modern Physics, in press
Chabrier, G., & Baraffe, I. 2000, ARA&A, 38, 337
Delfosse, X., et al. 1997, A&A, 327, L25
Geballe, T. R., et al. 2001b, ApJ, 563, in press
Golimowski, D. A., Burrows, C. S., Kulkarni, S. R., Oppenheimer, B. R., & Brukardt, R. A. 1998, AJ, 115, 2579
Griffith, C. A., Yelle, R. V., & Marley, M. S. 1998, Science, 282, 2063
Jones, H. R. A., Longmore, A. J., Jameson, R. F., & Mountain, C. M. 1994, MNRAS, 267, 413
Kirkpatrick, J. D., et al. 2002, AJ, in prep.
Kirkpatrick, J. D., et al. 1999, ApJ, 519, 802
Kirkpatrick, J. D., Kelly, D. M., Rieke, G. H., Liebert, J., Allard, F., & Wehrse, R. 1993, ApJ, 402, 643
Leggett, S. K., Allard, F., Geballe, T., Hauschildt, P. H., & Schweitzer, A. 2001, ApJ, 548, 908
Leggett, S. K., et al. 2000, ApJ, 536, L35
Liebert, J., Reid, I. N., Burrows, A., Burgasser, A. J., Kirkpatrick, J. D., & Gizis, J. E. 2000, ApJ, 533, L155
Lodders, K. 1999, ApJ, 519, 793
Martín, E. L., Basri, G., & Zapatero Osorio, M. R. 1999, AJ, 118, 1005
McLean, I., et al. 2000, ApJ, 533, L45
Nakajima, T., Oppenheimer, B. R., Kulkarni, S. R., Golimowski, D. A., Matthews, K., & Durrance, S. T. 1995, Nature, 378, 463
Noll, K. S., Geballe, T. R., Leggett, S. K., & Marley, M. S. 2000, ApJ, 541, L75
Noll, K. S., Geballe, T. R., & Marley, M. S. 1997, ApJ, 489, L87
Oppenheimer, B. R., Kulkarni, S. R., Matthews, K., van Kerkwijk, M. H. 1998, ApJ, 502, 932
Rebolo, R., Martín, E. L., & Magazzu, A. 1992, ApJ, 389, L83
Reid, I. N., Burgasser, A. J., Cruz, K., Kirkpatrick, J. D., & Gizis, J. E. 2001, AJ, 121, 1710
Reid, I. N., Kirkpatrick, J. D., Gizis, J. E., Dahn, C. C., Monet, D. G., Williams, R. J., Liebert, J., & Burgasser, A. J. 2000, AJ, 119, 369
Saumon, D., Geballe, T. R., Leggett, S. K., Marley, M. S., Freedman, R. S., Lodders, K., Fegley, B., Jr., & Sengupta, S. K. 2000, ApJ, 541, 374
Testi, L., et al. 2001, ApJ, submitted
Tokunaga, A. T., & Kobayashi, N. 1999, AJ, 117, 1010
Tsuji, T., Ohnaka, K., & Aoki, W. 1996, A&A, 305, L1