Narrowband CCD Photometry of Giant HII Regions
Abstract
We have obtained accurate CCD narrow band and photometry of Giant HII Regions in M 33, NGC 6822 and M 101. Comparison with previous determinations of emission line fluxes show large discrepancies; their probable origins are discussed. Combining our new photometric data with global velocity dispersion () derived from emission line widths we have reviewed the relation. A reanalysis of the properties of the GEHRs included in our sample shows that age spread and the superposition of components in multiple regions introduce a considerable spread in the regression. Combining the information available in the literature regarding ages of the associated clusters, evolutionary footprints on the interstellar medium, and kinematical properties of the knots that build up the multiple GEHRs, we have found that a subsample - which we refer to as young and single GEHRs - do follow a tight relation in the plane.
keywords:
galaxies: individual: NGC6822, M33, M101 – H ii regions – galaxies: star clusters1 Introduction
Accurate photometry of Giant HII Regions (GEHRs) is a key source of information about the energetics of these large star-forming regions. The luminosity emitted through the recombination lines of ionised hydrogen (Hα, Hβ) allows to estimate the number of ionising photons which in turn establish the requirements for the stellar population responsible for such an ionising flux. Several reviews have already discussed these properties, such as Kennicutt [1979; K79], Shields [1990] and Melnick [1992].
These emission lines had been found to have supersonic widths by Smith & Weedman [1970], [1971]. Such behaviour is puzzling, as supersonic motion cannot be sustained without a source of energy to fuel it. Melnick [1977] and later Terlevich & Melnick [1981] found that the gas velocity dispersion () measured from a recombination line in giant HII regions correlates well with the total luminosity () emitted in the respective line, and also with the overall radius of the nebula (). In a logarithmic plane, total flux and nebula radius follow a linear relation with the line width [1981] and the following approximations hold: and . These dependences resemble much those of virialised systems, such as globular clusters and elliptical galaxies, and lead the authors to suggest a gravitational explanation for this observed kinematical behaviour. Other authors confirmed the existence of a correlation, although they found different slopes for the linear regression. New models were produced to account for the underlying dynamics. Turbulence (, Hippelein [1986]) and multiple shells (, Arsenault & Roy [1988]) were introduced in the models. Fuentes Masip et al. [2000] have obtained imaging spectroscopy of the irregular galaxy NGC 4449 with which they detected and analysed its giant HII regions. They studied the correlation of size and luminosity with the velocity dispersion and found a regression for the subsample that showed supersonic motions, high surface brightness and single Gaussian emission lines. This linear regression in the log plane had a slope of which is consistent with a gravitational origin of the supersonic motions.
The intriguing aspect of the – relation is that although we know that massive stars produce strong winds and in many cases we can see features that look like shells, the scaling laws seem to suggest that gravity may play a central role. Attempts to determine the main broadening mechanism in HII regions with supersonic linewidths were made for the closest and most luminous GEHRs within the Local Group, 30 Doradus in the Large Magellanic Cloud and NGC 604 in M 33. Chu & Kennicutt [1994] used longslit echelle spectroscopy data on several positions of 30 Doradus and found that its global supersonic linewidth breaks up into a large number of smaller supersonic structures, which combine with a smooth underlying turbulent velocity field. They suggested that gravitation could not contribute significantly to the observed nebular kinematics. This finding was partly confirmed by Melnick, Tenorio-Tagle and Terlevich [1999] who obtained a single longslit echelle spectrum with higher resolution and signal to noise ratio. The slit used to obtain the spectrum, passed through several important features which are analysed in their paper. However, they find no discrete component with supersonic velocity widths, beyond a very broad component ( 45 km s-1) found towards all lines of sight. This does not seem to be the case for NGC 604. Muñoz-Tuñón et al. [1996; MTCT], analysed high spatial and spectral resolution H emission line data on NGC 604 and concluded that although there is a contribution from shells and filaments to the observed gas kinematics, the overall supersonic behaviour is dominated by unresolved components, observed throughout the whole intensity range. By modelling the expected behaviour of the emission line supersonic width and intensity of a GEHR they suggested evolutionary effects to explain their different observed behaviour. In a similar study, Yang et al. [1996] concluded that a substantial fraction of the broadening must be due to gravity.
The regression among global characteristics of GEHRs also holds for HII Galaxies. These are luminous star forming regions that dominate the galaxian energy output. The relation between a distance independent parameter, such as the linewidth, and the luminosity of the object allows us to use them as distance indicators. The strength of the flux emitted in the recombination lines of these objects makes them available as far as , and even further with the new generation large telescopes. Lowenthal et al. [1997] have already obtained Keck spectroscopy of a sample of galaxies from the Hubble Deep Field project [1996]. They found that these objects seem to lie at the bright end of the luminosity - size relation present for HII galaxies although the starburst origin of their observed spectra remains to be proven. Melnick et al. [2000], making use of Guzmán et al. [1997] together with Koo et al. [1996] and Pettini et al. [1998] data for high , have re-analysed the luminosity - linewidth regression for HII galaxies and found a good correlation up to z 3, in spite of several systematic effects that might be increasing the observed scatter in the regression.
Previous studies dealing with the regression for the Giant HII regions have used datasets from a variety of sources and detectors, which may lead to large internal errors of the samples. The largest and more homogeneous available photometric data in the literature for the H emission line in GEHRs is K79, which is used by Hippelein [1986] and Arsenault & Roy [1988] in their studies. Hβ photometry was performed by Melnick [1979; M79] and later by Melnick et al. [1987; MMTG]. These data are discrepant, reasons for that could be the use of non-linear detectors, the lack of good standards for narrowband emission line photometry, or uncertainties in the extinction corrections.
The disagreements between previous luminosity estimations of GEHRs suggests that errors in the determination of fluxes may be a main contributor to the observed spread in the regression. The goal of the present photometric study is to achieve a standard set of H emission fluxes from nearby extragalactic giant HII regions to use as the ‘local’ reference system. To this end we have performed CCD photometry on a set of GEHRs from galaxies with relatively well known distances, in order to calculate their absolute fluxes. The observations are described in Section 2, the data reduction is described in Section 3, and Section 4 introduces the flux calibration process designed for this work. The procedures used to obtain the total fluxes in each band are listed in Section 5 and the results, plus comparison with previous studies are shown in Section 6.
2 Observations
Figure1
Figure2
Figure3
Figure4
Figure5
Figure6
Figure7
Figure8
Figure9
Figure10
CCD frames of the selected Giant HII Regions were obtained during seven nights at the 1.0m Jacobus Kapteyn Telescope (JKT) in the Observatorio del Roque de los Muchachos (ORM) La Palma, Spain, in August 1997. Five out of the seven nights were of excellent photometric quality; a sixth one, although not photometric, was useful too. The last night of the run had variable sky conditions so the data was not included in the analysis. The average seeing conditions were monitored from the image quality of short exposures of the flux standard stars, and an upper limit was also estimated from stellar sources present in our longer exposed nebular frames. These estimations, and the atmospheric extinction measurements available from the Carlsberg Meridian Circle, also located at La Palma, are listed in Table 1.
| Date | Seeing | Extinction |
|---|---|---|
| (average) | (mag.) | |
| 09/08/97 | 090 | .11 |
| 10/08/97 | 086 | .11 |
| 11/08/97 | 091 | n/a |
| 12/08/97 | 102 | .11 |
| 13/08/97 | 100 | .11 |
| 14/08/97 | 096 | .19 |
| 15/08/97 | .18 |
The target objects, together with the flux standard stars were observed using four narrow-band filters. These are centred in H (6561Å), H (4861Å), and their adjacent continua (6656Å and 5300Å respectively). The main characteristics of the set of filters used are given in Table 2. Three of them are from the ING bank of filters. The H continuum filter was kindly provided by Don Pollaco, as the presence of nebular emission lines, such as [OIII] 4959,5007 Å made the available continuum filters useless.
| Filter | ING# | Peak Tr. | ||
|---|---|---|---|---|
| H | 60 | 6561 | 38 | 33.9 |
| H | 67 | 6656 | 44 | 47.5 |
| H | 81 | 4861 | 54 | 59.7 |
| H | … | 5300 | 50 | 58.5 |
The target objects from three different Local Group galaxies, namely NGC 6822, M 33, and M 101, were widely spread in right ascension. This allowed to sequentially observe them quite close to their passage through the local meridian, reducing the effects of large airmass corrections. On the other hand, the objects were observed on different days at different bandwidths, which complicates the calibration. Table 3 gives the observing log and figures 1 to 10 show the emission line flux distribution in the sky. These figures include a scale bar, as a guideline for linear sizes of the regions analysed in this paper.
| Object | H | H | H | H |
|---|---|---|---|---|
| NGC 588 | 12 | 12 | 14 | 14 |
| NGC 592 | 11 | 11 | 15 | 15 |
| NGC 595 | 10 | 10 | 10 | 14 |
| NGC 604 | 9 | 9 | 13 | 13 |
| NGC 5447 | 13 | 13 | … | … |
| NGC 5455 | 15 | 14 | … | … |
| NGC 5461 | 11 | 11 | … | … |
| NGC 5462 | 11 | 11 | … | … |
| NGC 5471 | 10 | 10 | … | … |
| NGC 6822I | 9 | 9 | 10 13 | 11 14 |
| NGC 6822III | 9 | 9 | 10 13 | 11 14 |
| BD+ | 9⋆ 10 11⋆ 12⋆ 13 15⋆ | 9⋆ 10 11⋆ 12 13 14⋆ | 10 13 14⋆ 15⋆ | 11⋆ 13 14⋆ 15⋆ |
| BD+ | 10⋆ 11⋆ 12 13⋆ 15 | 10⋆ 11⋆ 12 13 14 | 10⋆13⋆ 14 15 | 11⋆ 13⋆ 14 15 |
| Feige110 | 9 | 9 | … | … |
Bias frames and evening and morning flats were taken every day. The importance of the double set of flats is discussed in the following section.
3 Data Reduction
Standard procedures using IRAF software were followed for the initial steps of the data reduction. Bias frames were combined and used for calculating the additive zero point correction as usual. The correction for flat field, however, was more delicate as the nature of the flux calibration process discussed in the next section relies strongly on the flatness of the field illumination.
As mentioned above, we obtained blank sky exposures to correct from non-uniform illumination of the CCD. A simple check consisting on correcting one set of flat field images, say the evening ones, with the ones obtained the morning after, showed a non-uniform image with patterns still present in it. Figure 11 shows a section of a flatfield image taken with the H filter. Two sets of annular patterns can be seen. Some are small with clearly defined edges while others are larger with difuse edges. The smaller rings are neatly removed but the diffuse annuli remain. Ring-like patterns are usually associated with grains of dust, the reason for their appearance being that they are observed severely out of focus; they are usually referred to as ‘dust flakes’. The observed displacement might be explained if large rings are present in the filters. As the filter wheel does not park exactly in the same position each time the same filter is requested, the ring patterns are shifted. The smaller rings might therefore be present on other surfaces (i.e. dewar window) The dust flakes problem has its maximum effect in the H filter, and is negligible for the other ones.
Figure11
4 Flux calibration
4.1 Standard star magnitudes
After the preliminary steps mentioned in the previous section, the next stage is the flux calibration of our photometry. Narrowband emission line photometry is unusual. There is no set of standard stars calibrated as to perform a routine reduction process. There is no analog to the UBV system to use with H, H and their respective continuum filters. So to obtain photometry of emission line regions, like the GEHRs, some ad-hoc calibration has to be adopted. To achieve this, we have chosen three HST spectrophotometric stars (BD+, BD+, and Feige110 [1990]) for which flux is calibrated and tabulated every 1 or 2 Å. This high resolution allows to calculate their absolute flux (or magnitude) through every single filter of our system. This can be achieved integrating numerically, as the transmission curves of the used filters, scanned at the ORM, are available. We can define the absolute flux in a filter as:
| (1) |
where is the central wavelength of the filter with transmission curve and is the absolute flux of the star.
The calibration magnitude of the observed standard stars for each filter was calculated as , as it would be measured outside the earth’s atmosphere. The results are listed in Table 4.
| BD 28∘4211 | BD 33∘2642 | Feige 110 | |
|---|---|---|---|
| 1041.30 | 922.61 | 304.23 | |
| -7.5439 | -7.4125 | -6.2080 | |
| 6650Å) | 1070.84 | 881.30 | 320.41 |
| 6650Å) | -7.5743 | -7.3628 | -6.2643 |
| 5300Å) | 2575.10 | 1901.85 | 764.53 |
| 5300Å) | -8.5270 | -8.1979 | -7.2085 |
| 3484.94 | 2475.61 | 995.02 | |
| -8.8555 | -8.4842 | -7.4946 |
4.2 Atmospheric extinction correction
The disadvantage of working with these flux standard stars is the limited number of observations per night, as there is only one star per field. Nevertheless, as we had perfect photometric conditions during the first four nights of our run, we could gather the data available from these nights to perform the extinction correction. Also, within our own photometric system, the transformation from observed to calibrated magnitudes does not require the introduction of colour corrections. The transformation equations are written as
| (2) |
where is the star calibrated magnitude and is the observed magnitude, is the zero-point correction for each filter (to account for slight differences between the tabulated and real transmission of the filter), is the normalised airmass ( at zenith) and is the extinction in magnitudes due to the airmass .
The magnitudes of the standard stars were obtained performing aperture photometry on the observed stars, using IRAF’s version of DAOPHOT. We considered a different value of Z for each filter, but assumed the same value of for all filters. As we are working within a small range of wavelengths (4860 - 6650 Å) this is a reasonable approach. The set is solved numerically by least squares. The results are shown in Figure 12 and listed in Table 5.
| Parameter | Fit Value | Error |
|---|---|---|
| -0.0766 | 0.036 | |
| 0.2421 | 0.037 | |
| 0.0279 | 0.046 | |
| 0.8166 | 0.042 | |
| -0.0900 | 0.026 |
The set of defined extinction corrected magnitudes is applied to the following nights, when the sky conditions are expected to be slightly different. For these nights we can apply the results of the calibration, where the parameter is known, and find the new value of , which might differ from the previous one due to atmospheric changes. The values of were checked, in order to see if conditions also changed during the night, which was the case for the last night of observations. The number of standard stars observations were not enough to quantify this variability and account for it, so we decided not to use the data from the last night.
4.3 Calibrating the frames
Having flatfielded the frames and defined a relation between absolute flux (or magnitude) and the number of counts detected, we can use the flux-to-counts relation established for the standard stars throughout the whole field of the CCD and apply it to our program objects. Before this, images were aligned, cosmic ray cleaned and had their continuum contribution subtracted following standard procedures. More details can be found in Bosch [1999].
The flux standard stars have almost featureless continua. Hence the flux remains almost constant throughout the whole filter range. This is not the case for the line flux emitted by the nebulae, as the emission is concentrated in less than one Å. The factor by which we are underestimating the line flux when assuming it has a flat distribution is calculated. The true flux can be obtained making use of spectroscopy already published in the literature from which we know the central wavelength and dispersion of the emission line for our objects. Therefore we can construct a Gaussian emission line
| (3) |
where and are selected according to the known radial velocities and observed line widths. Galaxies in the Local Group do not have large radial velocities, so the wavelength of the emission lines are close to the rest value. The typical width () of the emission lines comes from their supersonic velocity dispersion, 30 km s-1, which corresponds to a width of approximately 0.67 Å for the H line.
The Gaussian emission line defined in Eq.3 has unit flux by definition, so we can use a similar procedure to the one used for the continuum. In this case we have to calculate the throughput of this artificial line through the filter,
| (4) |
which yields the conversion factor, , necessary to correct from the observed flux into true flux for the relevant emission line.
The narrow emission line, is not the only contribution to the measured flux in the filter, due to the presence of the forbidden [NII] Å lines within the range of the filter. In order to estimate – and correct for – the intensity of these lines, we have gathered information available in the literature about their relative intensities with respect to and introduced in the simulation described above, Gaussian profiles with their respective intensities. The net expected true intensity from the emission has then been calculated.
The line intensities from the literature are listed in Table 6. In the case of NGC 5462 and NGC 5447 only the total value for both lines was available in Smith [1975]. To follow the procedure described above, we need to introduce intensities for each [NII] line in the simulated spectrum in order to calculate their relative effect due to the observed redshift. The intensity for each of the [NII] lines was obtained from the total one, considering average intensity ratios between both [NII] lines (). The value for NGC 592 (which doesn’t exist in the literature) was estimated considering the fact that there is a radial gradient in the abundance of nitrogen detected in M 33 [1988] and that the region is 3.4 kpc away from the centre of the galaxy, quite close to the radial distance of NGC 604 and NGC 595. An average of the intensities of the [NII] lines for these two regions was used to estimate the intensity of the lines in NGC 592.
| Region | [NII] | [NII] | Ref. | |
|---|---|---|---|---|
| NGC 588 | 0.012 | 0.034 | 0.975 | 1 |
| NGC 592 | 0.045 | 0.125 | 0.912 | * |
| NGC 595 | 0.047 | 0.134 | 0.903 | 2 |
| NGC 604 | 0.043 | 0.117 | 0.907 | 1 |
| NGC 5447 | 0.023 | 0.070 | 0.961 | 3 |
| NGC 5461 | 0.037 | 0.110 | 0.941 | 4 |
| NGC 5462 | 0.040 | 0.119 | 0.937 | 3 |
| NGC 5471 | 0.008 | 0.026 | 0.987 | 4 |
| NGC 6822I | … | 0.018 | 0.992 | 5 |
| NGC 6822III | … | 0.019 | 0.992 | 5 |
5 and photometry
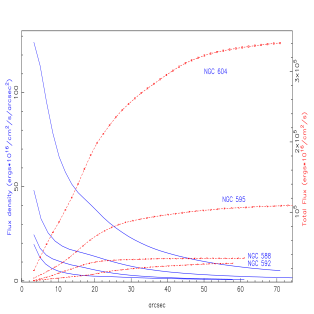
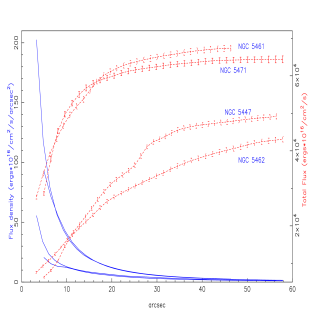
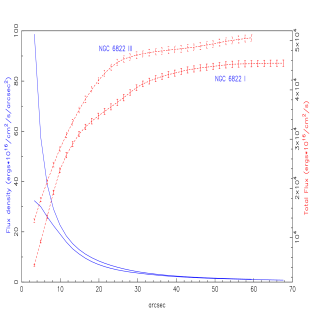
The photometric analysis was done with the PHOTOM, GAIA and ESP packages from STARLINK. These allow to measure flux within increasing radius from the centre and build a curve of growth in order to obtain the total flux of the GEHR in each emission line.
The centre point for calculating the curve of growth was selected to coincide with the position of the ionising stellar cluster for the rounded, symmetrical regions. The position of each cluster was determined from the observations in the previously aligned continuum bands. In the case of multiple regions, the curve of growth starting point was found by centring the global emission of the whole region. Although this lead to centres which did not correspond to any observed feature in particular, the shape of the curve of growth was better defined and allowed a better estimation of its asymptotic value. To do this we compared the flux increase on three succesive rings to the estimated flux noise. When this increment was found to be smaller than the uncertainties, the aperture integration was stopped and the final flux value recorded.
By visual inspection of the images, the residuals due to over or under subtraction of stars were detected, marked as ‘bad pixel’ regions and neglected when calculating the observed flux.
5.1 Estimation of the photometric errors
The curve of growth procedure described previously yields the total flux detected for each region. The error bars shown in the corresponding plots (13, 14, 15) represent the uncertainty due to the photon counting process, determined by the AUTOPHOTOM package. As we are dealing with extended objects, the errors in the determination of the background emission are very important. To account for this, we estimate the noise in the photometry from the dispersion measured in the regions used to perform the background subtraction instead of using the nominal readout noise of the CCD. This ensures a more realistic estimate of the uncertainties involved in the process.
As for the flux calibration errors, there is an unavoidable uncertainty in the zero-point correction () and the extinction per airmass unit (). The overall uncertainty can be calculated then differentiating the expression that links observed flux () and counts () in the detector:
| (5) |
which leads to
| (6) | |||||
Dividing this uncertainty by the total flux measured, we can get the relative error in the flux determination:
| (7) |
From the curves of growth (figures 13 to 15) it can be seen that the relative error due to the photon counting and background noise is about 4%, or less. The goodness of the extinction correction was also shown in the parameters of the fit to the standard stars included in table 5. From this table an average error of 0.04 can be estimated for the zero point correction and of 0.03 for the uncertainty in the determination of the extinction per airmass unit. As the airmass of the observed objects was always smaller than 2, a rough average of 1.5 for leads to an estimate for the second term of equation 7 of 7%. Finally a 2% error should be accounted for the ‘dust flakes’ problem in the flat fields. Hence, we consider that a value of 13% correctly represents – conservatively – the relative error in the fluxes determined in this work.
5.2 Interstellar Extinction Correction
Both and fluxes were obtained for six of the observed regions allowing an extinction correction. We will summarise the standard procedure now, specifying the nomenclature used to avoid confusion:
The observed flux at a wavelength of an intrinsic flux after passing through a medium of optical depth is
| (8) |
The ratio of observed to true intensities at different wavelengths is then
| (9) |
It is assumed that the interstellar extinction has the same wavelength dependence, so
| (10) |
Using logarithms in base 10, and for the case of and we have
| (11) |
where , and taking logarithms
| (12) |
allows us to calculate the extinction factor . The measured ratio of observed fluxes can be compared with the theoretical ratio of the same pair of lines for an HII region. Case B recombination theory for an ionisation bound nebula at K, predicts the logarithm of the ratio of and fluxes to be 0.454 [1971]. The values are obtained from Osterbrock [1989]. This value of is found in the literature as , the logarithmic absorption coefficient.
The logarithmic absorption coefficient, which we need, can be calculated from as
| (13) |
so, we can rearrange Eq.12
| (14) |
where is . Replacing Eq.13 for :
| (15) |
6 Results
The total flux for each region was derived from the asymptotic value determined by the curve of growth method. In order to analyse the effects of residuals in the sky and continuum subtraction, we have performed the photometry using different methods for sky estimation and masking of the features not perfectly removed by the continuum subtraction.
The measured and fluxes in the available bandwidths are listed in Table 7, together with our determinations for the logarithmic extinction coefficient. ‘Nil’ values correspond to those cases in which the measured ratio was equal to, or slightly lower than, the theoretical one. This might be suggesting there is some systematic problem between fluxes determined for both sets of filters, and we will discuss this in the following sections.
| GEHR id. | |||
|---|---|---|---|
| NGC 588 | -11.48 | -11.87 | 0.00 |
| NGC 592 | -11.57 | … | … |
| NGC 595 | -10.97 | -11.44 | 0.01 |
| NGC 604 | -10.47 | -10.93 | 0.00 |
| NGC 5447 | -11.33 | … | … |
| NGC 5461 | -11.19 | … | … |
| NGC 5462 | -11.37 | … | … |
| NGC 5471 | -11.21 | … | … |
| NGC 6822 I | -11.36 | -11.86 | 0.03 |
| NGC 6822 III | -11.32 | -11.87 | 0.06 |
6.1 Comparison with previous photometric studies
The largest collection of total fluxes of GEHRs in the Local Group in the bandwidth have been obtained by M79 and MMTG. These are summarised in Table 8. We have included in column 2, the expected flux of Hβ from K79 Hα photometry, calculated using the theoretical ratio for Case-2 recombination (Osterbrock 1989). The discrepancies among the measured fluxes are easily noticed. There are several possible sources for these discrepancies. Firstly, the use of non-linear detectors can fail to register properly the large dynamical range of fluxes in GEHRs from the weak diffuse emission present over a large area to the strong flux emitted by conspicuous ‘knots’. Secondly, the flux calibration process for narrowband emission line photometry lacks of standard objects and a proper reference system, such as Johnson & Morgan [1953] for the UBV photometry. Thirdly, the extinction correction also varies among different studies, and can account for some of the discrepancies in the net fluxes calculated.
| GEHR id. | Kennicutt(1979) | Melnick(1979) | MMTG | |
|---|---|---|---|---|
| NGC 588 | -11.63 | -12.08 | -12.09 | -11.73 |
| NGC 592 | -11.82 | -12.27 | … | -11.61 |
| NGC 595 | -11.06 | -11.51 | -11.74 | -11.58 |
| NGC 604 | -10.60 | -10.95 | -11.15 | -11.17 |
| NGC 5447 | -11.80 | -12.25 | … | -12.57 |
| NGC 5461 | -11.50 | -11.95 | -11.89 | -12.29 |
| NGC 5462 | -11.82 | -12.27 | -12.37 | -12.21 |
| NGC 5471 | -11.45 | -11.90 | -11.97 | -12.10 |
| NGC 6822 I | -11.30 | -11.75 | -12.09 | -12.48 |
| NGC 6822 III | -11.23 | -11.68 | -12.05 | -12.49 |
The comparison of our results with previously published photometry on these HII regions is discussed separately in the following four sub-sections, in order to analyse the possible sources of disagreement. The differences between published fluxes and the ones obtained in the present study are presented in table 9. These are calculated as including available filters for each comparison. Hence, positive differences indicate our determined fluxes are stronger.
| GEHR id. | |||
|---|---|---|---|
| NGC 588 | 0.17 | 0.26 | -0.10 |
| NGC 592 | 0.22 | … | … |
| NGC 595 | 0.08 | 0.37 | 0.21 |
| NGC 604 | 0.09 | 0.18 | 0.20 |
| NGC 5447 | 0.43 | … | … |
| NGC 5461 | 0.30 | … | … |
| NGC 5462 | 0.43 | … | … |
| NGC 5471 | 0.25 | … | … |
| NGC 6822 I | 0.02 | 0.29 | 0.68 |
| NGC 6822 III | 0.00 | 0.32 | 0.74 |
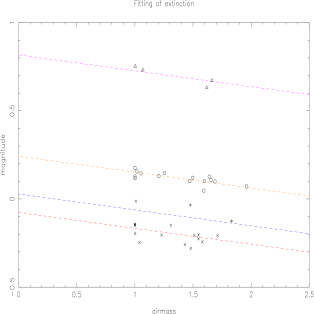
6.2 Comparison with K79
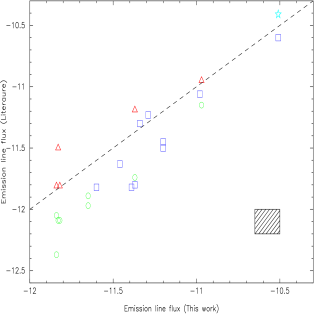
K79 obtained photographic plates (on Kitt Peak’s 2.1 m and 0.9 m telescopes) and photoelectric H photometry (Kitt Peak’s 0.9 m and Manastash Ridge 0.8 m telescopes fitted with RCA C31034 GaAs phototubes) of a large number of Giant HII regions which include all of our sample. Plotted in Figure 16 are our CCD photometry values on the x-axis vs. Kennicutt’s on the y-axis. Some regions show good agreement while others are too far from the line that indicates identical values. The deviant regions are almost all from the same parent galaxy, M 101. Although these regions have an integrated flux that is within the range of the other regions, they have a much concentrated profile, with a high flux density in the inner core as seen from the radial flux density profiles (figures 13 to 15). MMTG argue that there could be some problem with saturation in Kennicutt’s photometry, on the basis of a comparison with their H photometry, and a low H to H ratio.
The differences in the H flux measured for regions NGC 604 and NGC 595 are small, but are slightly larger for NGC 588 and NGC 592, all of them from the same host galaxy, M33. It is mentioned in K79 that photometry for lower brightness regions was obtained from photographic plates, which would enhance non linearity problems.
Errors could also arise from any systematic but undetected difference between the sky conditions during our observing run. This is a possibility, as most of the GEHRs in M101 were observed in the second half of the run. However, the scatter observed for the standard stars in those nights is much smaller than the differences in flux, and although regions NGC 595 and NGC 5471 were observed on the same night, only NGC 5471 shows a discrepancy between the fluxes calculated in this work and those from Kennicutt.
6.3 Comparison with M79
There are five regions in common with the H photometry performed by M79. In his work, the H emission fluxes were determined with a two-channel photoelectric photometer attached to the 1.5m telescope at the Palomar Observatory. The flux calibration was performed through the observation of three standard subdwarf F stars. Melnick estimates a conservative error of mag. although there could be somewhat larger systematic errors due to differences in angular sizes of the nebulae and its effect on the illumination of the photocatode.
Figure 16 shows a comparison between our H fluxes and the ones found in his work. The five regions in common are plotted with open circles. As it can be seen from the figure, there is a systematic difference between both results, being our values brighter by a factor of 2. A similar systematic difference can be seen with the H photometry which we will discuss below.
6.4 Comparison with MMTG
The comparison with MMTG photometry is more difficult, as there are five regions in common too, and there are no details about the photometric determinations in their paper. In figure 16 we can see that the overall agreement is good, although the discrepancy for one region (NGC 588) is somewhat larger than expected. As it was already discussed in Section 6, our H fluxes might be larger than expected when compared to H fluxes, as the ratio very rarely exceeds the theoretical value 2.82, expected for no extinction. Furthermore NGC 588 shows the smallest ratio (2.34) which suggests an overestimation of our H flux for that region.
MMTG show in their work a very good agreement with M79 photometry, which might seem puzzling as our data agrees only with one of them. This arises from the fact that the agreement between the previous studies holds for the larger sample in common, but not for the subset of the regions included in our sample.
Still, our H photometry is not as reliable as expected. Keeping this in mind, we will base most of our further analysis on the H photometry.
6.5 The case of NGC 604
In a recent paper Churchwell & Goss [1999] study the extinction within NGC 604 based on their own radio wavelength data from the Very Large Array (VLA) and CCD H photometry performed on an HST image from D. Hunter. We will further discuss their findings later in this paper. Their determined total H flux for the region, ergs cm-2 s-1 is in agreement within the errors with our value of .
7 Extinction maps
From the overall fluxes determined for each region we have calculated the ratio between the H and H fluxes, in order to estimate the extinction affecting the measured H flux. However, it is quite well known for star forming regions that the nebular characteristics are far from homogeneous. This applies to the extinction properties of the interstellar medium, which combines neutral, ionised and molecular gas, plus dust in different geometrical distributions. Churchwell & Goss [1999] have used the ratio between radio continuum and H to map the extinction properties in NGC 604 and analyse their correlation with the CO distribution from the work of Viallefond et al. [1992]. A low spatial resolution map was constructed by Maíz Apellániz [1999] using longslit flux calibrated spectra taken at different positions in NGC 604.
In order to obtain a ‘viewable’ version of the flux ratio map, the calibrated nebular images had to be filtered to remove low signal pixels that introduce large scatter when performing the pixel to pixel division. For the sake of clarity, we have removed all pixels which had flux lower than seven times the background noise. After performing the division, the spatial variations were smoothed filtering the resultant image. We chose a circular median filter with a four pixel radius, by means of the IRAF task rmedian. Although this introduces a degradation in the image spatial resolution, it helps to visualize the main trends in extinction changes.
From our data, we can produce extinction maps for NGC 604, NGC 595, and both observed regions in NGC 6822. These are shown in figures 17 to 20.
Figure17
Figure18
Figure19
Figure20
The extinction varies strongly throughout most of the GEHRs (the H/H flux ratio varies from 2.5 up to 7), which can be readily explained when considering the dramatic changes in the distribution of obscuring material in these star forming regions. NGC 6822 I turns out to be a singular case, as the H/H flux ratio remains constant and close to the theoretical expected value. This can be interpreted as a lack of obscuring matter (such as molecular clouds) which might suggest there is no material left over for further, or ongoing, star formation. We will discuss this issue in section 8.4.
8 The Luminosity - Velocity dispersion ( - ) relation for GEHRs
8.1 Luminosities
With the observed fluxes obtained in the previous section it is possible to determine the luminosity by correcting for the distance to the parent galaxy. The correction factor is simply , with expressed in cm. Distances are usually expressed in distance modulus related by , where is the distance in parsecs. The determination of accurate distance to the galaxies of the Local Group has been the central aim of several research projects. Distances to NGC 6822, M 33 and M 101 have recently been determined with primary indicators, such as Cepheids, by the HST Extragalactic Distance Scale Key Project [1991], [1996]. We have used the cepheid distance scale for the galaxies hosting the GEHRS included in this study and listed in Table 10. This indicator also agrees well with other determinations such as the tip of the red giant branch and the planetary nebula luminosity function, as discussed in Kennicutt et al. [1998]. Note that the estimated distances to the host galaxies include a considerable source of uncertainty which adds to the flux errors determined above.
| Galaxy | ||||
|---|---|---|---|---|
| M 33 | 24.63 0.09 | 49.93 | -0.23 | 0.18 |
| M 101 | 29.35 0.17 | 51.82 | +0.26 | 0.06 |
| NGC 6822 | 23.62 0.20 | 49.53 | +0.09 | 0.13 |
In order to compare with previous determinations, we have included results from M79, Hippelein [1986] (HH86), and MMTG. However, it must be kept in mind that each study has made use of the available distances from different sources and discrepancies in these distances introduce different corrections. We have included in Table 10 the correction to the logarithmic luminosity calculated with the distances adopted in this work, and the differences with the same factors derived for the distances used in previous works. It can be readily seen that the distance to the galaxy is a considerable source for disagreement in luminosities. The magnitude of these disagreements on the distance scales used and the problems that may have affected previous photometric studies, as described in the previous section make any comparison of the calculated luminosities almost impossible.
| M79 | HH86 | MMTG | This work | |
|---|---|---|---|---|
| GEHR id. | ||||
| NGC 588 | 38.08 | 38.61 | 38.25 | 38.47 |
| NGC 592 | … | 38.42 | 38.44 | 38.33 |
| NGC 595 | 38.64 | 39.18 | 38.55 | 38.95 |
| NGC 604 | 38.83 | 39.64 | 38.80 | 39.42 |
| NGC 5447 | … | 39.82 | 39.59 | 40.45 |
| NGC 5461 | 39.93 | 40.12 | 39.77 | 40.62 |
| NGC 5462 | 39.72 | 39.80 | 39.65 | 40.43 |
| NGC 5471 | 39.73 | 40.17 | 39.85 | 40.62 |
| NGC 6822I | 38.46 | 38.36 | 37.59 | 38.21 |
| NGC 6822III | 38.30 | 38.44 | 37.59 | 38.30 |
8.2 Velocity dispersions
Velocity dispersions have been independently obtained by several groups analysing the kinematics of GEHRs. These efforts can be split according to the spatial resolution of the instruments used for the estimations into large and small scale observations. I will discuss in this section the large scale observations, as these are directly linked to the overall luminosity measured for the HII regions. Melnick [1977], measured line profiles and determined turbulent velocities for a set of GEHRs in nearby galaxies using a Fabry-Perot interferometer at Palomar observatory when investigating the relation of the velocity dispersion with the linear diameter of giant HII regions. The turbulent velocity is determined from the observed line profile after correcting from the instrumental profile and the thermal contribution to the observed width of the emission line . Hence:
| (16) |
HH86 obtained newer F-P interferometric data, including a larger sample of regions with dissimilar results. Independently Roy et al. [1986] (RAJ86) obtained another set of velocity dispersions for extragalactic HII regions. The agreement of both sets of measurements for the regions included in our study can be easily seen in Table 12. In a later analysis MMTG combined the data available for H and [OIII] from HH86 and characterised the gas kinematics with .
| GEHR id. | HH86 | RAJ86 | MMTG |
|---|---|---|---|
| NGC 588 | 12.9 0.4 | 14.9 (21.1 1.0) | 12.8 |
| NGC 592 | 13.6 1.0 | 12.1 (17.1 1.0) | 12.6 |
| NGC 595 | 17.8 0.8 | 19.2 (27.1 1.6) | 17.2 |
| NGC 604 | 17.8 0.3 | 16.3 (23.1 0.8) | 16.8 |
| NGC 5447 | 20.3 0.6 | 21.2 (30.0 1.2) | 19.3 |
| NGC 5461 | 21.5 0.3 | 24.7 (35.0 1.3) | 20.3 |
| NGC 5462 | 24.2 0.4 | … | 21.8 |
| NGC 5471 | 22.4 0.4 | 21.3 (30.2 1.0) | 21.0 |
| NGC 6822I | 10.5 0.2 | 9.5 (13.4 0.8) | 9.8 |
| NGC 6822III | 10.3 0.3 | 10.4 (14.7 0.9) | 9.5 |
There are several other studies of spatial variations in the kinematics of these large regions. These were done mostly with echélle spectroscopy (Skillman & Balick [1984], Chu & Kennicutt [1994]) and with the TAURUS Fabry-Perot Imaging Spectrograph on the 4 m. William Herschel Telescope in La Palma (Muñoz-Tuñón et al. [1995; MGC95], [1996; MTCT], Yang et al. [1996]). TAURUS [1980] allows to obtain simultaneously high resolution spectroscopic information with its etalon grating and seeing limited imaging. These studies added new information regarding the smaller scale kinematics of these regions, showing there is a combination of shell structures, loops and supersonic motions down to the smallest observable detail. We will discuss these important results in section 8.4.
8.3 The vs regression
As already mentioned, several studies analysed the existence of a correlation between the total luminosity emitted by a giant HII region in one of its Balmer lines and the velocity dispersion of the gas measured from the width of such line. The slope derived for this regression is a crucial parameter to find an explanation for the source of such a relation. In this section we will analyse and discuss the existence of this correlation on the basis of our photometry.
We have combined the luminosities obtained in the previous section from our CCD photometry and the kinematical data used in MMTG in order to obtain an improved set of data for analysing their relation. The existence of a correlation was analysed by performing a least squares fit to the available data, accounting for errors in both coordinates. Errors were estimated to be about 10% in the kinematics and 20-25% in the luminosities. In the logarithmic plane, a linear regression is found, where
| (17) |
The data is plotted in Figure 21 together with the line showing the fit to the points. From the plot it can be readily seen that although there is a correlation, there is also a large scatter in the data. Deviations from the fit are too large for the expected uncertainties (a test on the fit yields a probability almost zero) and large enough to seriously limit its use to derive accurate luminosities from measured emission line widths.

It seems that, under the evidence of the new photometry here presented, the uncertainties in previous determinations of giant HII region luminosities were larger than estimated. Also, there is increasing evidence that there is an age spread between GEHRs and that this could modify noticeably the observed global parameters. However, our knowledge of the finer details of some of these regions can help us select a more homogeneous sample.
8.4 The young GEHRs
The small scale kinematic studies brought new information to the analysis of GEHRs. Most of them showed that the supersonic profile obtained with global spectroscopic data is formed by the contribution of different regions within each GEHR with different kinematic behaviour. It was also found that this mixture of different contributions was not uniform for all HII regions; some regions have most of their flux coming from supersonic cores, others have a larger contribution from bubbles and shells. We have used this information to select a more homogeneous set of GEHRs out of our sample. Particularly for the farthest regions, for which the angular resolution makes any guessing of its structure impossible. Based on the assumption that the large shells and bubbles are formed at later stages of the evolution of these star forming regions is that we will refer to those regions that do not show evidence of loops and filaments as the young GEHRs. We will use spatially resolved kinematical data to disentangle the multiple blobs that form the M 101 GEHRs and identify those who show supersonic velocity widths. Including the available information, and making use of the excellent seeing conditions for our photometric data we have re-analysed all the regions in our JKT photometry sample.
8.4.1 M 33 GEHRs
The galaxy M 33 is situated at about 840 kpc [1991]. The whole emission line region of the 30 Doradus nebula in the Large Magellanic Cloud, which is the one for which we have the best detailed information, would occupy only 1 arcmin, instead of the 15 arcmin it fills at its actual distance. However, at this distance it is still possible to resolve the presence of large bubbles, shells or any other evidence of nebular disruption and combine it with other information regarding its age or evolutionary stage of its components.
NGC 588
This region shows clear evidence, as seen in figure 1 that there is a compact core, but it also has at least two strong ring-like structures that contribute to the emitted flux. Kinematic data available from MTCT indicate the presence of shells with intensity comparable to the rest of the kinematic core. From the expected traces of evolution of GEHRs we consider this region as an older region which has been swept by strong winds and supernova explosions.
NGC 592
The H image shows two nuclei dominating the emission of the core of the region. A filamentary nebula surrounding the core and extending out to large distances, makes it difficult to find an asymptotic value to determine the total flux (see Figure 2). There is no data about the small scale kinematics of this region, although its structure reveals a strong interaction with the external environment, suggesting an older age too. The presence of two condensed knots makes it an interesting target for analysing their kinematical properties with TAURUS-like Fabry-Perot interferometers.
NGC 595
This region has a structure quite similar to that of NGC 592. There are a number of dispersed strong knots, visible in figure 3. There is no data available from small scale kinematics for this region. However, Malumuth et al. [1996] have obtained multiband HST/WFPC2 images of the ionizing stellar cluster. They derive an age of 4.5 Myr which indicates it is a somewhat evolved cluster consistent with the presence of Wolf-Rayet stars. [1993].
NGC 604
The region NGC 604 shows an extended structure, and some small loops can be identified within the nebula. There is, however no strong evidence of disruption of the nebula, as the stellar cluster remains enshrouded by the nebula in the H image shown in figure 4. A comprehensive investigation of the kinematics of NGC 604 was carried out by Yang et al. [1996]. In their work they gathered longslit echelle spectroscopy and TAURUS data and detected expanding shells together with an overall presence of broad profiles in every position within the region. They plotted the measured FWHM of the profiles versus their intensity and found that the brightest profiles define a narrow band in such diagram. This band, with a median value of 36 km s-1 include most profiles of the distribution, and dominates the total observed flux. TAURUS data in MTCT shows a similar distribution in the vs. diagram. It was proposed in both papers that gravitation would be responsible for the profiles in the narrow band, and hence dominate the kinematics of the region. González Delgado & Pérez [2000] combined archival HST data, together with spectra from the International Ultraviolet Explorer (IUE) and optical spectra from the William Herschel Telescope (WHT) to analyse the evolutionary state of the region. They combined the available information from stellar wind resonance lines, nebular optical emission lines and HeI absorption lines present in the spectra of NGC 604 to derive a 3 Myr age for a single burst that originated the central ionising cluster. All these facts indicate that NGC 604 can be considered as a young GEHR.
8.4.2 M 101 GEHRs
The spiral galaxy M 101 lies at about 7.4 Mpc from us [1996]. This is ten times more distant than M 33 and consequently with a linear resolution one order of magnitude smaller. The apparent size of the 30 Dor nebula at this distance would be of only 6 arcsecs. It is very difficult to base an analysis simply on the distribution of the emission flux, but we will rely on the information available from other kinematic studies, whenever available.
NGC 5447
This region, as almost all regions in M 101 has already been classified as ‘multiple’ due to the presence of several bright components [1982]. We have included an expanded view of this region in figure 22 and labelled the most conspicuous of these components or ‘knots’. Of particular interest is knot A, which is the strongest of all. There is no detailed kinematics for this region, although HH86 took spectra of the northern and southern part and found them to be almost identical. Considering this information we performed aperture photometry, taking increasing apertures centred in NGC 5447 A, using the local diffuse nebula to estimate the background level. In this way the net H luminosity of this particular knot is calculated, and found to be ergs s-1.
Figure22
NGC 5461
The multiplicity of NGC 5461 had already been suggested by Kennicutt [1984] and analysed by MGC95 with TAURUS. The knots, as identified by MGC95 are marked on our H image in figure 23. It can be predicted from the image that knot A dominates the overall flux. TAURUS data revealed that ‘well-behaved’ Gaussian emission lines show a velocity dispersion of 25 km s-1. Furthermore, these supersonic sigma values are restricted to knots A and B only. Knots C and E are kinematically detached from the region. This can be guessed from the figure, although the definitive confirmation is given by the resolution available with 2D spectroscopy.
In a similar way as described for NGC 5447 A we have calculated the H luminosity emitted by NGC 5461 A and found it to be ergs s-1.
Figure23
NGC 5462
The complex structure of this giant HII region is shown in figure 24. Two major knots, labelled A and B are much brighter than the remaining knots, but this particular region does not show a single dominant feature as is the case of the previous ones. There is no information available regarding the kinematical behaviour of these knots as to assign the characteristics of the global profile to any of these knots in particular. The approximate luminosities of knots A and B emitted in H are 3.5 and 4.5 ergs s-1 respectively.
Figure24
NGC 5471
NGC 5471 also shows multiple components. Skillman [1985] analysed spatial variations for this region and identified 5 knots which are labelled in figure 25. In that figure it can also be seen another weak component, A’, detected under better seeing conditions by MGC95. This latter study suggests that a large fraction (80%) of the region could be characterized by a constant emission linewidth of km s-1. We have estimated the H luminosity emitted by knot A to be ergs s-1.
Figure25
8.4.3 NGC 6822 GEHRs
NGC 6822 is an irregular galaxy, situated at approximately 530kpc [1998]. It is the closest one from the sample studied here, and therefore the one that allows the best linear resolution, at 2.5 pc arcsec-1. O’Dell, Hodge and Kennicutt [1999] obtained HST photometry (using mainly emission line filters) and determined for both stellar clusters associated with the two regions analysed in this paper, an approximate age of 4 Myr.
NGC 6822 I
This region (figure 9) shows a spherical concentrated bulk, and an extended loop (or pair of loops). There is no detailed kinematical data, but one can expect that the global emission profile is dominated by the central core. However, the extinction map reveals that there is almost no dust left. This behaviour is not observed in other regions that show recent star formation activity and might suggest some evolution effects, though not as strong as in other GEHRs.
NGC 6822 III
This region has the emission highly concentrated too, with a bright nucleus and a nebular envelope, with no evidence of shell-like features (see figure 10).
8.4.4 The vs. for the young and single GEHRs
The analysis indicates that the GEHRs included in this study do not necessarily share the same global properties. This is evident in the case of total luminosity and global velocity dispersion. From the expected evolution of the kinematics of giant HII regions in the frame presented by Tenorio Tagle et al. [1993] and MTCT young GEHRs (those that do not show signs of evolution) should be governed by the gravitational supersonic motion induced by the stirring stars. To test this hypothesis, we have selected a sub sample that includes only those regions which do not show evident signs of evolution, such as loops or shells. We have also included the dominant cores of the multiple regions in M 101, as their sizes are comparable to the 30 Dor Nebula, suggesting by analogy, that these cores are the most prominent members of an agglomeration of HII regions.
The selection process is summarised in Table 13. Although the age determinations are very dependent on the used evolutionary tracks for each case, we are discarding regions that are 4.5 Myr old, or seem to be even older. Regarding the multiplicity, we are only including knots that have properties that suggest the existence of a kinematical core.
| GEHR name | Age | Kinematical core |
|---|---|---|
| NGC 588 | Myr | … |
| NGC 592 | Myr | … |
| NGC 595 | Myr | … |
| NGC 604 | Myr | … |
| NGC 6822 I | 4 Myr | … |
| NGC 6822 III | 4 Myr | … |
| NGC 5447 | … | NGC 5447A |
| NGC 5461 | … | NGC 5461A |
| NGC 5462 | … | nil |
| NGC 5471 | … | NGC 5471A |
No matter what quantitative criteria is established, the final decision turns out to be subjective at this stage. There is a compromise between discarding any region that shows signs of evolution and keeping a fair number of GEHRs as to attempt a regression analysis. Therefore, the short list includes: NGC 6822 I, NGC 6822 III, NGC 604, NGC 5471 A, NGC 5461 A, and NGC 5447 A. A similar plot as the one presented in figure 21 but for the mentioned subsample is shown in figure 26. In it we have included the linear fit to the points, which was found to be
| (18) |
The slope and zeropoint are – within the errors – in agreement with the values found by Fuentes-Masip et al. [2000] for their sample of high surface brightness giant HII regions in NGC 4449, supporting a virialised system as the origin of the supersonic motions.

9 Discussion
This paper presents the results of new and CCD photometry of ten Giant HII Regions lying in Local Group galaxies. The comparison of these fluxes with previous work suggests some systematic errors affecting the flux determinations made with photoelectric detectors.
A serious problem is the lack of a uniform method for flux calibration and for that we have introduced the use of spectrophotometric standards in order to rigorously calculate the continuum flux correction. Accounting for the fact that the filter used is broader than the emission feature is very important, and it is generally not discussed in papers dealing with this issue. Accurate knowledge of the emission line characteristics are crucial in order to calculate its position within the filter transmission curve and its relative width. All these make the narrowband photometry of emission line objects a very difficult one, specially when they are extended objects and aperture spectrophotometry is not possible either.
The analysis presented here has two important although apparently dissimilar results:
-
•
Giant Extragalactic HII Regions are far too heterogeneous objects as to blindly include them in a sample for use as an accurate (rms ) distance indicator.
-
•
Young GEHRs and the kinematical cores of GEHRs included in this study do follow a tight relation in the vs. plane.
The first item does not preclude the use of GEHRs as a distance indicator, but establishes that a careful selection based on the kinematical properties – or ages – of these is a must, as the luminosities of the young GEHRs and kinematical cores seem to correlate very well with the velocity dispersion of the region. The use of the total H (or H) luminosity of the region has not eliminated the problem of dealing with other parameters of the nebula, as it was hoped it would. What were thought to be ‘supergiant’ GEHRs (such as NGC 5461 and NGC 5471) should be better considered as a group of HII regions, out of which one (or several) of them might be a true GEHR. The emission line flux originated in non-giant HII regions can be partially responsible for the observed scatter in the regression.
The second item mentioned above indicates that another factor that turns out to be very important is the age, or evolutionary stage, of the regions. It has already been shown for the particular case of 30 Doradus [1999], that older bursts of star formation can coexist in an active star forming region. Hence, the presence of clear signatures of recent massive star formation do not necessarily indicate that we are looking at an extremely young HII region. Although the most recent burst of stars will be responsible for the bulk of the ionisation of the gas – and hence of the emitted flux – the effect of previous stellar generations could have modified substantially the interstellar gas kinematics.
New observational efforts should be directed to the use of imaging spectrographs to analyse Giant HII Regions in the Local Group to learn more about the kinematical characteristics of the emitted flux. Other global properties from HII regions, such as the equivalent width of the H line known to vary with the evolutionary stage (Dottori [1981], Copetti et al. [1986]) can be used to estimate the age of the GEHRs. A calibration of a larger sample will be decisive to prove what is suggested from the data now available and to provide a link with what is observed for starburst galaxies.
Acknowledgments
The authors wish to thank fruitful discussions with Casiana Muñoz-Tuñón and Enrique Pérez. The JKT is operated on the island of La Palma by the Isaac Newton Group in the Spanish Observatorio del Roque de los Muchachos of the Instituto de Astrofísica de Canarias. We acknowledge PPARC funding for the observing run at La Palma, where the ING staff has been more than helpful. Special thanks again to Don Pollaco for lending us his own narrowband filter for H. Much of this work was developed during visits to INAOE who hosted and supported our stays there. GLB thanks partial funding from UNESCO and the Universidad Nacional de La Plata (UNLP) that supported travelling expenses. The authors acknowledge the data analysis facilities provided by the Starlink Project which is run by CCLRC on behalf of PPARC. In addition, the following Starlink packages have been used: PHOTOM, GAIA.
References
- [1988] Arsenault, R. and Roy, J. R.: 1988, Astron. Astrophys. 201, 199
- [1999] Bosch, G.: 1999, Ph. D. Thesis, University of Cambridge, UK
- [1971] Brocklehurst, M.: 1971, Mon. Not. R. Astron. Soc. 153, 471
- [1994] Chu, Y. H. and Kennicutt, R. C., J.: 1994, Astrophys. J. 425, 720
- [1999] Churchwell, E. and Goss, W. M.: 1999, Astrophys. J. 514, 188
- [1986] Copetti, M. V. F., Pastoriza, M. G., and Dottori, H. A.: 1986, Astron. Astrophys. 156, 111
- [1981] Dottori, H. A.: 1981, Astrophys. and Space Sci. 80, 267
- [1993] Drissen, L., Moffat, A. F. J., and Shara, M. M.: 1993, Astron. J. 105, 1400
- [1991] Freedman, W. L., Wilson, C. D., and Madore, B. F.: 1991, Astrophys. J. 372, 455
- [2000] Fuentes-Masip, O., Muñoz-Tuñón, C., Castañeda, H. ;. O. & Tenorio-Tagle, G.: 2000, Astron. J. 120, 752
- [2000] González Delgado, R. M., Pérez, E.: 2000, Mon. Not. R. Astron. Soc. 317, 64
- [1997] Guzmán, R., Gallego, J., Koo, D. C., Phillips, A. C., Lowenthal, J. D., Faber, S. M., Illingworth, G. D. & Vogt, N. P.: 1997, Astrophys. J. 489, 559
- [1986] Hippelein, H. H.: 1986, Astron. Astrophys. 160, 374
- [1953] Johnson, H. L. and Morgan, W. W.: 1953, Astrophys. J. 117, 313
- [1997] Lowenthal, J. D. et al.: 1997, Astrophys. J. 481, 673
- [1996] Kelson, D. D., Illingworth, G. D., Freedman, W. F., Graham, J. A., Hill, R., Madore, B. F., Saha, A., Stetson, P. B., Kennicutt, R. C., J., Mould, J. R., Hughes, S. M., Ferrarese, L., Phelps, R., Turner, A., Cook, K. H., Ford, H., Hoessel, J. G., and Huchra, J.: 1996, Astrophys. J. 463, 26
- [1979; K79] Kennicutt, R. C., J.: 1979, Astrophys. J. 228, 394 (K79)
- [1984] Kennicutt, R. C., J.: 1984, Astrophys. J. 287, 116
- [1998] Kennicutt, R. C., J., Stetson, P. B., Saha, A., Kelson, D., Rawson, D. M., Sakai, S., Madore, B. F., Mould, J. R., Freedman, W. L., Bresolin, F., Ferrarese, L., Ford, H., Gibson, B. K., Graham, J. A., Han, M., Harding, P., Hoessel, J. G., Huchra, J. P., Hughes, S. M. G., Illingworth, G. D., Macri, L. M., Phelps, R. L., Silbermann, N. A., Turner, A. M., and Wood, P. R.: 1998, Astrophys. J. 498, 181
- [1996] Koo, D. C. et al.: 1996, Astrophys. J. 469, 535
- [1981] Kwitter, K. B. and Aller, L. H.: 1981, Mon. Not. R. Astron. Soc. 195, 939
- [1982] Lawrie, D. G. and Kwitter, K. B.: 1982, Astrophys. J., Lett. 255, L29
- [1999] Maíz Apellániz, J.: 1999, Ph. D. Thesis, Universidad Complutense de Madrid, Spain.
- [1996] Malumuth, E. M., Waller, W. H., and Parker, J. W.: 1996, Astron. J. 111, 1128
- [1977] Melnick, J.: 1977, Astrophys. J. 213, 15
- [1979; M79] Melnick, J.: 1979, Astrophys. J. 228, 112 (M79)
- [1992] Melnick, J.: 1992, in Star formation in stellar systems, III Canary Islands Winter School of Astrophysics, Puerto de la Cruz, Tenerife, Spain, December 2-13, 1991, Cambridge University Press, 1992, edited by Tenorio-Tagle, G., Prieto, M. and Sanchez, F.
- [1999] Melnick, J., Tenorio-Tagle, G. and Terlevich, R.: 1999, Mon. Not. R. Astron. Soc. 302, 677
- [1987; MMTG] Melnick, J., Moles, M., Terlevich, R., and García-Pelayo, J. M.: 1987, Mon. Not. R. Astron. Soc. 226, 849 (MMTG)
- [1988] Melnick, J., Terlevich, R., and Moles, M.: 1988, Mon. Not. R. Astron. Soc. 235, 297
- [2000] Melnick, J., Terlevich, R. & Terlevich, E.: 2000, Mon. Not. R. Astron. Soc. 311, 629
- [1994] Muñoz-Tuñón, C.: 1994, in Violent star formation: From 30 Doradus to QSOs. Proceedings of the first IAC-RGO meeting held in Puerto Naos, La Palma, Spain, November 8-12, 1993, Cambridge University Press, 1994, edited by Tenorio-Tagle, G.
- [1995; MGC95] Muñoz-Tuñón, C., Gavryusev, V., and Castañeda, H. O.: 1995, Astron. J. 110, 1630 (MGC95)
- [1996; MTCT] Muñoz-Tuñón, C., Tenorio-Tagle, G., Castañeda, H. O., and Terlevich, R.: 1996, Astron. J. 112, 1636 (MTCT)
- [1999] O’Dell, C. R., Hodge, P. W. and Kennicutt, R. C. 1999, Pub. Astr. Soc. Pac. 111, 1382
- [1989] Osterbrock, D. E.: 1989, in Astrophysics of gaseous nebulae and active galactic nuclei. Mill Valley, CA, University Science Books, 1989
- [1980] Pagel, B. E. J., Edmunds, M. G., and Smith, G.: 1980, Mon. Not. R. Astron. Soc. 193, 219
- [1998] Pettini, M., Kellogg, M., Steidel, C. C., Dickinson, M., Adelberger, K. L. & Giavalisco, M.: 1998, Astrophys. J. 508, 539
- [1982] Rayo, J. F., Peimbert, M., and Torres-Peimbert, S.: 1982, Astrophys. J. 255, 1
- [1986] Roy, J. R., Arsenault, R., and Joncas, G.: 1986, Astrophys. J. 300, 624 (RAJ86)
- [1974] Sandage, A. and Tammann, G. A.: 1974, Astrophys. J. 190, 525
- [1999] Selman, F., Melnick, J., Bosch, G., and Terlevich, R.JA.: 1999, Astron. & Astrophys. 347, 532
- [1990] Shields, G. A.: 1990, Ann. Rev. Astron. Astrophys. 28, 525
- [1985] Skillman, E. D.: 1985, Astrophys. J. 290, 449
- [1984] Skillman, E. D. and Balick, B.: 1984, Astrophys. J. 280, 580
- [1975] Smith, H. E.: 1975, Astrophys. J. 199, 591
- [1970] Smith, M. G. and Weedman, D. W.: 1970, Astrophys. J. 160, 65
- [1971] Smith, M. G. and Weedman, D. W.: 1971, Astrophys. J. 169, 271
- [1980] Taylor, K. and Atherton, P. D.: 1980, Mon. Not. R. Astron. Soc. 191, 675
- [1993] Tenorio-Tagle, G., Muñoz-Tuñón, C., and Cox, D. P.: 1993, Astrophys. J. 418, 767
- [1981] Terlevich, R. and Melnick, J.: 1981, Mon. Not. R. Astron. Soc. 195, 839
- [1990] Turnshek, D. A., Bohlin, R. C., Williamson, R. L., I., Lupie, O. L., and Koornneef, J.: 1990, Astron. J. 99, 1243
- [1992] Viallefond, F., Boulanger, F., Cox, P., Lequeux, J., Pérault, M., and Vogel, S. N.: 1992, Astron. & Astrophys. 265, 437
- [1988] Vílchez, J. M., Pagel, B. E. J., Díaz, A. I., Terlevich, E., and Edmunds, M. G.: 1988, Mon. Not. R. Astron. Soc. 235, 633
- [1996] Williams, R. E. et al.: 1996, Astron. J. 112, 1335
- [1996] Yang, H., Chu, Y. H., Skillman, E. D., and Terlevich, R.: 1996, Astron. J. 112, 146