The joint XMM-Newton and Chandra view of YY Gem
Abstract
We have observed the flare star YY Gem simultaneously with XMM-Newton and Chandra as part of a multi-wavelength campaign aiming at a study of variability related to magnetic activity in this short-period eclipsing binary. Here we report on the first results from the analysis of the X-ray spectrum. The vicinity of the star provides high enough S/N in the CCD cameras onboard XMM-Newton to allow for time-resolved spectroscopy. Since the data are acquired simultaneously they allow for a cross-calibration check of the performance of the XMM-Newton RGS and the LETGS on Chandra.
Max-Planck Institut für extraterrestrische Physik, Postfach 1312, D-85741 Garching, Germany
Paul Scherrer Institut, Würenlingen & Villigen, 5232 Villigen PSI, Switzerland
Hamburger Sternwarte, Gojenbergsweg 112, D-21029 Hamburg, Germany
1. Introduction
YY Gem is the optically faintest of the three visual binaries in the Castor sextuplet. It is itself an eclipsing spectroscopic binary with period of d. The two components of YY Gem are both of spectral type dM1e, and belong to the class of BY Dra variables. Indeed, YY Gem was the first stellar system on which periodic photometric variability was detected (Kron 1952). Since the discovery of X-ray emission from the Castor system by the Einstein satellite, the system was studied by virtually all X-ray observatories (Vaiana et al. 1981, Pallavicini et al. 1990, Gotthelf et al. 1994, Schmitt et al. 1994, Güdel et al. 2001). Flares on YY Gem have been recorded from all parts of the electromagnetic spectrum. The extraordinary activity of this object may be related to its binarity (the frequency of photometric flares seems to be enhanced in the interbinary space suggesting interaction between the magnetospheres of the two stellar components; Doyle & Mathioudakis 1990), and makes it a prime target for simultaneous monitoring at different wavelengths.
2. Observations and Data Analysis
YY Gem was observed by both Chandra and XMM-Newton on Sep 29/30, 2000 for a total observing time of 59 ksec and 55 ksec, respectively. The XMM-Newton observations were obtained in the full-frame mode of EPIC-pn, with the thick filter inserted for both pn and MOS. We perform the data analysis with the standard XMM-Newton Science Analysis System (SAS). Chandra was used in the LETGS configuration, i.e. the Low Energy Transmission Grating (LETG) combined with the High Resolution Camera for Spectroscopy (HRC-S). We extracted the Chandra lightcurves and spectra using programs written in IDL version 5.4. The extraction areas for source and background spectrum are those defined in the Chandra User’s Guide.
The time of observation for the individual X-ray instruments is given in Table 1. We display the corresponding X-ray lightcurves in Fig. 1. The orbital phase has been computed from the ephemeris of Torres & Ribas (2001). First inspection reveals strong variability throughout the whole observation, including two large flares, and two ‘high states’ (i.e. extended phases of enhanced emission) near the end of the observation. The secondary eclipse is clearly identified as a dip in the lightcurve close to orbital phase . Note, that the minimum of the X-ray lightcurve is not exactly centered on , but slightly offset towards earlier times. As we have observed simultaneously with two independent satellites a timing error is very unlikely. This shift may indicate an inhomogeneous distribution of emitting material in the coronae of the YY Gem binary.
| Instrument | UT | JD - 2451817 | Expo | ||
| Start | Stop | Start | Stop | [ksec] | |
| XMM-Newton | |||||
| EPIC-pn | 18:56 | 08:57 | 0.2888 | 0.8730 | 50.47 |
| EPIC-MOS | 18:15 | 08:51 | 0.2604 | 0.8689 | 52.57 |
| RGS | 18:07 | 09:27 | 0.2542 | 0.8937 | 55.26 |
| Chandra | |||||
| LETGS | 21:30 | 13:54 | 0.3958 | 1.0792 | 59.00 |

The combination of XMM-Newton and Chandra allows to examine the X-ray spectrum of YY Gem with intermediate (EPIC) and high (LETGS, RGS) resolution, and to compare the performance of the grating instruments on both satellites. The CCD spectra obtained with the EPIC are analysed in the XSPEC environment (version 11.0.1).
3. The XMM-Newton EPIC spectrum
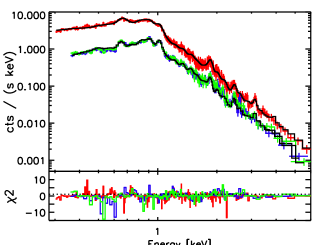
We start with the analysis of the quiescent spectrum observed prior to the first large flare in Fig. 1 (JD 2451817.256 JD 2451817.450). Following Güdel et al. (2001) we represent the quiescent EPIC spectrum of YY Gem by a 3-temperature (3-T) model for thermal emission from an optically thin plasma (VMEKAL). In order to better constrain the spectral model we analyse the spectra from the pn and the two MOS detectors simultaneously. For the joint modeling of the spectrum from these three instruments we add a constant normalization factor to make up for uncertainties in the absolute calibration of the detectors. The EPIC spectrum for the pre-flare phase is shown in Fig. 2, and the best fit parameters from the 3-T model are summarized in Table 2.
| [] | |||
| [] | |||
| O | Mg | Si | |
| S | Fe | Ni | (dof) |
| 1.24 (658) |
We use this spectrum as a baseline for time-resolved spectroscopy. The EPIC lightcurve of YY Gem is split in a total of 15 time intervals (listed in Table 3)
| Start | Stop | Remarks | Interval |
|---|---|---|---|
| [JD - 2451817] | |||
| 0.290 | 0.450 | pre-flare quiescence | |
| 0.450 | 0.475 | hump before flare | |
| 0.475 | 0.484 | rise flare 1 | |
| 0.484 | 0.493 | decay (a) flare 1 | |
| 0.493 | 0.510 | decay (b) flare 1 | |
| 0.510 | 0.525 | mini-flare | |
| 0.525 | 0.630 | post-flare quiescence | |
| 0.630 | 0.662 | secondary eclipse (1st half) | |
| 0.662 | 0.688 | secondary eclipse (2nd half) | |
| 0.688 | 0.710 | post-eclipse feature (a) | |
| 0.710 | 0.735 | post-eclipse feature (b) | |
| 0.735 | 0.775 | post-eclipse feature (c) | |
| 0.775 | 0.790 | rise flare 2 | |
| 0.790 | 0.805 | decay flare 2 | |
| 0.805 | 0.869 | ‘high state’ | |
representing different activity levels of the star, and the spectrum of each phase is modeled by a 3-T model. As the integrated light from the quiescent corona should be visible at all times we hold all temperatures and abundances fixed on the values given in Table 2, and vary only the emission measure. In some of the time segments, namely for the post-eclipse feature and during the large flares, the 3-T model does not provide an adequate description of the EPIC spectrum: A high energy excess stands out in the residuals suggesting the presence of higher temperature material in addition to the emission from the quiescent corona. Adding a fourth VMEKAL component does not lead to a significant improvement. Only a 5-T model represents the data well () during the phases of most intense emission. For the modeling of these time intervals we have fixed spectral components # on their quiescent values (see Table 2). All abundances of components # 4 and # 5 have been held fixed on solar values because the statistics do not allow to constrain further parameters. The last time interval (; the ‘high state’) is an exception: The signal at high energies is larger than for all other time segments, and broad Fe K-shell emission is clearly visible (see Fig. 2). We find an acceptable solution in this case for .

3.1. Temperature - Emission Measure Diagrams
The evolution of temperature and emission measure puts important constraints on the dynamics during flare decays. In a one-dimensional hydro-dynamic approach to model stellar flares developed by Reale et al. (1993) the duration of the heating determines the slope in the diagram. We have derived diagrams for the spectral components of the 5-T model that represent the heated plasma during the two large flares, i.e. VMEKAL components # 4 and # 5.

Fig. 3 shows the evolution of the two large flares, both starting with the rise phase (time interval and , respectively). Under the assumption that the flare emission is concentrated in a single loop the slope observed during the decay phase can be used to obtain an estimate for the loop half-length . This method has been calibrated for several instruments including EPIC-pn (F. Reale, priv. comm.). We apply the equivalent of Eq. 2 from Reale et al. (1997) to derive from the slope , the observed temperature (MK), and the decay constant of the lightcurve ( min). The resulting loop length is cm.
4. High-resolution Spectra: XMM-Newton RGS and Chandra LETGS
A comparison of the time-averaged first order X-ray spectra of YY Gem as observed with LETGS and RGS is given in Fig. 4. We only show the region between Å, which contains the strongest lines. Line identifications are given on top of the diagram.

The spectrum is given in units of cts/s/bin. Since the RGS and the LETGS observations overlap for about % in time, the relative strength of the lines measured by both instruments should be similar, with some dependence of the line strength on the binsize, and the absolute numbers demonstrate directly the difference in sensitivity between RGS and LETGS.
The Ly line of H-like O VIII is by far the strongest line in the spectrum with the highest photon flux, i.e. taking account of the effective area. Next to a number of iron L-shell transitions we identify the He-like triplets of four elements: Si XIII, Ne IX, O VII, and N VI. The O VII triplet is the strongest triplet and the only one which is clearly resolved and not blended with other lines. A detailed investigation of the properties of the coronal plasma making use of line ratios will be presented by Stelzer et al., in prep.
5. Summary
The X-ray lightcurve of YY Gem shows that the object was subject to strong variability including two large outbursts during the time of observation. The parameters of a 3-T model for the quiescent emission are compatible with results from the analysis of an earlier XMM-Newton observation of YY Gem presented by Güdel et al. (2001). Time-resolved modeling of the EPIC spectrum reveals the presence of a high temperature plasma (keV) in flares. According to a one-dimensional hydrodynamic model the flare emission arises in a semi-circular loop with cm length. This approach is certainly a simplification of the real situation which does involve a multi-temperature plasma and possibly complex loop systems. Nevertheless, the hydrodynamic approach is important: while simple quasi-static modeling tends to reproduce large loops the method applied here demonstrates that the coronal structures are likely to be much smaller than the radii of both stars in the YY Gem system.
The simultaneous observation of YY Gem with Chandra and XMM-Newton demonstrates the different sensitivity of these instruments. Each of the two RGS provides roughly the same count rate as the LETGS first order spectrum. The LETGS is more sensitive at short wavelengths (see e.g. the region around the Ne IX triplet), while the sensitivity of RGS is slightly higher towards longer wavelengths (e.g. near the O VIII Ly line).
Acknowledgments.
This work is supported by the Bundesministerium für Bildung und Forschung/ Deutsches Zentrum für Luft- und Raumfahrt (BMFT/ DLR), the Max-Planck Society, and the Heidenhain-Stiftung. MA acknowledges support from the Swiss National Science Foundation (grants 2100-049343).
References
Doyle J. G. & Mathioudakis M. 1990, A&A 227, 130
Gotthelf E. V., Jalota L., Mukai K., et al. 1994, ApJ 436, L91
Güdel M., Audard M., Magee H., et al. 2001, A&A 365, L344
Kron G. E. 1952, ApJ 115, 301
Ness J.-U., Mewe R., Schmitt J. H. M. M., et al. 2001, A&A 367, 282
Pallavicini R., Tagliaferri G., Pollock A. M. T., et al. 1990, A&A 227, 483
Reale F., Serio S., Peres G. 1993, A&A 272, 486
Reale F., Betta R., Peres G., et al. 1997, A&A 325, 782
Schmitt J. H. M. M., Güdel M., Predehl P. 1994, A&A 287, 843
Torres G. & Ribas, 2001, ApJ in press
Vaiana G. S., Cassinelli J. P., Fabbiano G., et al. 1981, ApJ 244, 163