Magnetic Fields in the Centaurus Cluster
Abstract
We present multi-frequency VLA observations of the radio galaxy PKS 1246-410 at the center of the Centaurus Cluster, and compare these results to recent Chandra observations. The unusual radio morphology of PKS 1246-410 probably results from interactions with the hot, X-ray emitting gas. This gas, along with cluster magnetic fields, also produces substantial Faraday Rotation Measures towards PKS 1246-410. We discuss these observations in the context of a sample of 14 luminous X-ray clusters with embedded radio galaxies and possible cooling flows. A correlation is found between the cooling flow rate and the maximum Faraday Rotation Measures. Magnetic fields of strength 10–40 G are found to be common to the centers of clusters with strong cooling flows, and somewhat lower field strengths of 2–10 G are found in the non cooling-flow clusters.
keywords:
galaxies: active – galaxies: nuclei – radio continuum: galaxies; galaxies individual – PKS 1246-4101 Introduction
Radio sources embedded within rich clusters of galaxies can serve as useful probes of the intracluster medium (ICM). The thermal ICM pressure may confine the radio source and polarized radiation from embedded radio sources may also be rotated by the Faraday effect if magnetic fields are present in the ICM.
The X-ray emission in many clusters is strongly peaked at the center, indicating high densities and cooling times of the hot ICM in the inner 100 kpc which are much less than the Hubble time. To maintain hydrostatic equilibrium, either another source of pressure or an inward flow is required (for a review see Fabian 1994). The cooling flow phenomenon in clusters is quite common with the short cooling time condition occurring in 70-90% of an X-ray flux-limited sample of clusters (Edge, Stewart & Fabian 1992; Peres et al 1998).
While most extragalactic radio sources exhibit Faraday rotation measures (RMs) on the order of 10s of rad m-2 due to the interstellar medium of our galaxy, there are a small number of sources displaying RMs in excess of 1000 rad m-2. Studies of these high RM sources (e.g. Cygnus A: Dreher, Carilli & Perley 1987; A1795: Ge & Owen 1993; Hydra A: Taylor & Perley 1993) indicate that these RMs are most likely to be induced by a cluster magnetic field. The high RM sources are typically surrounded by luminous, X-ray emitting gaseous halos, and in most cases a cooling flow (Taylor, Barton & Ge 1994). The diversity of the radio structures and powers, and the commonality of the X-ray parameters suggest that the high RMs are the result of external Faraday rotation occurring on large scales, and are not due to a local interaction between the radio source and its environment. For external Faraday rotation, the RMs are related to the density, , and magnetic field along the line-of-sight, , through the cluster according to
where is measured in Gauss, in cm-3 and d in kpc. The RM distribution, along with X-ray observations (used to estimate ), can then be used to understand the magnetic field structure along the line-of-sight (see review by Carilli & Taylor 2002).
Here we present VLA (Very Large Array)111The National Radio Astronomy Observatory is a facility of the National Science Foundation operated under a cooperative agreement by Associated Universities, Inc. observations of the heretofore little known radio galaxy PKS 1246-410 at the centre of the Centaurus cluster. This radio galaxy should not to be confused with the more famous radio galaxy Centaurus A. In §2 we describe the radio observations. In §3 we summarize the X-ray observations, and in §4 we present our analysis of both the radio and X-ray observations. In §5 we present our current knowledge of the sample of 14 clusters with embedded radio galaxies originally selected by Taylor et al. (1994).
We assume = 50 km s-1 Mpc-1 and = 1 throughout.
2 Radio Observations and Data Reduction
Observations of PKS 1246-410 were made at 1.465, 1.565, 4.635, 4.885, 8.115, and 8.485 GHz at the VLA. The details of the observations are provided in Table 1. The source 3C 286 was used as the primary flux density calibrator, and as an absolute reference for the electric vector polarization angle (EVPA). Phase calibration was derived from the nearby compact source J1316-3338 with a cycle time between calibrators of about 12 minutes. Instrumental calibration of the polarization leakage terms was obtained using OQ 208 which was observed over a wide range in parallactic angle. The data were reduced in AIPS (Astronomical Image Processing System), following the standard procedures. The AIPS task IMAGR was used with a suitable taper to make , and images at each of the 6 frequencies observed at the same resolution. Polarized intensity, , images and polarization angle, , images were derived from the and images. The Faraday Rotation Measure (RM) image was made from the combination of the 4 higher frequency images for PKS 1246-410. Pixels in the RM image were flagged when the error in any of the images exceeded 15 degrees. Stokes images using multiple frequencies within an observing band were also produced. In addition to the added sensitivity, the image produced also benefits from improved () coverage. No correction for the spectral dirty beam has been performed, but the sidelobes expected from this effect should be below the thermal noise floor.
3 X-ray Observations
Allen et al. (2001a; see also Ikebe et al. 1999) present ASCA observations of the Centaurus cluster. They find that the spectrum of the central 100 kpc can be well-described by either a two-temperature or cooling flow model with a mass deposition rate of 30–50 M⊙ yr-1.
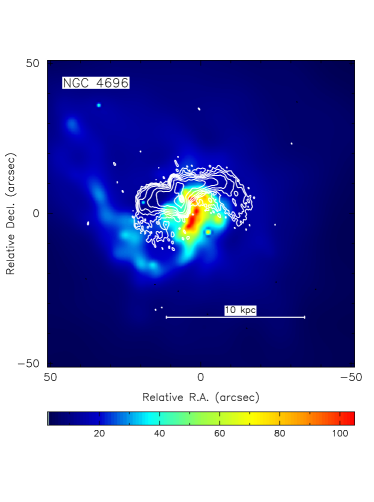
Sanders & Fabian (2001) present data from Chandra observations at much higher spatial resolution and report the discovery of a knotty, plume-like feature that begins 60″ (17 kpc) to the northeast of the nucleus, and curves to the south before terminating within 1″ (0.28 kpc) of the radio core (see §4.2). Sanders & Fabian find that this plume is 0.25 keV cooler than the surrounding thermal gas and report on the presence of a “cold front” in the Centaurus cluster where the temperature sharply increases near the end of the plume, to the north-east of the core. One way to produce such features is by suppression of thermal conduction by magnetic fields (see Carilli & Taylor 2002 and references therein).
The electron density profile for the central 70 kpc ( 4.2′) radius region, determined from a deprojection analysis, is shown in Fig. 1. The best-fitting model for the density has parameter values cm-3, , and a core radius, kpc. Note that the core size is similar to that of the radio source, which has made ‘holes’ in the X-ray emission at radii of 1–5 kpc.
4 Results
4.1 Radio Properties of PKS 1246-410
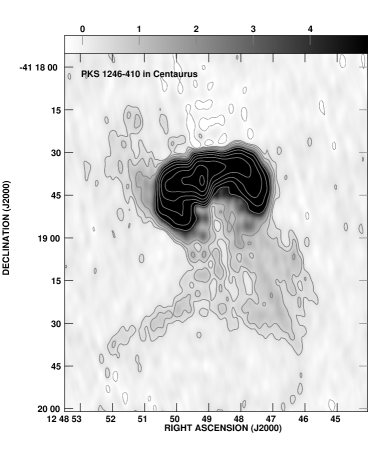
The radio source PKS 1246-410 is associated with NGC 4696, an elliptical galaxy at the center of the Centaurus cluster (also known as Abell 3526). The redshift is 0.0099, so 1″ corresponds to 0.28 kpc. The radio power of PKS 1246-410 is 1.5 W Hz-1 at 1.6 GHz, identifying it as a low power radio galaxy for which we would expect an FR 1 morphology (edge dimmed “woofly” radio tails). In fact the radio morphology at 1.6 GHz, shown in Fig. 2, appears quite different from most low power radio galaxies. The usual well defined core and thin jets feeding into larger lobes are missing. Instead there is a bright point source which we identify as the core based on its central location and slightly flatter spectral index of , where (Fig. 3). The position of the core and a summary of source properties is given in Table 2. The core is surrounded by “lobe” emission with a predominantly east-west orientation. At their extremes both lobes appear (at least in projection) bent to the south and back in towards the core, although there is also a weak extension to the northeast. The emission in the extremities is quite steep (). Overall the impression is of a rather distorted radio morphology, perhaps due to confinement by the hot X-ray emitting gas. Similar distortions have been seen for other radio galaxies embedded in dense X-ray environments with the most extreme case being the amorphous radio galaxy PKS 0745-191 (Taylor et al. 1994). The swept-back appearance of the outer parts of the lobes may be due to relative motion of the galaxy and ICM (see Sanders & Fabian 2001 for more discussion on this point).
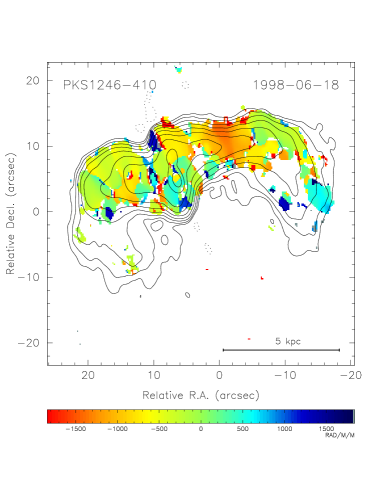
Fortunately, and unlike PKS 0745-191, the bright radio lobes of PKS 1246-410 are moderately well polarized (5 – 40%), so it is possible to derive the RM distribution across nearly the entire radio source. This has been done using four frequencies spread across the 4 and 6 cm bands, and is shown in Fig. 4. The RMs appear patchy and are not correlated with any features in total intensity. The RMs in PKS 1246-410 are typically in the range to rad m-2 and reach a maximum of 1800 rad m-2. A histogram of the RM distribution is shown in Fig. 5. After correcting for Faraday Rotation, the projected intrinsic magnetic field orientation of the synchrotron emission generally follows the edges of the source (Fig. 6). This is typical for extended radio sources.
4.2 X-ray/Radio Comparisons
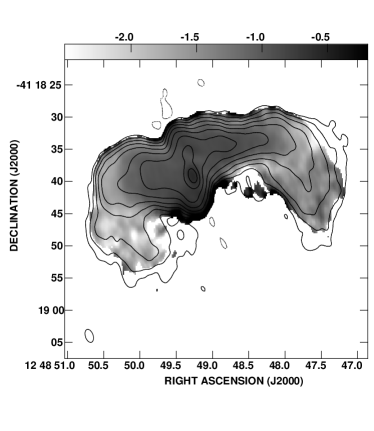
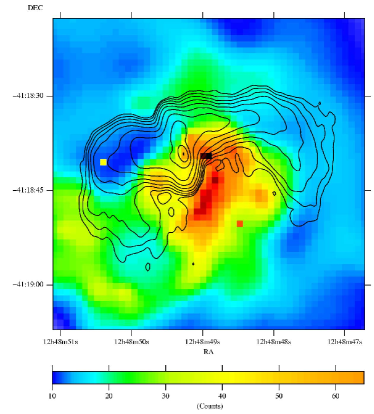
In Figs. 7 and 8 we show overlays of the X-ray and radio emission. This cluster shows a dramatic plume in the X-rays that reaches in to the cluster center and wraps around the radio galaxy. At the highest spatial resolution the radio emission seems to emerge from the core along a nearly N-S axis (Fig. 9). The rapid change to a more nearly E-W orientation of the radio emission is most likely the result of interactions with the thermal gas. Further from the nucleus at 3 kpc the radio lobes bend to the south. The eastern lobe appears to fill in the region bounded by the plume, while the western lobe also spills around it. In general the impression is that the radio source has been contained by the dense gas in the plume. Similar examples of radio emission filling X-ray cavities and avoiding overdensities have been found for 3C 84 at the center of the Perseus cluster (Bohringer et al. 1993, Fabian et al. 2000), in PKS 1508+059 in A2029 (Taylor et al. 1994) and in Hydra A in A780 (McNamara et al. 2000).
4.3 Magnetic Field Estimates
The gas density profile derived from ROSAT HRI observations can be parameterized with a -model fit as described in §3. This gives an electron density at radius 10 kpc of 0.04 cm-3. Considering the patch of 1500 rad m-2 located 3 kpc west of the core, the minimum constant magnetic field, , that could produce the observed RM over a path length of 10 kpc has a strength of 8 G. Several changes in sign are in evidence on both sides of the core, however, indicating that the magnetic field direction is rather chaotic. The simplest explanation for the RM distribution is a tangled magnetic field with a coherence length of 1 kpc. For a density distribution that follows a -profile, Felten (1996) has derived the following relation for the RM dispersion:
where , , and are derived in §3.2, is the cell size, is the distance of the radio source from the cluster center, is the Gamma function, and K is a factor which depends on the location of the radio source along the line-of-sight through the cluster: K = 624 if the source is beyond the cluster, and K = 441 if the source is halfway through the cluster. Note that Eq. 2 assumes that the magnetic field strength, , is related to the component along the line of sight, (), by . Given the clear interactions between the X-ray and radio plasma, we can assume that PKS 1246-410 is close to the true center of the cluster, and not fortuitously projected on the center. With the above measurements or assumed values, we use the estimated RM dispersion of 660 rad m-2 from Fig. 5 to estimate the cluster magnetic field strength at 11 G. In §5.2 we compare this value to those for a larger sample of clusters.
Fig. 8 shows how the X-ray emission varies across the radio lobes. It is interesting to compare it with Fig. 4 which shows the rotation measure map. The parts with positive RM (blue in Fig. 4) near the centre have the highest X-ray surface brightness, (brown in Fig. 8); the parts with negative RM (yellow/orange in Fig. 4) have a lower (green in Fig 8) and the parts with little RM (green in Fig. 4) have the lowest (blue in Fig. 8). There is thus tentative evidence that the regions of high have high and at least some of the excess X-ray emission lies in front of the radio source. Since and the X-ray surface brightness (the dependence on temperature is actually complicated by line emission so the proportionality is approximate), if the magnetic field , i.e. the magnetic pressure is in equipartition with (or a fixed fraction of) the thermal pressure, then , where is that part of which is in front of the radio source. Qualitatively this explains what is seen, but the detailed relationship must depend upon the field configuration, which must be complex.


| Source | Date | Frequency | Bandwidtha | Config. | Duration |
|---|---|---|---|---|---|
| (GHz) | (MHz) | (hours) | |||
| PKS 1246 | Apr1998 | 1465/1565 | 25 | A | 0.24 |
| -410 | Jun1998 | 1465/1565 | 25 | BnA | 0.99 |
| Apr1998 | 4635/4885 | 50 | A | 0.09 | |
| Jun1998 | 4635/4885 | 50 | BnA | 1.23 | |
| Nov1998 | 4635/4885 | 50 | CnB | 0.61 | |
| Jun1998 | 8115/8485 | 50 | BnA | 0.89 | |
| Nov1998 | 8115/8485 | 50 | CnB | 0.62 |
| Property | PKS 1246-410 |
|---|---|
| core RA (J2000) | 12h48m49s. 273 |
| core Dec. (J2000) | 18′39″. 11 |
| velocity | 2958 15 km s-1 |
| projected distance | 0 Mpc |
| angular size | 122″ |
| physical size | 34 kpc |
| flux density (5 GHz) | 1330 mJy |
| power (5 GHz) | 5.7 1023 W Hz-1 |
| RM | 356 rad m-2 |
| 662 rad m-2 | |
| RM | 1800 rad m-2 |
-
a
The mass flow rate for a critical cooling time of 1.3 1010 from Allen & Fabian (1997), White, Jones & Forman (1997) and Peres et al. (1998).
-
b
Galaxy type (E: elliptical; pec: peculiar, or cD: central dominant elliptical)
-
c
The largest angular size of the radio source in kpc.
-
References - (1) Dreher et al. 1987; (2) Owen et al. 1990; (3) This work; (4) Burns et al. 1992; (5) Taylor & Perley 1993; (6) Ge & Owen 1993; (7) Feretti et al. 1999; (8) Taylor, Barton, & Ge 1994; (9) Taylor, in prep.; (10) Taylor et al. 2001
5 A sample of radio sources embedded in clusters
5.1 Summary of results
Examination of a flux-limited, all-sky X-ray sample of galaxies put forth by Edge, Stewart, & Fabian (1992) reveals that clusters with non-zero mass flow rates frequently display significant RMs. Taylor, Barton & Ge (1994) formed a sample of 14 cooling flow clusters each containing at least one embedded radio galaxy stronger than 100 mJy at 5 GHz. All of these sources have now been extensively studied with the VLA, and in most cases considerably better X-ray observations are also available. Here we present an analysis of the combined results for this sample.
Of the 14 clusters in the sample, 10 display an excess of 800 rad m-2, two have RMs between 300 and 700 rad m-2 (one is A119 discussed by Feretti et al. 1999; and the other is the 3C 129 cluster), and two could not be measured (PKS0745-191 and the Perseus cluster) due to a lack of polarized flux. Nominal mass-flow rates, X-ray luminosities (from 2-10 keV), RMs, and other relevant parameters for these 14 clusters are listed in Table 3. Recent work has shown that the nominal X-ray mass flow rates, calculated under the assumption that the cooling flows extend out to the cooling radii in the clusters (where Gyr) are likely to overestimate the true mass deposition rates from the cooling flows by a factor of 3 or more. This is required by the fact that the cooling flows are much younger than 13 Gyr (Allen & Fabian 1997; Allen et al. 2001a) and, importantly, by the apparent lack of any gas cooling below 1–2 keV in spectra taken with XMM-Newton (Peterson et al 2001; Tamura et al 2001). For display purposes, we shall continue to use the nominal X-ray derived values here, simply as a characteristic measure of the amount of cooler gas in the cluster core. However, to signify that they are not complete mass cooling rates (although they compare well with the rate at which gas cools from the cluster virial temperature to about one third that value), we denote them as instead of .
The RM value given is chosen from the region of largest RM which is coherent across a beamwidth or more with good polarized signal-to-noise. We have also plotted in Fig. 10 the RM as a function of cooling rate, . These results strongly suggest a correlation between the cooling rate and rotation measure. Even more striking is the fact that all of the known high RM sources (RM 700 rad m-2; see Table 1 in Taylor, Inoue, & Tabara 1992) at low redshifts (z 0.4) are included in this X-ray selected sample. The high RM radio galaxy 3C 295 (Perley & Taylor 1991) at a redshift of 0.461 is also associated with a luminous X-ray cooling flow (Henry & Henriksen 1986; Allen et al. 2001b), but the pre-Chandra X-ray data for the remaining seven high RM, high , sources are not good enough to distinguish between extended thermal emission and that from an active nuclear source. Beyond redshifts of 0.4, low power radio sources like PKS 1508+059, and PKS 1246-410 are much too weak to allow for a determination of their RM with the current generation of radio telescopes.
5.2 Cluster Magnetic Field Strengths and Topologies
Our analysis of the RM dispersion in PKS 1246-410 leads to an estimated cluster magnetic field strength of 11 G in the Centaurus cluster. This is about a factor of two larger than the field strengths of 6 G estimated for the two non-cooling flow clusters in our sample (3C 129 and A119) by the same method. At the other end of the range, applying this method to Hydra A leads to an estimated field strength of 35 G.
The scale size of the RM fluctuations in Centaurus is quite small at 1 kpc. In cluster radio sources with both lower and higher RMs (e.g. A119, 3C129, Hydra A) typical scale lengths are 3 kpc.
The small physical size of PKS 1246-410 only allows us to probe the magnetic fields along the line-of-sight to the center of the cluster. Strictly speaking the region across which the RMs can be measured is only a projected distance of 10 kpc, so the RMs could be explained in terms of the host galaxy. However, in other clusters such as A119 (Feretti et al. 1999) and A514 (Govoni et al. 2001), RM studies have been performed towards several radio galaxies either in or behind the cluster and the magnetic fields have been found to prevail to large radii, 500 kpc. In a study of background radio sources seen through clusters, Clarke, Kronberg & Böhringer (2001) argue convincingly in favor of cluster-wide magnetic fields distributed throughout the central 1 Mpc.
6 Conclusions
The radio galaxy PKS 1246-410 appears to be strongly influenced by the dense X-ray emitting cluster gas that surrounds it, especially the plume discovered by Sanders & Fabian (2001). The radio – X-ray interaction produces an unusually steep spectrum, small source with bent lobes. Combined with a cluster magnetic field, the hot gas also produces Faraday RMs reaching 1800 rad m-2. With some assumptions about the field topology and distribution, a cluster magnetic field of 11 G is derived. This field strength is intermediate between that of clusters in which there is no cooling-flow present, and those estimated to have a large cooling-flow.
In the near future the Expanded VLA will provide an order of magnitude increase in sensitivity over the current VLA. This should allow RM studies towards more than a tenfold increase in the number of sources within a given cluster. By analyzing the RM distribution at many lines of sight through a cluster it should be possible to determine how the magnetic field changes with cluster radius and density.
7 Acknowledgments
This research has made use of the NASA/IPAC Extragalactic Database (NED) which is operated by the Jet Propulsion Laboratory, Caltech, under contract with NASA. ACF and SWA acknowledge the support of the Royal Society.
References
- [] Allen, S.W., & Fabian, A.C. 1997, MNRAS, 286, 583
- [] Allen, S.W., Fabian, A.C., Johnstone, R.M., Arnaud, K.A., Nulsen, P.E.J. 2001a, MNRAS, 322, 589
- [1] Allen S.W. et al. 2001b, MNRAS, 324, 842
- [] Böhringer, H., Voges, W., Fabian, A.C., Edge, A.C., & Neumann, D.M. 1993, MNRAS, 264, L25
- [] Burns, J.O., Sulkanen, M.E., Gisler, G.R., & Perley, R.A. 1992, ApJ, 388, L49
- [] Carilli, C.L., & Taylor, G.B. 2002, ARA&A, in prep.
- [] Clarke, T. E., Kronberg, P. P., & Böhringer, H. 2001, ApJ, 547, L111
- [] Dreher, J.W., Carilli, C.L., & Perley, R.A. 1987, ApJ, 316, 611
- [] Edge, A.C., Stewart, G.C., & Fabian, A.C. 1992, MNRAS, 258, 177
- [] Fabian, A.C. 1994, ARA&A, 32, 277
- [] Fabian, A.C., Sandars, J.S., Ettori, S., Taylor, G.B., Allen, S.W., Crawford, C.S., Iwasawa, K., Johnstone, R.M., & Ogle, P.M. 2000, MNRAS, 318, L65
- [] Felten, J.B. 1996, in “Clusters, Lensing and the Future of the Universe” eds. Trimble, V., & Reisenegger, A., ASP Conf. Series, Vol. 88, p. 271
- [] Feretti, L., Dallacasa, D., Govoni, F., Giovannini, G., Taylor, G.B.,& Klein, U. 1999, A&A, 344, 472
- [] Govoni, F, Taylor, G.B., Dallacasa, D., Feretti, L., & Giovannini, G. 2001, A&A, submitted
- [] Ge, J.-P., Owen, F.N. 1993, AJ, 105, 778
- [] Henry, J.P., & Henriksen, M.J. 1986, ApJ, 301, 689
- [2] Ikebe Y., Makishima K., Fukazawa Y., Tamura T., Xu H., Ohashi T., Matsushita K., 1999, ApJ, 525, 58
- [] McNamara, B.R., et al. 2000, ApJ, 534, 135
- [] Owen, F.N., Eilek, J.A., & Keel, W.C. 1990, ApJ, 362, 449
- [] Perley, R.A., & Taylor, G.B. 1991, AJ 101, 1623
- [] Peres, C.B., Fabian, A.C., Edge, A.C., Allen, S.W., Johnstone, R.M., & White, D.A. 1998, MNRAS, 298, 416
- [] Peterson J.R., et al, 2001, A&A, 365, L104
- [] Sanders, J.S., & Fabian, A.C. 2001, MNRAS, submitted
- [] Tamura T., et al, 2001, A&A, 365, L87
- [] Taylor, G.B., Inoue, M., & Tabara, H. 1992, A&A, 264, 421
- [] Taylor, G.B. & Perley, R.A. 1993, ApJ, 416, 554
- [] Taylor, G.B., Barton, E.J., & Ge, J.-P. 1994, AJ, 107, 1942.
- [] Taylor, G.B., Govoni F., Allen S.W., & Fabian A.C. 2001, MNRAS, 326, 2
- [] White, D.A., Jones, C., & Forman, W. 1997, MNRAS, 292, 419