Spatially-resolved X-ray spectroscopy of the core of the Centaurus cluster
Abstract
We present Chandra data from a 31.7 ks observation of the Centaurus cluster, using the ACIS-S detector. Images of the X-ray emission show a plume-like feature at the centre of the cluster, of extent 60 arcsec (20 kpc in projection). The feature has the same metallicity as gas at a similar radius, but is cooler. Using adaptive binning, we generate temperature, abundance and absorption maps of the cluster core. The radial abundance profile shows that the previously known, steep abundance gradient peaks with a metallicity of at a radius of about 45 arcsec (15 kpc), before falling back to at the centre of the cluster. A radial temperature profile shows that the temperature decreases inwards. We determine the spatial distributions of each of two temperature components, where applicable. The radiative cooling time of the cooler component within the inner 10 arcsec (3 kpc) is less than yr. X-ray holes in the image coincident with the radio lobes are seen, as well as two outer sharp temperature drops, or cold fronts. The origin of the plume is unclear. The existence of the strong abundance gradient is a strong constraint on extensive convection or gas motion driven by a central radio source.
keywords:
X-rays: galaxies — galaxies: clusters: individual: Centaurus — intergalactic medium — cooling flows1 Introduction
The Centaurus cluster, Abell 3526, at a redshift (Lucey, Currie & Dickens 1986) is a nearby, X-ray bright galaxy cluster. Analysis of ASCA, and earlier data (e.g. Allen et al. 2001) indicates it hosts a cooling flow (see Fabian 1994 for a review) of 30-50 , centred on the cD galaxy NGC 4696. Previous observations of Centaurus (e.g. Allen & Fabian 1994) show a system with smooth, elliptical, X-ray isophotes, indicating the system is relatively relaxed. However, there is evidence for a current or past merger event (Allen & Fabian 1994; Churazov et al. 1999; Furusho et al. 2001). The neighbouring subcluster, Cen 45, centred on NGC 4709, has a velocity which is 1500 higher than the main Centaurus cluster, also known as Cen 30 (Lucey, Currie & Dickens 1986).
Observations of the cluster using ROSAT and ASCA show that the central region of the cluster is rich in metals, with a large abundance gradient (Fukazawa et al. 1994; Ikebe et al. 1998; Allen et al. 2001).
2 The X-ray image
The data presented here are from a 31.7 ks observation of the Centaurus cluster by the Chandra Observatory, using the ACIS-S detector. The temperature of the focal plane was C at the time of the observation. No period in the observation was affected by flares, so no data were excluded from the analysis. The interaction of the radio source PKS 1246-410 with the X-ray plasma is discussed elsewhere (Taylor, Fabian & Allen 2001). All errors quoted are 1- uncertainties. Distances assume . Data were fitted using the xspec package (version 11.0.1; Arnaud 1996) and metallicities are relative to solar abundances defined by Anders & Grevesse (1989).
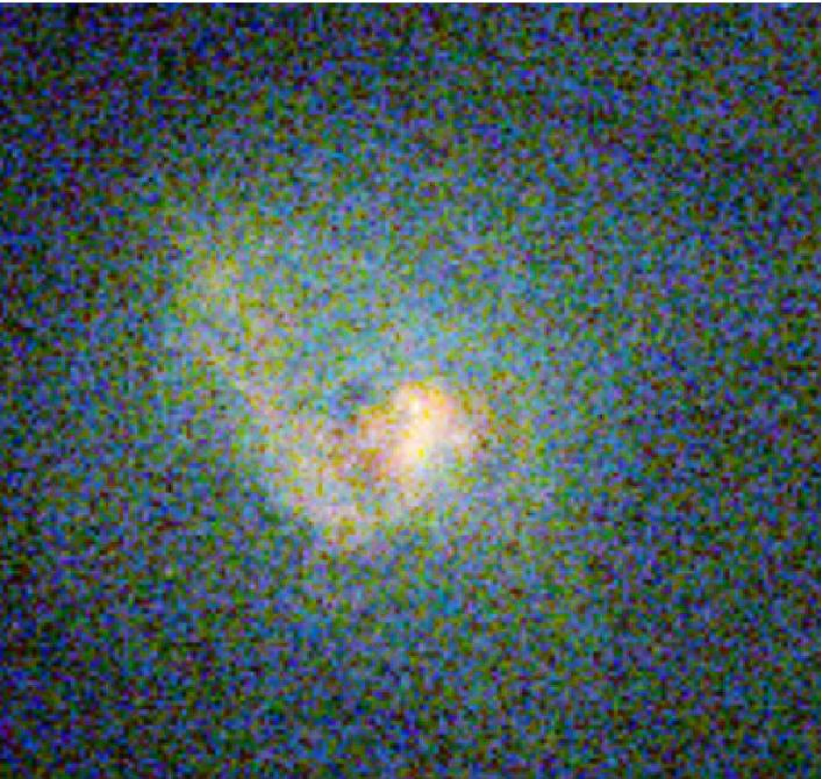
Fig. 1 shows a coloured raw ( arcsec pixels) image of the inner 140 arcsec of the S3 chip. Events are coloured according to the energy recorded (0.5-1 keV red, 1-2 keV green, 2-7 keV blue). The plume-like structure to the NE resembles a twisted sheet, and was seen in an observation of the cluster using the ROSAT HRI (Sparks, Jedrzejewski & Macchetto 1993).
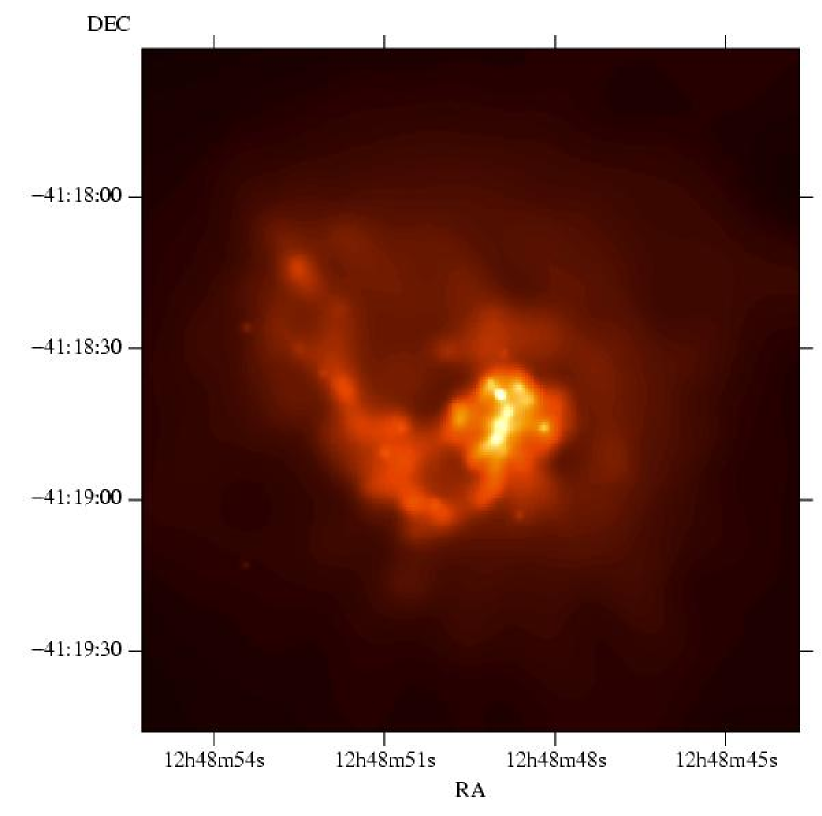
Fig. 2 shows an adaptively-smoothed (Ebeling, White & Rangarajan 2001) image of the raw data. It has been smoothed with a minimum significance of 3-. The image highlights that the emission is diminished from the north-east to the south-west close to the nucleus. It clearly shows the spiral plume-like feature, appearing to emerge from the nucleus in the south, and heading towards the north-east. The plume is approximately 60 arcsec long (20 kpc in projection). The energy-coloured image (Fig. 1) shows the centre of the cluster, and the plume, is cooler (redder) than the rest of the cluster. The two deficits or ‘holes’ in emission immediately to the NE and NW of the core are associated with the lobes of the radio source (Taylor et al. 2001). The continuation of the holes to the SE and SW is probably also related with the southern extension to the radio lobes.
Fabian et al. (2001b) hypothesise that the filament-like feature seen in X-ray emission in the core of the Abell 1795 cluster may be caused by the relative motion of the cD galaxy to the rest of the cluster (estimated to be at least 150 ). The results of Dickens, Currie & Lucey (1986) show that NGC 4696 lies close to the mean velocity of Cen 30. However, the radio maps of Taylor et al. (2001) show that the radio lobes bend to the south of the core. This indicates that NGC 4696 is moving north relative to the local intracluster medium. The aspect of the radio lobes could include a projection effect, with a velocity component along our line of sight of 100-200.
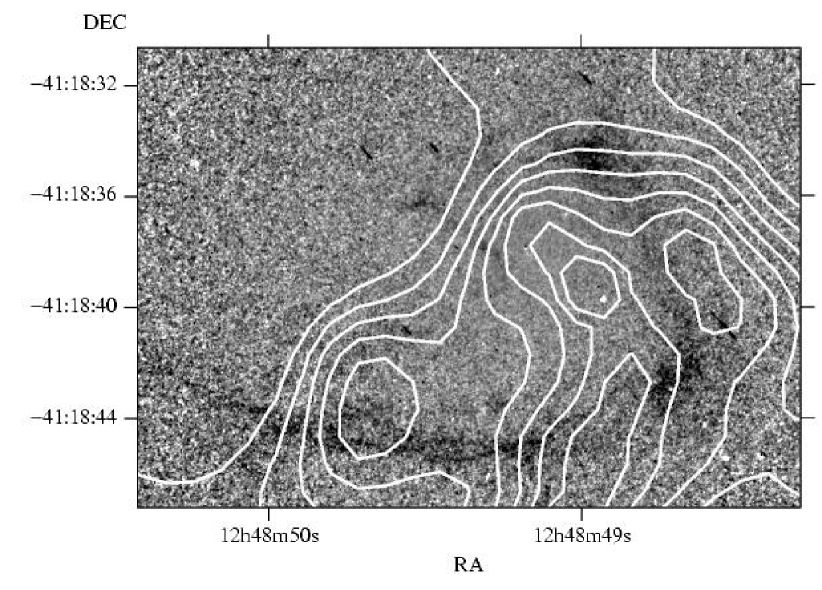
Observations of the core of the cluster at optical wavelengths show a dust-lane in NGC 4696 (Shobbrook 1963). It has been noted that the X-ray emission has a similar morphology to the dust lane (Sparks et al. 1993). Using four HST archived observations (datasets U3560101T, U3560102T, U62G8401R and U62G8402R) of the galaxy at 5407 Å and 7940 Å, we have made a ratio image of the optical emission in two bands highlighting the dust-lane. This is shown in Fig. 3, overlayed with a contour map of the centre of the adaptively smoothed image, Fig. 2. The swirling morphology of the dust-lane is similar to, but smaller than, the X-ray plume.
We find no evidence for hard X-ray emission (between 2-7 or 4-7 keV) from the core of the radio source PKS 1246-410 (position taken from Taylor et al. 2001) at the 2- level. Hard X-ray emission was seen in Centaurus using ASCA (Allen, Di Matteo & Fabian 2000), which has a hundredfold larger point-spread function than Chandra. There is tentative evidence for diffuse hard X-ray emission in the Chandra data which will be studied elsewhere.
3 Spectral fits
3.1 Spectrum of central 10 arcsec
We extracted a spectrum from the central 10 arcsec radius of the cluster. The spectrum was fitted with an absorbed single-temperature (1-T) mekal model (Mewe, Gronenschild & van den Oord 1985; Liedahl, Osterheld & Goldstein 1995), in the energy range of 0.5 to 7 keV, where the Chandra response-matrix is well calibrated. The spectrum was binned to ensure a minimum number of counts per spectral bin, chosen here to be 22 arbitrarily. We generated an effective response and ancillary matrix, averaged from the matrices applicable to each part of the region, but weighted according to the relative number of counts. The background was removed using a blank field background-spectrum of the same part of the detector, created using the prescription of Markevitch (2001). Although the background fields have lower galactic absorption () than the region observed (, obtained using the ftools nh program; Dickey & Lockman 1990) its level is insignificant compared with the bright cluster emission studied here.
The results of the fit are summarised in Table 1. We find a temperature of 0.71 keV, a metallicity of , absorbed by . The 1-T model poorly fits the spectrum (Reduced ).
In regions of cooling flow clusters where radiative cooling dominates, i.e. where the radiative cooling time is shorter than the age of the flow (about 3–5 Gyr; Allen & Fabian 1997, corresponding to about one arcmin radius in the Centaurus cluster), the X-ray surface brightness profiles indicated, if there is no balancing heat source, that the inferred mass deposition of cooled gas is roughly proportional to radius (). This requires that the gas there is multiphase (Nulsen 1986; Thomas, Fabian & Nulsen 1987). The spectrum of multiphase gas should be fit better with a two-temperature (2-T) model than a 1-T model (e.g. Allen et al. 2001). An even better model should be a cooling flow (CF: Johnstone et al. 1992), possibly with intrinsic absorption.
Studies of several cooling flow clusters using the XMM-Newton RGS (e.g. Peterson et al. 2001; Tamura et al. 2001) have shown that soft X-ray emission lines expected from gas cooling to low temperatures are absent in the data. A model (cooling flow to a minimum temperature, CFMT) which does fit the data, is a cooling flow in which gas cools from the upper temperature to a lower temperature, which may be one third to one fifth of the upper one. Such a model requires that the gas disappears once it reaches the minimum temperature, perhaps because of intrinsic absorption for which the absorbed CF model is an approximation, because of mixing or because of rapid heating which turns the cool phase into the hot one (see Fabian et al. 2001a).
In this paper we try all these models (1-T, 2-T, CF and CFMT) on the data. Previous work with ASCA has shown that more than one temperature component is required in the core of the Centaurus cluster (Fukazawa et al. 1994; Ikebe et al. 1998; Allen et al. 2001). Projection effects due to hotter outer gas being along the line of sight to cooler gas are also examined for the plume. We do not however carry out an exhaustive set of modelling due to the unknown 3-dimensional geometry of the cooler gas and the limitations of the models themselves, which do not include effects due for example to gravitational heating in a flow. Moreover, as we show, the metallicity of the gas is spatially complex, which further complicates detailed modelling. It is our intention here to identify the gross behaviour of the gas in terms of its temperature and abundance distributions with position.
We fitted the spectrum of the core with a 2-T mekal model, fixing the abundances of the two phases to be the same as there is not enough information in the spectrum to measure the abundances separately and accurately. The results of this fit are also shown in Table 1. The temperatures of the two phases are around 0.7 keV and 1.4 keV. The metallicity () is much larger than for the 1-T result (). The quality of the fit is considerably better than the 1-T model (Reduced ), but still not good. Allowing the two abundances to vary did not significantly improve the fit. The best-fitting metallicities were (cold-phase) and (hot-phase), but the temperatures were unaffected. Adding a third temperature to the 2-T model did not significantly improve the fit. However, adding a third component fixed at 4 keV to account for projected emission was an improvement. The radiative cooling time of the cooler component in the 2-T fit is about .
The fits can be improved further by switching from a mekal model to an apec model (Brickhouse et al. 2000). The reduced for an apec 2-T fit is 2.0. The residuals of the fit show there is some excess emission above 3 keV. This emission can be fit either using a power-law or a high-temperature plasma. We show in Table 1 the slight changes induced by adding a plasma of fixed temperature 4 keV and metallicity . Adding this component is justified as we expect contributing emission from the cluster in front of the core.
The spectrum can also be fitted (but with a poorer goodness-of-fit) using an intrinsically absorbed cooling flow model (rjcool; Johnstone et al. 1992), plus a plasma fixed at 4 keV and . We absorbed both components by a fixed galactic absorber, and allowed the intrinsic absorption of the cooling flow to vary. Normally we would add another plasma component to account for the local emission of the cluster near the cooling gas, and gravitational work done. However, at the centre of the cluster the cooling flow dominates, so no extra component was necessary.
We derive a cooling flow mass deposition rate of . The gas cools from a temperature of 1.1 keV and has a metallicity of . The cooling flow is intrinsically absorbed by . The spectrum, fitted with the cooling flow model, is shown in Fig. 4. The cooling flow model calculates its emission using mekal plasmas. We speculate that an apec version of the code would fit the spectra better, but unfortunately this code is still under development.
Using a CFMT model (Table 1) we find the mass deposition rate and upper temperature to be unchanged, a decrease in the intrinsic absorption of the cooling flow to a value similar to that found using 2-T fits, and a lower cooling temperature of 0.40 keV. The fit is better than a single cooling flow, but not as good as a 2-T model.
All the fits we have tried to the core spectrum show a large residual around 0.75 keV, independent of the model used (shown for the rjcool model in the lower panel of Fig. 4). mekal and apec models with varying elemental abundances do not improve the fit to this feature. The emission is well fitted with a -function. By examining the spectra of annuli, we have determined that this feature is not significant outside a radius of 10 arcsec (3 kpc) from the centre. It is also present in the inner 5 arcsec. The effective area of the telescope varies smoothly over the energy range of the emission, making the feature unlikely to be a calibration error.
There are also negative-residuals just above 2 keV. The effective area per unit energy of the telescope almost halves in the range 2 to 2.1 keV, so this feature may be a calibration issue. Accounting for these two spectral features would greatly improve the fit to the data, and would lead to a much smaller reduced .
We show in Fig. 5 the contributions towards for three different fits to the spectrum of the core. The feature at 0.75 keV, in all spectra, has been removed by fitting it with a Gaussian. We also included a plasma fixed a 4 keV and to model the projected cluster emission. The top panel shows a 2-T mekal model, the middle panel a 2-T apec model, and the lower panel an intrinsically absorbed rjcool model with fixed galactic absorption.
3.2 Spectrum of the plume
We extracted a spectrum from the plume-like region in the cluster. It, like the core, is poorly fit by a 1-T model. Using a 2-T model, the fitted temperature of the hot component is larger than the hot component in the core. The cooler component has a similar temperature. The abundance of this region is significantly higher than the core (an increase of ).
We also fitted the spectrum of an area at a similar radius to the plume (but not including the plume) with a 2-T model. The results are shown in Table 6 as ‘plume radius’. The plume appears to be keV cooler (in both fitted temperatures). There is no significant abundance difference. A cooling flow model (with a component to account for local cluster emission) gives a mass deposition rate of , with a high metallicity of .
Our next task was to test whether the multi-temperature nature of the plume is a projection effect. We compared the emission measure of the upper temperature component of a 2-T model fitted to the plume, with the emission measure of a 1-T fit to the spectrum in another region with the same size and radius as the plume, but at an angle of to it. The emission measure of the upper-temperature component of the plume was 70 percent greater than the emission measure of this comparison region. Therefore, the multi-temperature nature of the plume is not wholly a projection effect but is intrinsic to the plume.
By assuming a cylindrical geometry for the plume (20 kpc long, radius 2.3 kpc), and fitting a 1-T model to its spectrum, the emission measure implies an electron density of . The total gas mass of the plume is therefore . This mass is compatible with the hypothesis that this gas was stripped off an infalling galaxy. The mean cooling time of the gas in the plume is approximately yr, so the gas, or galaxy, must have a velocity of in order to not have cooled. The similarity of the abundance of the plume to the other gas at that radius raises a problem for the stripping hypothesis.
| Area | Counts | Model | (keV) | (keV) | () | Reduced | |
|---|---|---|---|---|---|---|---|
| or () | |||||||
| Central 10 arcsec | 17835 | phabs(mekal) | |||||
| phabs(apec) | |||||||
| phabs(mekal + mekal) | |||||||
| phabs(apec + apec) | |||||||
| phabs(apec+apec+[apec])∗ | |||||||
| phabs(zphabs(rjcool) + | |||||||
| [mekal])† | |||||||
| phabs(zphabs(rjcool | |||||||
| - rjcool) + [mekal])‡ | |||||||
| Plume | 14206 | phabs(mekal) | |||||
| phabs(apec) | |||||||
| phabs(mekal + mekal) | |||||||
| phabs(apec + apec) | |||||||
| phabs(mekal + [mekal] + | |||||||
| zphabs(rjcool))§ | |||||||
| phabs(mekal + [mekal] + | |||||||
| zphabs(rjcool-rjcool)) | |||||||
| Plume radius | 24694 | phabs(apec + apec) |


4 Imaging analysis
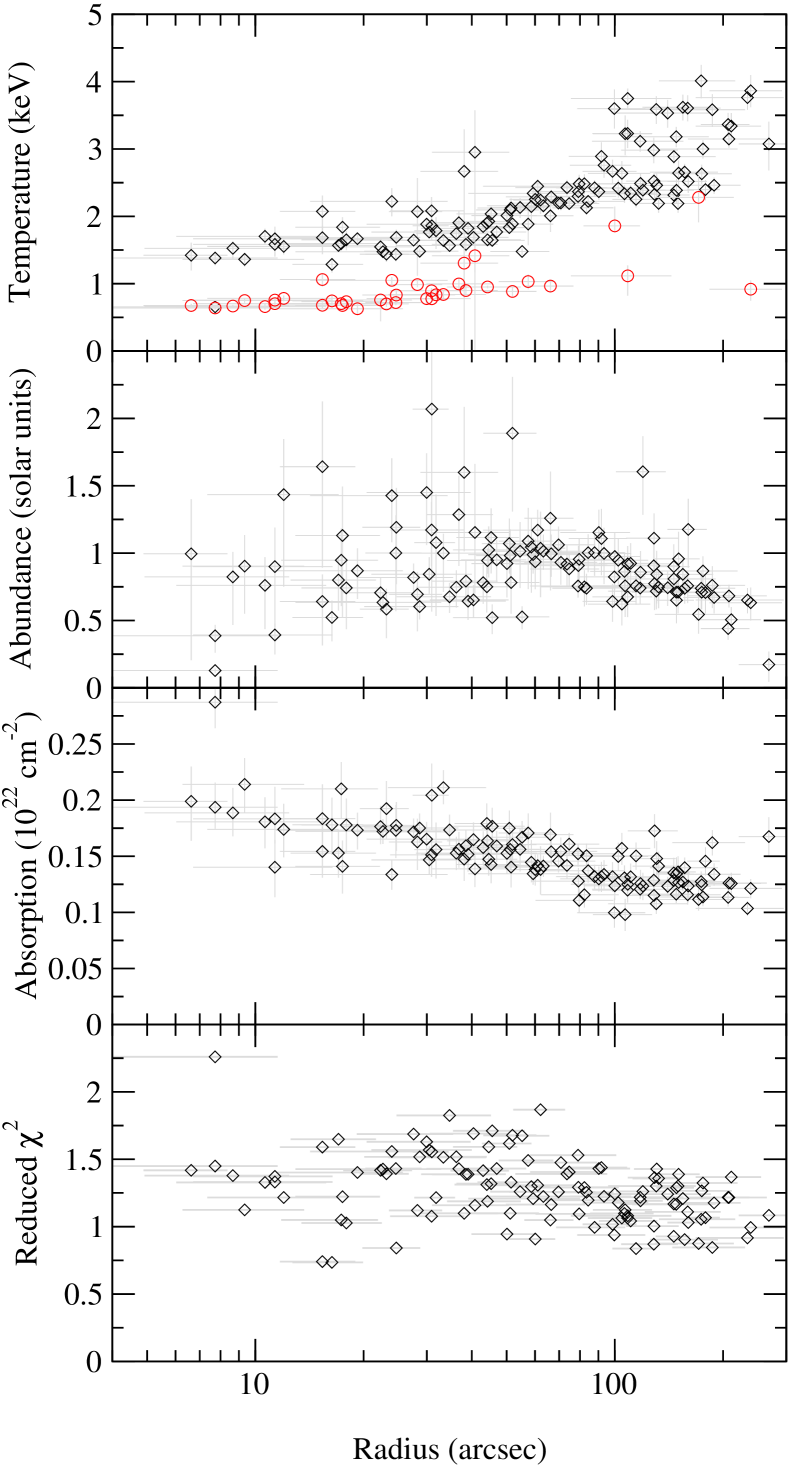
4.1 Radial profiles
In order to quantify the properties of the X-ray emitting gas as a function of radius, we analysed the spectra of circular annuli around the core of the cluster. This assumes that the properties of the gas are largely symmetric, an assumption we will test in §4.2 and §4.3. Spectra were extracted, and appropriate background spectra, response and ancillary matrices were created as in §3.1 for every annulus. We fitted each spectrum with 1-T and 2-T mekal models, leaving metallicity and absorption as free parameters. To identify whether a 2-T fit was substantially better than a 1-T fit for a particular annulus, we computed the -statistic. If the probability of the observed value of (or a larger value) was less than or equal to 0.01, we chose the 2-T fit for that annulus. The annuli were allowed to vary in width to ensure that there were 8000 counts in each spectrum (except for the outer annulus). Point sources were excluded from the analysis.
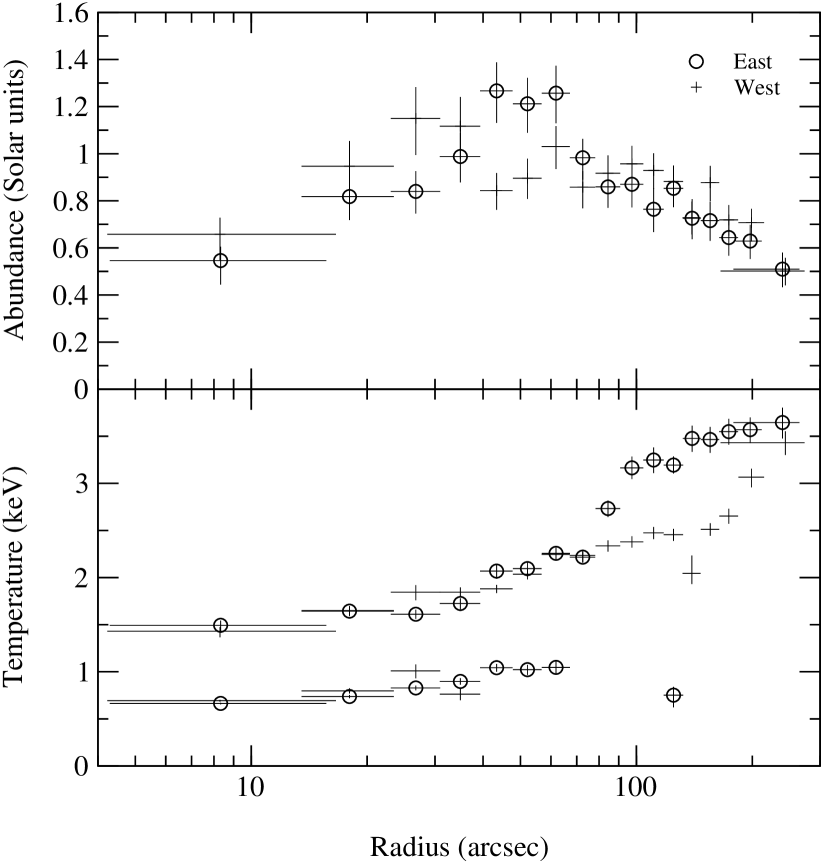
Fig. 7 shows the radial profiles of temperature, abundance, absorption and the reduced of the fits. The values of the reduced show the fits are relatively poor in the centre. Two temperature points are given at the radii where the -statistic gave reason to do so, showing the temperatures of the two temperature components. The vertical error bars show the 1- errors to the fit for each variable, whilst the horizontal error bars mark the maximum and minimum radii of each annulus.

The temperature in the outer regions of the cluster is keV. Towards the centre of the cluster, inside a radius of arcsec (17 kpc), a 2-T model is required to fit the spectra. The two temperatures drop to 1.35 and 0.66 keV at the centre (consistent with §3.1). The abundance rises from a value of in the outer regions, to a maximum of at a radius of arcsec (15 kpc). It then drops in the centre to . The intrinsic absorption rises from a value of in the outer regions, to at the centre. The lower-panel shows the temperature results of fitting with 2-T and 1-T apec models, rather than mekal models. The abundance and absorptions are very similar to the mekal results, so we do not plot them here.
Using models with variable abundances (vmekal and vapec), we find the relative abundances near the core are more similar to those found in Type Ia supernovae rather than in Type II supernovae (defined by ratios given in Dupke & Arnaud 2001), tieing together those elements which are produced by the same process in each type of supernova. An even better fit is found by allowing the abundances to be free: we find abundances (relative to solar), for an annulus 35 arcsec away from the core using vapec, of O=0.5, Mg=0.8, , Si=1.3, S=1.5, Ar=1.5, Ca=2.3, Fe=1.1, and Ni=1.8. vmekal gives different results: O=0.7, Mg=0.2, Ne=0, Si=1.8, S=2.3, Ar=2.4, Ca=3.4, Fe=2.1, and Ni=2.1. The level of Mg depends in detail on how the Fe l emission is modelled.
The volume filling fraction, , of the cooler component in the 2-T fits is given by
| (1) |
where the emission measures and temperatures of the cooler and hotter components are and , respectively. This assumes thermal pressure balance between the two components. The radial profile of (Fig. 7) shows that the cooler gas is detected when it exceeds about one per cent of the volume; it exceeds 10 per cent within the inner 10 arcsec.
We also fitted an absorbed cooling flow model to each annulus. We used an intrinsically absorbed cooling flow (rjcool) plus a mekal model, both absorbed by fixed galactic absorption. The temperature and metallicity of the plasma model were fixed to the upper temperature and abundance of the rjcool model. Fig. 8 (top) shows a plot of the cumulative mass deposition rate as a function of radius: the combined mass deposition rate of all the annuli inside a particular radius. The plot rises from a value of in the central 6 arcsec, to at large radii (300 arcsec; 100 kpc), in agreement with previous measurements for the mass deposition rate (Allen et al. 2001). Also shown in Fig. 8 are the intrinsic absorption of the cooling flow, its upper temperature, its metallicity, and the reduced of each fit.
As with the spectrum of the core of the cluster, we fitted each annulus with a CFMT model (the minimum temperature for each annulus rises from 0.4 keV at the centre to 1 keV at a radius of 1 arcmin). This model is only a significant improvement to the standard CF model inside a radius of around arcsec from the core.

We note that the level of absorption found is always higher than the expected galactic value. This may, in part, be an ACIS-S calibration issue. When fitting cooling flow spectra it may also characterize the lack of low temperature emission lines, such as are absent from XMM-Newton/RGS spectra of cooling flows. We do not have the spectral resolution or sensitivity to detect absorption edges which would demonstrate the presence of intrinsic absorption.
4.2 East-west anisotropy
The east side of the cluster contains the plume-like feature. To investigate whether there is significant difference between the east and west sides of the cluster, we analysed annuli cut in a north-south direction. Fig. 9 shows the two temperature and abundance profiles for the cluster. The annuli were chosen to contain 20000 counts between 0.5 and 7 keV, and then were split into east and west parts. 1-T and 2-T mekal models were fitted using the same procedure as in §4.1, and an -test was used to decide whether the 2-T model was a significant improvement over the 1-T model.
The plot shows significant differences in abundance between the two sides at radii of –50 arcsec. There are also sharp outward rises in temperature in the east and west, at radii of and 160 arcsec, respectively. We will discuss these further in the next section. Between these radii, there are temperature differences between the two halves of the cluster. These radii match the region in mekal and apec radial plots where two temperature components are often preferred (Fig. 7). The anisotropy shows that more detailed analysis is required to map out the structure of the cluster.
4.3 Fits to adaptively binned areas
We adaptively binned (Sanders & Fabian 2001) the central 3 arcmin of the cluster, using a fractional error threshold of 0.03. Adaptive binning uses a bin size which changes to ensure a minimum number of counts in each bin. A threshold of 0.03 gives 1100 counts per bin (except in certain cases). Fig. 10(a) shows the adaptively binned image of the cluster. Point-sources were excluded from the analysis and are marked as white areas. The core of the cluster is shown to the south-east of the centre of the image.
We extracted spectra from each bin, and generated appropriate background spectra, response and ancillary matrices, as in §3.1. We then fitted each bin with 1-T and 2-T mekal models, finally using an -test to decide whether the 2-T fit was a significant improvement over the 1-T fit. The results for the two types of fit were then combined to create images showing the spatial distribution for each fitted parameter. Fig. 10(b) shows either the fitted temperature from the 1-T fit, or the upper temperature of the 2-T fit. Fig. 10(c) shows the lower temperature of the 2-T fit, where appropriate. Figs. 10(d) and (e) show the fitted abundance and absorption levels from the relevant fit. Fig. 10(f) shows the appropriate reduced value.
The value of a parameter in the images is indicated by a colour scale. Subtracted point sources are marked by the maximum value. We plot the 1- errors to the fit as a pair of diagonal boxes in the centre of each bin. The top-right box shows the upper bound, and the bottom-left shows the lower bound. Masked-out point sources are shown as areas coloured with the maximum value.
2-T models are required to fit the spectra in the inner 30 arcsec. The 2-T temperature results in the centre ( and 1.2 keV) are cooler than the 1-T results in the outer regions (). The abundance of the gas in the outer regions has a similar value to that in the core (), but there is a rise in the metallicity about 1 arcmin away from the core to , as in §4.1.
The images show the properties of the emitting gas are not spherically symmetric. The temperature sharply increases at between 70 and 160 arcsec radius, depending on position angle (Fig. 9). Such features have been seen in other clusters, and are termed cold fronts (Markevitch et al. 2000). The most striking front is to the north-east of the core in the Centaurus cluster, where the emission suddenly drops. There is an extensive cooler region to the west of the core (; Fig. 10(b)). This area has a higher abundance than an equivalent region to the east (Fig. 10(d)). In addition, there is more absorption (Fig. 10(e)) to the west.
In the innermost core of the cluster (at a radius of less than 4 arcsec) there are a few bins for which a 1-T fit is preferred using an -test (probabilities for of ). Owing to this, they have much lower abundances than the surrounding bins. If their spectra are combined, a 2-T fit is easily preferred, and the results of the fit closely match the values of the surrounding bins. This is likely to be due to the difficulties of detecting two low ( keV) temperatures close together. More counts at that temperature appear to be required to detect two temperatures.
| (a) | 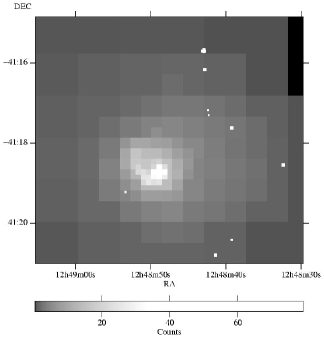 |
(b) | 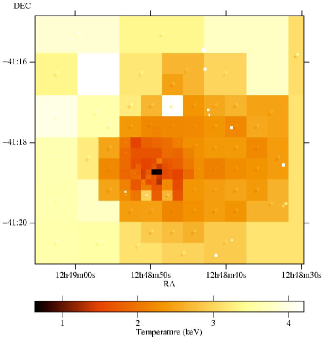 |
| (c) | 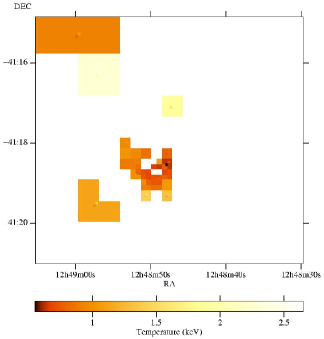 |
(d) | 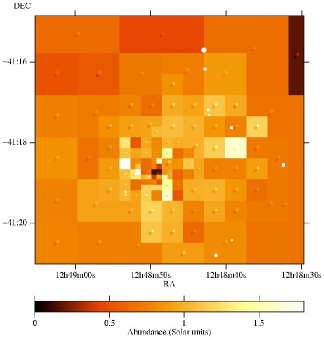 |
| (e) | 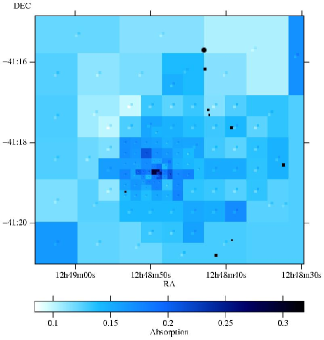 |
(f) | 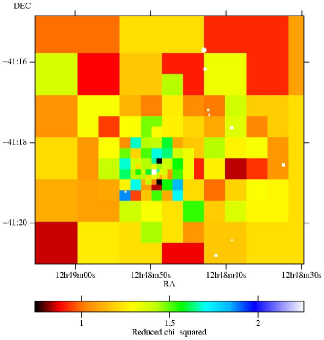 |
In order to examine whether there is significant non-radial variation in the bins, the fitted parameters (with 1- errors) to each bin as a function of the radius of the bin are plotted in Fig. 12. The radius plotted is the mean radius of the pixels of the bin. The plot brings out the features in Fig. 7. There is some significant variation in metallicity between radii of 7–50 arcsec. Examining those bins in the east and those to the west, we find that most of the variation in the abundance is to the west (the opposite side to the plume). The metallicity to the west is scattered between 0.5 and 1.7 at radii of 7–50 arcsec. The profile to the east is much smoother, except for an obvious high abundance point (Fig. 10(d), roughly 7 arcsec from the core). The east-west difference in metallicity and temperature is highlighted by Fig. 9, which shows east-side and west-side profiles of the cluster.
Given that the cluster contains a strong radio source (Taylor et al. 2001) there may be significant non-thermal emission in the X-ray band. Any non-thermal emission will increase the continuum of the X-ray emission and lower the apparent metallicity. We tested for the presence of non-thermal emission by fitting the spectrum in each bin with a 1-T plus power-law model. We then used an -test to decide whether adding the power-law component made a significant improvement to the fit (using the same criterion as §4.1) for each bin.
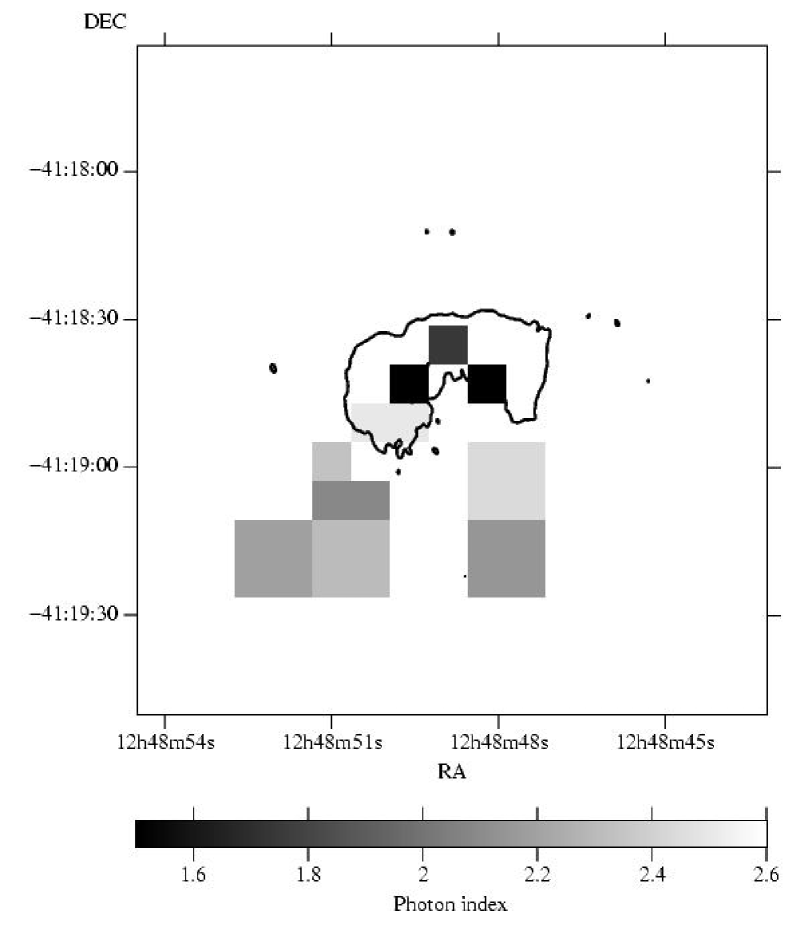
We show in Fig. 13 the areas where the power-law component is suggested by the -test. Interestingly the morphology of the radio source approximately matches those areas in the centre where the power-law component is a significant improvement. We also find that those areas 1 arcmin south of the core where the power-law is preferred match the low-intensity regions of the radio source (see Taylor et al. 2001 for detailed maps of the radio source morphology). However, only a small fraction of the emission from the core of the cluster appears to have a significant non-thermal component, and the peak in the abundance still exists if we exclude those regions where it may be important. Therefore the peak in abundance 15 kpc from the core is not an effect of non-thermal emission.
5 Discussion
The most interesting conclusion of our analysis is that the metallicity of the cluster peaks at (or with a cooling flow model) at a radius of kpc, declining to at the centre. Previous observations (Fukazawa et al. 1994; Ikebe et al. 1998) of the cluster did not have high enough spatial resolution to resolve this feature, showing only an increasing gradient in metallicity to the centre. Böhringer et al. (2001) found using XMM-Newton data that the abundances in the Virgo Cluster peak arcmin from the centre. Molendi & Gastaldello (2001) later saw this to be an effect of using a 1-T fit where more temperature components were required; within 1 arcmin from the centre the actual metal profile is flat.
The abundance gradient in Centaurus was modelled by Reisenegger, Miralda-Escudé & Waxman (1996), but no decrease was expected. We still get a peak in abundance just fitting spectra between 3 and 7 keV where Fe k emission occurs (Fig. 14), so the peak is not an artefact of the Fe l complex. Resonant absorption is a possible mechanism for the metallicity decline in the core of the cluster. However, since we see the abundance peak in the Fe k lines too, resonant absorption is unlikely.

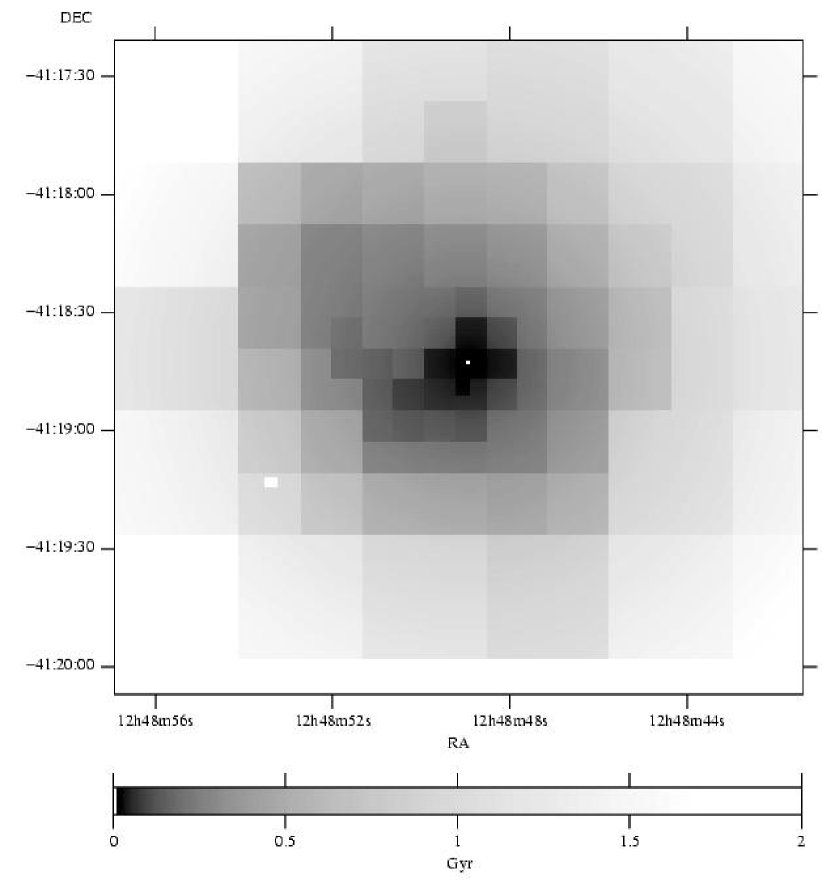
In the future, it will be important to study the chemical composition of the plasma, and handle projection effects fully. We also would like to understand why the statistical quality of the fits in to the spectra in the centre are poor, and how to improve them. These effects are probably due to the high metallicity of the core: a feature which is particular to this cluster. We would like to draw attention to the fact that there are differences in the qualities of fits using different plasma codes. The fits to the adaptively-binned image spectra (Fig. 10(c)) suggest that the 2-T fits are required in specific regions, rather than at specific radii.
Using a CF model produces a radial abundance profile with a similar shape, but with a higher peak metallicity, than that found using the 2-T model, indicating that the peak is not a model-dependent effect. The upper-temperature of the CF fit also matches the upper-temperature of the 2-T fit. In general, excluding the very central bins, the CF model gives a smaller reduced than the 2-T model.
It is difficult to conclude in general which model gives the better fits to the regions of the cluster. When the data are binned in annuli, a standard cooling flow model (CF) is a significant improvement (measured using an -test with a maximum probability of 0.01) over a 1-T fit for nearly every annulus. 2-T and CFMT models are only a significant improvement over a 1-T model within about 60 arcsec of the cluster core. A 2-T model or CFMT model are a significant improvement to the CF model within the inner arcsec. A CF model probably fits the spectra of the annuli better as the cluster is not radially symmetric, so there are a number of temperatures at each radius, which the CF model includes.
The comparison gives different conclusions when fitting the regions in the adaptively binned image. A 2-T, CF or a CFMT model is a significant improvement (with the same -test criterion) over the 1-T model inside much of the inner 40-50 arcsec. The area in the central arcmin for which the CF model is an improvement over the 1-T model is roughly that for which the CFMT and 2-T models are an improvement. The CFMT and 2-T models show a significant improvement in the fit over the CF model for areas about 50 arcsec away for the nucleus, and some of the area inside. Fig. 11 shows that the radiative cooling time of the gas is less than a Gyr within those radii. Outside the core, there are some areas which show a significant improvement using a CF, 2-T or CFMT model over a 1-T model. It may be that there are local variations in temperature in these regions, or this could be a statistical effect. Using a larger bin size, with the corresponding increase in counts in the spectra, still results in areas outside the core which show a significant improvement using a 2-T or CFMT model over a 1-T model, although using a larger bin size includes more gas, which is probably at different temperatures. Note that if there is a cooling flow, then the models used here do not incorporate the gravitational work done on the gas in the flow. Therefore no firm statement can be made on the level of the mass deposition rate. The data support a rate of several tens .
It is difficult to speculate on the cause of the plume-like feature in the core of the cluster. The galaxy velocity data cannot rule out a 100-200 line of sight motion of NGC 4696 in Cen 30 similar to that of the cD in A1795 (Fabian et al. 2001b). The real velocity could of course be larger and there may be significant motion of the intracluster gas within its potential well. The plume does, however, touch the east-most extent of the radio lobes (Taylor et al. 2001), indicating there may be some interaction between the lobes and the plume. However, the direction of the plume is not aligned with the radio lobes. The plume has a higher metallicity than the core, suggesting the cooling flow is depositing enriched material in this area.
Sparks, Macchetto & Golombek (1989) and de Jong et al. (1990) have proposed that the cooler central gas around NGC 4696 originates from an infallen dust-rich dwarf galaxy, which also accounts for the dust lane. The fact that the metallicity of the plume matches its surroundings argues against this stripping hypothesis (as mentioned in §3.2). Moreover, cool gas is found in the majority of clusters.
As in M87, the plume could be due to a radio bubble dragging out cooler gas (Böhringer et al. 1995; Churazov et al. 2001). The ‘cold front’ at the end of the plume could in fact be the edge of the bubble. However, we have shown that the metallicity of the plume is similar to the surrounding material, and higher than the central gas, which argues against that gas having originated close to the central radio source. Of course, the drop in metallicity within the inner 20 kpc (60 arcsec) could be due to bubbles transporting higher metallicity gas to larger radii (Churazov et al. 2001; Brüggen & Kaiser 2001). However, it is not then clear where the present lower-abundance gas has come from. More detailed models of the convection and exchange of gas are required, but at first inspection, such models are unlikely to reproduce the abundance profile seen here.
Our main conclusion is that the steep abundance gradient in this cluster does not persist within 15 kpc, but decreases inward to a value similar to that seen at large radii. This may be a feature of radiative cooling of the gas, if composed of small metal-rich clumps in a metal-poor surrounding environment (Morris & Fabian, in preparation). The presence of an abundance gradient means that there has not been significant widespread convection or mixing extending beyond 15 kpc driven by the nucleus of NGC 4696. The spectra within kpc also indicate that the temperature structure of the gas has at least two phases, both decreasing towards the centre. The present data are not capable of testing for the presence of further phases.
Acknowledgements
We thank the referee, Silvano Molendi, for helpful comments. ACF and JSS would like to thank the Royal Society and PPARC for support, respectively.
References
- [1] Allen S.W., Fabian A.C., 1994, MNRAS, 269, 409
- [2] Allen S.W., Fabian A.C., 1997, MNRAS, 286, 583
- [3] Allen S.W., Di Matteo T., Fabian A.C., 1999, MNRAS, 311, 493
- [4] Allen S.W., Fabian A.C., Johnstone R.M., Arnaud K.A., Nulsen P.E.J., 2001, MNRAS, 322, 589
- [5] Anders E., Grevesse N., 1989, Geochimica et Cosmochimica Acta, 53, 197
- [6] Arnaud K.A., 1996, in Jacoby G., Barnes J., eds, ASP Conf. Ser. Vol. 101, Astronomical Data Analysis Software and Systems V. Astron. Soc. Pac., San Francisco, p. 17
- [7] Böhringer H., Nulsen P.E.J., Braun R., Fabian A.C., 1995, MNRAS, 274, L67
- [8] Böhringer H. et al., 2001, A&A, 365, L181
- [9] Brickhouse N.S., Smith R.K., Raymond J.C., Liedahl D.A., 2000, AAS HEAD meeting 32, 27.01
- [10] Brüggen M., Kaiser C.R., 2001, MNRAS, 325, 676
- [11] Churazov E., Gilfanov M., Forman W., Jones C., 1999, ApJ, 520, 105
- [12] Churazov E., Brüggen M., Kaiser C.R., Böhringer H., Forman W., 2001, ApJ, 554, 261
- [13] De Jong T., Norgaard-Nielsen H.U., Jorgensen H.E., Hansen L., 1990, A&A, 232, 317
- [14] Dickens R.J., Currie M.J., Lucey J.R., 1986, MNRAS, 220, 679
- [15] Dickey, J.M., Lockman F.J., 1990, ARA&A, 28, 215
- [16] Dupke R.A., Arnaud K.A., 2001, ApJ, 548, 141
- [17] Ebeling H., White D.A., Rangarajan F.V.N., 2001, MNRAS, in press
- [18] Fabian A.C., 1994, A&AR, 32, 277
- [19] Fabian A.C., Mushotzky R.F., Nulsen P.E.J., Peterson J.R., 2001a, MNRAS, 321, L20
- [20] Fabian A.C. et al., 2000, MNRAS, 318, L65
- [21] Fabian A.C. et al., 2001b, MNRAS, 321, L33
- [22] Fukazawa Y., Ohashi T., Fabian A.C., Canizares C.R., Ikebe Y., Makishima K., Mushotzky R.F., Yamashita K., 1994, PASJ, 46, L55
- [23] Furusho T., et al., 2001, PASJ, 53, 421
- [24] Ikebe Y., Makishima K., Fukazawa Y., Tamura T., Xu H., Ohashi T., Matsushita K., 1999, ApJ, 525, 58
- [25] Johnstone R.M., Fabian A.C., Edge A.C., Thomas P.A., 1992, MNRAS, 255, 431
- [26] Liedahl D.A., Osterheld A.L., Goldstein W.H., 1995, ApJ, 438, L115
- [27] Lucey J.R., Currie M.J, Dickens R.J., 1986, MNRAS, 221, 453
- [28] Markevitch M. et al., 2000, ApJ, 541, 542
- [29] Markevitch M., 2001, http://hea-www.harvard.edu/~maxim/axaf/acisbg/
- [30] Mewe R., Gronenschild E.H.B.M., van den Oord G.H.J., 1985, A&AS, 62, 197
- [31] Molendi S., Gastadello F., 2001, A&A, 375, L14
- [32] Nulsen P.E.J., 1986, MNRAS, 221, 377
- [33] Peterson J.R. et al., 2001, A&A, 365, L104
- [34] Reisenegger A., Miralda-Escudé J., Waxman E., 1996, ApJ, 457, L11
- [35] Sanders J.S., Fabian A.C., 2001, MNRAS, 325, 178
- [36] Shobbrook R.R., 1963, The Observatory, 83, 36
- [37] Sparks W.B., Macchetto F., Golombek D., 1989, ApJ, 345, 153
- [38] Sparks W.B., Jedrzejewski R.I., Macchetto F., 1993, in Schlegel E.M., Petre R., eds, AIP Conf. Proc. 313, The Soft X-ray Cosmos. AIP, Woodbury, p. 389
- [39] Taylor G.B., Fabian A.C., Allen S.W., 2001, submitted to MNRAS
- [40] Tamura T. et al., 2001, A&A, 365, L87
- [41] Thomas P.A., Fabian A.C., Nulsen P.E.J., 1987, MNRAS, 228, 973