Cross–matching DENIS and 2MASS Point Sources towards the Magellanic Clouds
Abstract
The recent publications of the DENIS Catalogue towards the Magellanic Clouds (MCs) with more than 1.3 million sources identified in at least two of the three DENIS filters (I J ) and of the incremental releases of the 2MASS point source catalogues (J H ) covering the same region of the sky, provide an unprecedented wealth of data related to stellar populations in the MCs. In order to build a reference catalogue of stars towards the Magellanic Clouds, we have performed a cross–identification of these two catalogues. This implied developing new tools for cross–identification and data mining. This study is partly supported by the Astrovirtel program that aims at improving access to astronomical archives as virtual telescopes. The main goal of the present study is to validate new cross–matching procedures for very large catalogues, and to derive results concerning the astrometric and photometric accuracy of these catalogues. The cross–matching of large surveys is an essential tool to improve our understanding of their specific contents. This approach can be considered as a new step towards a Virtual Observatory.
Keywords: cross–identification, data mining, virtual observatory
1 INTRODUCTION
The Magellanic Clouds (MCs) have been recently fully observed by two major infrared surveys : the Deep Near Infrared Survey of the Southern Sky - DENIS[1] and the Two Micron All Sky Survey - 2MASS[2]. A Near Infrared Point Source Catalogue towards the Magellanic Clouds, based on DENIS data, has been published (hereafter DCMC[3]). The catalogue covers an area of degrees centered on the Large Magellanic Cloud (LMC), and an area of degrees for the Small Magellanic Cloud (SMC). To compute this catalogue, the objects were required to be detected in at least two of the three DENIS bands , , . The 2MASS observed the whole Magellanic Clouds in three photometric bands : , and . Most of the data are available from the Second Incremental Release PSC[4], except for small gaps in regions crossing the LMC and SMC bars and around bright stars (Fig. 1).
| LMC–DCMC | LMC–2MASS |
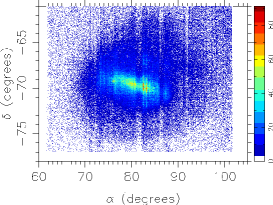 |
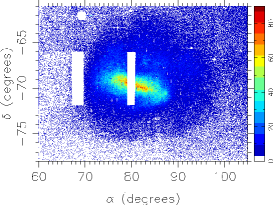 |
| SMC–DCMC | SMC–2MASS |
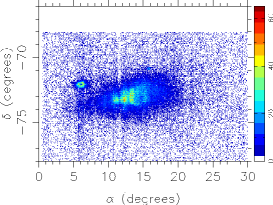 |
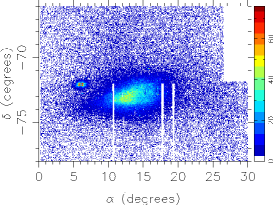 |
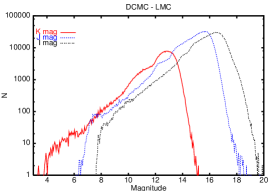
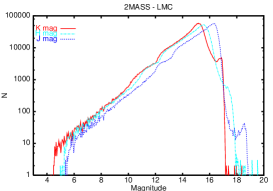
The Magellanic Clouds are one of the best places to study stellar evolution because of their proximity and common distance of their constituent objects. Near infrared surveys provide interesting data for this kind of study because of their insensitivity to dust reddening. The number of sources from both surveys are recorded in Table 1. Because of different sensitivity limits, DENIS sources detected only in the I and J bands are often detected in H and by 2MASS. The 2MASS observations reach almost one magnitude fainter than DENIS in the channel, while they are roughly equivalent in the J channel (Fig. 2). So it would be interesting to cross–match the two catalogues to complete the spectral range of the DCMC IJ–sources with the H and bands coming from 2MASS. Thus, cross–identification of the DCMC and 2MASS catalogues will provide an unprecedented basis for study of stellar populations in the Magellanic Clouds and for further cross–identifications with catalogues at other wavelengths. Furthermore the Clouds are a good place to develop and test cross–matching procedures for dense and large regions of the sky.
This work, partly supported by the Astrovirtel[5] program, aims at performing a systematic cross–matching of the DCMC with 2MASS, and a series of validation tests that will enable us to understand better the specific contents of each catalogue.
| LMC | |||
|---|---|---|---|
| DCMC | 2MASS | ||
| IJ | 297031 | JH | 1996382 |
| IJ | 1151789 | J | 66 |
| I | 8724 | JH | - |
| J | 1897 | H | 4 |
| J | 11 | ||
| H | - | ||
| 23 | |||
| None | 259 | ||
| Total | 1459441 | Total | 1996745 |
| SMC | |||
|---|---|---|---|
| DCMC | 2MASS | ||
| IJ | 75133 | JH | 481549 |
| IJ | 257925 | J | 15 |
| I | 2206 | JH | 1 |
| J | 710 | H | 4 |
| J | 4 | ||
| H | - | ||
| 9 | |||
| None | 69 | ||
| Total | 335974 | Total | 481651 |
|
2 DATA ORGANIZATION
The present work is based on public data from 2MASS, as given in Sect. 1. DCMC data have been obtained from a local copy of the catalogue that includes the missing strips of the first release (the second release is currently under process). Before running the cross–matching programs, we organized the raw data, splitting both catalogues into smaller pieces. The DENIS observational strategy has been to divide the sky in strips of in Declination (DEC) and in Right Ascension (RA). To define subsamples, we adopted a strip by strip strategy because :
-
•
Our cross–matching algorithm is well adapted to data files with small extension in RA (alpha) and a strip is only large in RA.
-
•
The cross–matching criteria depend on the strip number as explained below (see Sect. 4).
First we split the DCMC catalogue by strip number. There are 119 strip–files for the LMC and 88 strip–files for the SMC. Then for each strip–file, we extracted from the 2MASS data all the point sources overlapping the same region of the sky.
The cross–matching program is run for each strip. Each time we have two input files, one from DCMC, one from 2MASS, corresponding to a given strip number. Both files have been previously sorted by ascending declination, in order to optimize the cross–comparison procedure. The procedure can be described as follows : both files are read sequentially in parallel ; for each record of the first file (say, DCMC) we search for all possible cross–matches in the second file (here 2MASS). For that, we read the second file and keep in memory a buffer of possible candidates, making sure that the highest value of the declination in file 2 is actually higher than + of the current record of file 1, and the same thing for the lowest value of the buffer of file 2, which has to be lower than - . Possible cross–matches are kept, together with the corresponding differences in positions and magnitudes. In a first run, we keep the smallest difference in position as the most probable, using a box of , = .
3 FIRST CROSS–MATCHING STEP : FINDING DISCREPANCIES IN THE ORIGINAL CATALOGUES
The easiest way to find matches between two catalogues is to fix a searching box in position of a few arcseconds and compare the coordinates. It will work really well in most cases because the astrometry of the two DCMC and 2MASS catalogues is accurate enough (better than one arcsecond). Furthermore both catalogues were calibrated upon the USNO-A2.0 catalogue[6]. Consequently the distance match is better than for the great majority of stars. There is in principle no risk of confusion at such a small scale. While this is true in general, in practice the cross–matching exercice has proven to be a powerful tool to detect subsets of the data files which deviate from the perfect situation, and primarily areas suffering from problems in the astrometric or photometric calibration. Here is what we did to find out these regions :
-
•
We split each catalogue into big chunks : width in RA for the LMC and width in RA for the SMC.
-
•
We ran a cross–matching program based on distances only. That is for one DCMC source, we searched in 2MASS for all the possible matching sources in a radius of .
-
•
Between all the possible associations found, we kept only the association with the closest distance.
-
•
Then we made a map in of the distances to the closest neighbours :
-
–
Each cross–identification is marked with a dot in the plane.
-
–
The color of each dot depends on the distance of the cross–identification.
-
–
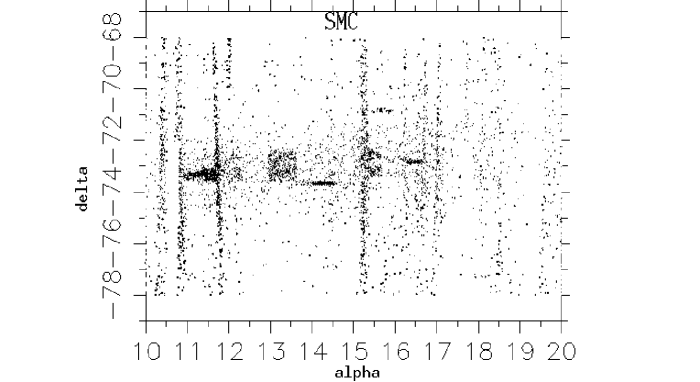
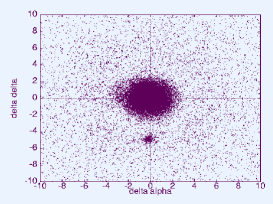
Fig. 3 shows the distance map for the central part of the SMC. We plotted only the cross–identifications with distances larger than . They cannot be taken for random associations because geometrical and well-defined patterns appear on the map. These patterns reveal problems in the astrometry for a few DCMC images and along the border of several strips. We found two main reasons to explain these results : systematic distance shifts associated with redundant DCMC sources and non-systematic effects dealing with field distortions.
 |
3.1 Redundant Sources
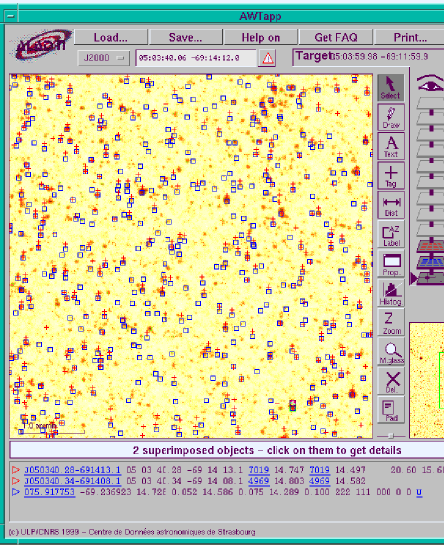
Redundant sources are located on the overlaps with adjacent strips, and with adjacent images of the same strip. Fig. 4 shows the Aladin view of a LMC region containing redundant DCMC sources. Aladin[7] is an interactive software sky atlas developed by CDS, allowing one to visualize digitized images of any part of the sky and to superimpose entries from astronomical catalogues. Redundant DCMC sources are systematically shifted by in declination above 2MASS sources. This problem mainly occurs in crowded regions where the number of USNO-A2.0 reference stars is small because of the confusion. It can happen that an astrometric reference star was incorrectly cross–identified with a DENIS source, leading to a systematic shift in RA or/and in DEC. It usually affects only one image, sometimes a few adjacent images. The DENIS sources located in the overlaps with the adjacent images of the same and adjacent strips were thus not properly cross–identified with the DENIS sources of those adjacent images.
 |
To find out the consequences of these redundant sources on the cross–matching, we took an area of 3 x 2.7
degrees in the LMC with and , and including redundant sources.
First we made a histogram of the distances to the closest neighbours (Fig. 5 (a)). The physical associations are
located on the left part of the histogram (distance ), whereas the non-physical random associations are on the right part.
This general feature is complemented here by
a rather striking effect : a bump is clearly visible around .
Then to understand better what was going on, we considered and separately (Fig. 5 (b)).
Each point represents one association between DCMC and 2MASS.
On the x-axis, we have :
and on the y-axis :
|
 |
If there is no significant shift between DCMC and 2MASS, all points should be centered around (0,0), which is the case for the great majority of stars. But we can see another cluster of points around (0,-5) which corresponds to the relative shift of the redundant sources ( in , in ). To characterize more precisely the faulty images, we took all the cross–identifications with distances between and and we plotted them in (Fig. 5 (c)). They appear to be well located inside a square region of the sky : the images 70 and 71 of the strip 4969. All images affected by redundant sources were discarded for the following of the procedure. 12 images are concerned in the LMC (0.1%) and 42 in the SMC (0.8%).
3.2 Field Distortions
Field distortions in the DCMC affect the quality of the astrometry. To detect them, we proceeded strip by strip as follows :
-
•
We kept only well confirmed DCMC sources : and flags in the I band equal to zero.
-
•
We ran a cross–matching program based only on distances, with a searching box that goes up to .
-
•
Between all the possible associations found, we kept only the association with . The selection is done on magnitude because in case of field distortions small distances are not a reliable enough criterion.
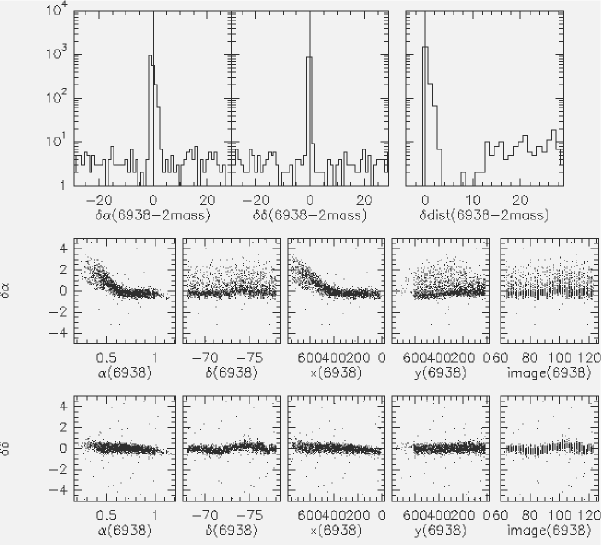
As an example, the results of the cross–identification for strip 6938 are summarized in Fig. 6. The relative shifts and are a function of the pixel coordinates (x,y) of the camera. The maximum shift in between DCMC and 2MASS goes up to . We found 11 and 14 strips affected by field distortions at a level larger than in the LMC and SMC, respectively. One of them (strip 5830 in the SMC) had to be rejected because of erroneous astrometric calibration.
 |
3.3 Photometry
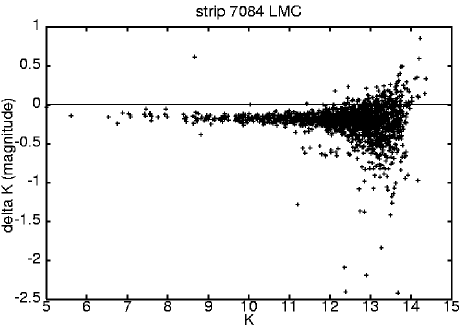
We also searched for a systematic shift in magnitude between the DCMC and 2MASS for the J and bands. We used the cross–identifications coming from Sect. 3.2. Mean shifts in J and have been computed for each strip. The results presented on Fig. 7 are for the strip 6938 (slot 4034). The magnitude shift is -0.07 for the J band and -0.24 for the band.
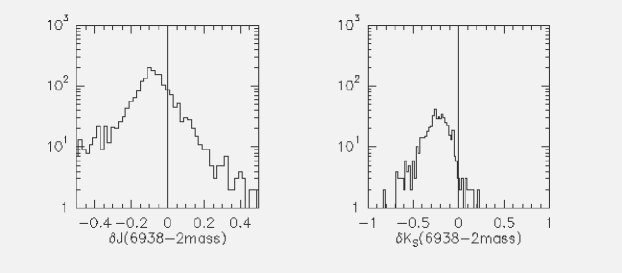 |
(Right) histogram.
4 CROSS–MATCHING CRITERIA
The astrometric and magnitude shifts depend on the strip and have to be taken into account. Strategies for coping with them have been implemented, to allow a proper strip by strip cross–matching of both catalogues. For each DCMC source of a given strip, we search the best 2MASS association using both position and magnitude criteria :
-
1.
Selection on coordinates : The shifts in and vary inside the images of the strip but distortions do not vary significantly along the strip. They are approximately the same for all the images of the strip. So it is better to use the statistics of the whole strip instead of one single image. Thus we can define a specific searching box for the strip. The size of the box will take into account the shifts in and found for this strip number as explained in Sect. 3.2. The default size of the searching box when there are no shifts is . So we have now an enlarged and assymetric searching box :
where , , , are the minimum and maximum shifts in right ascension and declination.
-
2.
Selection on magnitudes : Between all the possible associations found in step 1, we must keep the best one. We have seen that keeping the association with the smallest distance is no more a reliable criteria because of field distortions. So we have to check the compatibility in magnitude for each association, after applying on the strip data the associated mean magnitude shifts and computed in Sect. 3.3.
-
•
If is not detected in one or both catalogue, the selection is done on J. The following relation has to be true to keep the association :
where is a weight, and and are the relative photometric uncertainties as quoted in both catalogues. Relative uncertainties are in general very small for bright stars, less than 0.01 mag. However, uncertainties on the absolute calibration are much larger : about 0.1 mag for the DCMC. If we apply abruptly the above criterion, we will lose many cross–identifications for the stars with small relative uncertainties. We thus need to refine the selection criterion and consider two cases :
then then where is the maximum width of the distribution.
-
•
If J is not detected in one or both catalogue, the selection is done on as above but this time we have .
-
•
If J and are detected in both catalogues, the selection is done on J and then on J-.
-
•
If J and are not detected in one or both catalogue, the association is lost.
-
•
-
3.
Applying these criteria, if there are still more than one possible association for one DCMC source, then we keep the association with the smallest or .
5 RESULTS
Running the cross–matching programs took about two hours for each Cloud on a Unix station. For each strip, we computed the percentage of DCMC sources matched with 2MASS. Results are summarized in Table 2. Nearly 80% of the LMC strips and 70% of the SMC strips have a match rate better than 90%. The 16 LMC and 18 SMC strips with a match rate smaller than 80% correspond to the gaps in the 2MASS data. The merged point sources have at least two of the four photometric bands and J or is always present because it was the magnitude link between the two catalogues. Table 3 lists the number of merged sources as a function of detected wavebands. When J or is present, it comes either from the DCMC or 2MASS, or from both.
86% and 83% of the DENIS point sources are matched with 2MASS for the LMC and SMC, respectively. The number of stars in common is 1252700 in the LMC and 278856 in the SMC.
| LMC | SMC | ||
|---|---|---|---|
| Match rate | Number of strips | Match rate | Number of strips |
| 42 | 30 | ||
| 52 | 30 | ||
| 9 | 10 | ||
| 16 | 18 | ||
| Total | 119 | Total | 88 |
| LMC | SMC | ||
|---|---|---|---|
| IJ | 3 | IJ | 0 |
| I | 0 | I | 0 |
| J | 10 | J | 1 |
| IJ | 58 | IJ | 16 |
| IJH | 0 | IJH | 0 |
| IH | 0 | IH | 0 |
| JH | 699 | JH | 185 |
| IJH | 1251930 | IJH | 278654 |
| Total | 1252700 | Total | 278856 |
 
|
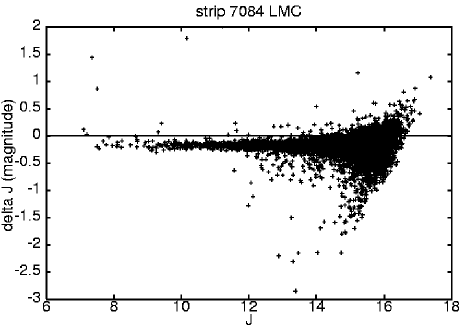
We tried to find a mean relation between DCMC and 2MASS magnitudes, restricting to the range [10,14] in J and [8,12] in , avoiding saturated bright stars as well as the faintest ones. There is a systematic shift of the absolute calibration between the two catalogues (Fig. 9). For each strip, we calculated the median of and . Fig. 10 shows the histograms of all the shifts found. The mean systematic shift between the two catalogues is -0.10 in J and -0.14 in .
New color–magnitude diagrams (CMDs) produced out of the merged catalogue are presented as in Fig 11.
|
 
|
 
|
6 CONCLUSION
The work presented here is an intermediary step before the production of a Master
Catalogue of stars towards the Magellanic Clouds (MC2[8]) which is to
appear at the end of 2001. The Master Catalogue should also include cross–identifications
with catalogues and tables at other wavelengths : GSC–II (optical), MSX
and IRAS (far infrared).
This reference catalogue will be made available as a support for a number of studies
concerning, e.g. the stellar populations in the Magellanic Clouds, the structure of the
Clouds, or certain classes of objects (Cepheids, AGB stars, etc.). Recent articles,
such as those by Nikolaev & Weinberg (2000)[9] and Cioni et al. (2000)[10] have
demonstrated the power of near infared surveys to improve our understanding of those
neighbouring galaxies.
ACKNOWLEDGMENTS
This publication makes use of data products from the Two Micron All Sky Survey, which is a joint project of the University of Massachusetts and the Infrared Processing and Analysis Center/California Institute of Technology, funded by the National Aeronautics and Space Administration and the National Science Foundation, and from DENIS, which is the result of a joint effort involving human and financial contributions of several Institutes mostly located in Europe. It has been supported financially mainly by the French Institut National des Sciences de l’Univers, CNRS, and French Education Ministry, the European Southern Observatory, the State of Baden-Württemberg, and the European Commission under a network of the Human Capital and Mobility program.
References
- [1] N. Epchtein, E. Deul, S. Derriere, J. Borsenberger, D. Egret, G. Simon, C. Alard, L. G. Balázs, B. de Batz, M. . Cioni, E. Copet, M. Dennefeld, T. Forveille, P. Fouqué, F. Garzón, H. J. Habing, A. Holl, J. Hron, S. Kimeswenger, F. Lacombe, T. Le Bertre, C. Loup, G. A. Mamon, A. Omont, G. Paturel, P. Persi, A. C. Robin, D. Rouan, D. Tiphène, I. Vauglin, and S. J. Wagner, “A preliminary database of DENIS point sources,” A&A 349, pp. 236–242, 1999.
- [2] M. F. Skrutskie, S. E. Schneider, R. Stiening, S. E. Strom, M. D. Weinberg, C. Beichman, T. Chester, R. Cutri, C. Lonsdale, J. Elias, R. Elston, R. Capps, J. Carpenter, J. Huchra, J. Liebert, D. Monet, S. Price, and P. Seitzer, “The Two Micron All Sky Survey (2MASS): Overview and Status.,” in ASSL Vol. 210: The Impact of Large Scale Near-IR Sky Surveys, pp. 25+, 1997.
- [3] M. R. Cioni, C. Loup, H. J. Habing, P. Fouqué, E. Bertin, E. Deul, D. Egret, C. Alard, B. de Batz, J. Borsenberger, M. Dennefeld, N. Epchtein, T. Forveille, F. Garzón, J. Hron, S. Kimeswenger, F. Lacombe, T. Le Bertre, G. A. Mamon, A. Omont, G. Paturel, P. Persi, A. Robin, D. Rouan, G. Simon, D. Tiphène, I. Vauglin, and S. Wagner, “The DENIS point source catalogue towards the Magellanic Clouds,” A&AS 144, pp. 235–245, 2000.
- [4] http://www.ipac.caltech.edu/2mass/releases/second/doc/explsup.html.
- [5] http://ecf.hq.eso.org/astrovirtel/.
- [6] D. G. Monet, “The 526,280,881 objects in the USNO-A2.0 catalog,” in American Astronomical Society Meeting, vol. 193, pp. 12003+, 1998.
- [7] F. Bonnarel, P. Fernique, O. Bienaymé, D. Egret, F. Genova, M. Louys, F. Ochsenbein, M. Wenger, and J. G. Bartlett, “The ALADIN interactive sky atlas. A reference tool for identification of astronomical sources,” A&AS 143, pp. 33–40, 2000.
- [8] http://astro.u-strasbg.fr/delmotte/MC2/.
- [9] S. Nikolaev and M. D. Weinberg, “Stellar Populations in the Large Magellanic Cloud from 2MASS,” ApJ 542, pp. 804–818, 2000.
- [10] M. R. Cioni, H. J. Habing, and F. P. Israel, “The morphology of the Magellanic Clouds revealed by stars of different age: results from the DENIS survey,” A&A 358, pp. L9–L12, 2000.