Gravitationally lensed high redshift galaxies in the field of 1E0657-56 ††thanks: Based on observations obtained with FORS at Paranal at UT1 of the VLT.
We present images and long-slit spectra obtained with FORS1 at UT1 of the VLT centered on the gravitational arc of the galaxy cluster 1E0657-56 (). The cluster is one of the hottest, most massive clusters known so far and acts as a powerful gravitational telescope, amplifying the flux of background sources by up to a factor of 17. We present photometric results together with the spectra of the gravitational arc () and four additional amplified high redshift objects ( to 3.08) that were also included in the slit by chance coincidence. A magnification map has been obtained from a lens model derived from the multiple image systems. We compare our observed spectra with models and briefly discuss the stellar contents of these galaxies. Furthermore we measured the equivalent widths of the C iv 1550 and Si iv 1400 absorption lines for the objects behind 1E0657-56 studied here, as well as for some additional starburst galaxies (nearby and at high ). For C iv we find an increasing absorption equivalent width with decreasing redshift. We discuss whether this correlation could be related to the increase of metallicity with the age of the universe.
Key Words.:
galaxies: clusters: general – galaxies: starburst – galaxies: evolution – galaxies: formation – galaxies: stellar content – galaxies: fundamental parameters1 Introduction
In the recent years the technique pioneered by Steidel and Hamilton (SH92 (1992), SH93 (1993)) of deep imaging to identify U- and B-drop-out objects has been extremely successful in finding high-redshift galaxies. More than 700 galaxies with redshifts higher than 3 are known to date (Giavalisco et al. Getal98 (1998)). Parallel to these studies, an increasing number of high redshift objects has been found in the background of massive clusters of galaxies. The clusters act as a “gravitational telescope” (Pelló et al. PKBFMBCDM01 (2001)), magnifying and stretching the background galaxies. In particular, objects near the critical lines can benefit from large amplification factors (1 to 3 magnitudes) which ease spectroscopic follow-up observations. In addition, sometimes the gain in angular resolution allows studying the internal structure and kinematics of these usually rather compact galaxies. Spectacular examples of such studies are the pair of objects in the field of CL1358+62 (Franx et al. Franx97 (1997)), the gravitational fold arc galaxy cB 58 (Seitz et al. 1998, Carlberg et al. 1996) which also shows the features of a classical Lyman break object (Pettini et al. 2000), the arcs in A2390 (Frye & Broadhurst FB98 (1998), Pelló et al. PKBBETBMSSB99 (1999)), the star-forming galaxy in A2218 (Ebbels et al. E96 (1996).) Here we report on five high-redshift, gravitationally lensed objects we have found in the background of the cluster 1E0657-56.
Tucker et al. (1998) identified the extended Einstein source 1E0657-56 with a cluster of galaxies at a redshift of showing a velocity dispersion, measured from 13 galaxies, of . X-ray data from ROSAT and ASCA indicate that merging of at least two subclusters occurs in this highly luminous X-ray cluster. Tucker et al. (1998) derive a temperature of the hot gas in 1E0657-56 of . Note, however, that Yaqoob (1998) reanalyzed the X-ray data and derived a temperature of only. This still makes the cluster one of the hottest known yet. The total mass of 1E0657-56 within 1 Mpc, derived from the X-ray data, is about . Optical images of 1E0657-56 show the presence of a large gravitational arc approximately NW of the cluster’s center as well as several fainter arcs at other locations. In the following we describe the results of a photometric and spectroscopic study of the prominent arc (hereafter referred to as “the arc”) and some neighboring objects. In Sect. 2 we present the observations and the data reduction. In Sect. 3 we discuss the results. In Sect. 4 we draw our conclusions.
2 Observations and Data Reduction
The cluster 1E0657-56 was observed as a test object during the commissioning of the Focal Reducer Spectrograph (FORS1) at the Very Large Telescope (VLT) in December 1998 (Appenzeller et al. 2000). Images in the B (1500 sec), g (600 sec), R (3800 sec), and I (1200 sec) filters were collected using the standard resolution mode (0.2 arcsec/pixel), with seeing of 0.6–0.9 arcsec. During the same run long-slit spectra of the prominent arc (see Fig. 1) were acquired with FORS1, using the grism I150 and a slit width of . We covered the spectral range from to 9200 Å with a spectral scale of 5 Å/pixel. In total we gathered 3.5 h of exposure time with an effective seeing of about . Standard reduction (bias subtraction, correction for flat field variation, cosmic ray elimination) for both the photometry and spectroscopy data, as well as rebinning to the observed wavelength for the spectra, was performed using MIDAS routines. The B, g, R, and I images were calibrated using photometric standard sources observed during the commissioning. The accuracy of the relative calibration could be increased considerably by deriving the color-color diagrams of the library of stars in the FORS-filter system and comparing them to the numerous unsaturated stars observed in our field. For the spectroscopy, spectrophotometric standards were observed to flux calibrate the spectra.
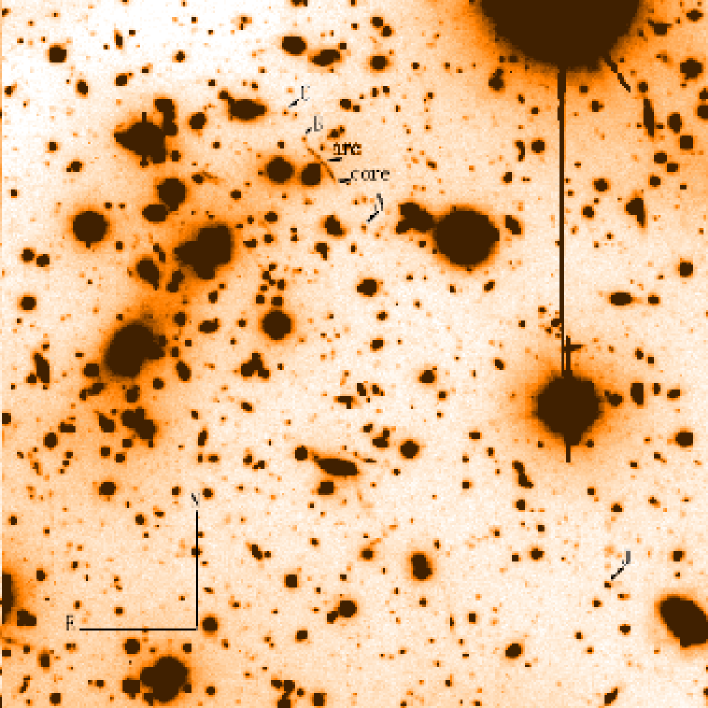
Figure 1 shows the central of one of the R-band images (with a depth of 500 sec exposure time). Six objects are marked: the gravitational arc, visible to the northeast of the image center, with the bright knot (“core”) at its southwest end, objects B and C to the northeast of the arc, objects A and J to the southwest. The magnitudes of the objects A, B, C, and J have been obtained using the SExtractor code (Bertin & Arnouts BA96 (1996)). Since the R-band data are by far the deepest we use them for the detection of the sources mentioned above and for the definition of the surface-brightness-contours of the arc. The ‘automatic’ magnitudes in the R-band are shown in Column 2 of Table 1, and those derived within an aperture of 3 arcseconds are given in Column 5. The data in the B, g, and I-band were convolved to the R-band seeing () and the magnitudes within -apertures are shown for the convolved data in the Columns 3, 4, and 6, respectively.
Photometric redshifts were derived using the method presented in Bender et al. (2001). This method is a template matching algorithm rooted in Bayesian statistics and resembles the method presented by Benitez (2000). The templates are semi-empirical and derived from the observed spectral energy distributions of galaxies in the Hubble Deep Fields. Except for the arc and the core we used the 3”-aperture colors to determine the photometric redshifts of the observed objects. For the arc and core we used the magnitudes of within , 25.5, and 26 magnitudes per square arcsecond, which corresponds to 8.3, 5.2, and 3.2-sigma contours above the sky background. The photometric redshifts for the different isocontours of the arc and core varied between 3.0 and 3.3 (see Table 1). These differences are smaller than the typical error of the photometric redshift for objects at , which is about 0.3 for the filters we have used here. Hence the differences in the colors for the arc measured within the 3 different isodensity-contours are irrelevant for the photometric redshifts derived. Figures 2 to 5 show the flux-calibrated spectra of 5 high- objects extracted from the longslit. The signal-to-noise ratios vary from 3 (Object B) to (Object J) per pixel, or about 14 to 50 per spectral resolution element. The most prominent feature visible in all the spectra is the Ly absorption line, but we also find several metal absorption lines. These lines – especially those from the interstellar medium indicated in Figs. 2 to 5 – establish the redshifts of all objects to be larger than 2. Furthermore, we see that the photometric redshifts (see Table 1) are in good agreement with those derived from the spectra.
| Object | Magn. | ||||||
| (mag) | (mag) | (mag) | (mag) | (mag) | |||
| 3.3 | |||||||
| 3.2 | |||||||
| 3.1 | |||||||
| 3.3 | |||||||
| 3.2 | |||||||
| 3.1 | |||||||
| Object | Raut | cB ( | cg ( | R ( | cI ( | Magn. | |
| (mag) | (mag) | (mag) | (mag) | (mag) | (mag) | ||
| A | 1.9–2.2 | 2.4 | |||||
| B | 2.5–2.8 | 2.4 | |||||
| C | 2.3–2.6 | 3.2 | |||||
| J | 0.95–1.0 | 2.6 |


3 Results and Discussion
3.1 Photometry
Inspection of Fig. 1 shows that the arc is located NE of the image center (NW of the cluster’s center). The arc’s brightness profile perpendicular to its major-axis is stellar, i.e., its FWHM agrees with that of a star (the FWHM for the data is for the R-band, in the B-band, for the g-band and for the I-band. ). The two-dimensional R-band flux distribution of the arc is shown in more detail in Fig. 6. Within the lowest contours shown, its length and width are and , respectively. In the following we distinguish a pure “arc” and the “core” at its SW end. The arc shows substructure, in particular three ‘spots’ with approximately the same surface brightness (after background subtraction), which we interpret to arise from the same source region. The brightness profiles through these spots along the indicated cuts in Fig. 6a are shown (after background subtraction) in sub-figures b, c, and d of Fig. 6 (solid lines). The brightness profile of a star has been scaled to the same maximum value and added in each case (dotted line). The comparison demonstrates that the arc is unresolved along these cuts. Fig. 6 shows the profile of the core component that is unresolved in width as well with a major to minor axis ratio of 1.55 within the dotted contour. For more illustration we have added a similar sub-figure (f) showing the brightness profile of the bright galaxy in the Fig. 6a, which clearly is non-stellar. We conclude from the images that the lensing configuration is the following: the core of the lensed galaxy is near but outside the cusp-caustic, and thus is mapped in only one image called “core”, whereas the outer region touches the cusp-caustic and is mapped into three merging images (for comparison, see the cusp-arc in A370; Fort & Mellier FM94 (1994)). Hence, in the 1E0657-56 arc, we see a high resolution map of the outskirts of a galaxy.
The comparison of the spectra of the arc and the core (see Fig. 2) shows that the two objects indeed have the same background source. In contrast, object B (which is located at the NE end of the arc) has a different redshift (Fig. 3) and other colors (Table 1) and hence does not belong to the same background source as the core/arc system. This fact additionally constrains the lensing model for 1E0657-56.

3.2 Lensing model
Using a simple lens model for the cluster, we derived a magnification of the original background sources by a factor up to 20 in flux. A detailed lensing model will be discussed in a separate paper (Seitz et al. 2001). Briefly, all mass distributions have been modelled either by a Singular Isothermal Sphere (SIS, with velocity dispersion as free parameter) or with the more general Elliptical Isothermal Sphere with a Core radius as described in Seitz et al. (SSBHBZ98 (1998)) (EISC, with velocity dispersion, ellipticity, orientation and core radius as free parameters). The best-fitting model parameters have been found using the arc and multiple images in the same way as described in Seitz et al. (1998). Multiple images have been selected by there optical appearance (arc-like, ‘broken arc’, parity reversed images), and cross checking surface-brightness and colors. Since the multiple images are extended, we have identified special positions (like knots in the arc, ‘head’ or ‘tail’ of an image), within every image belonging to a image-configuration, and defined these positions as ‘the’ positions for the lens modelling. This explains why the defined positions of the multiple images are not necessarily in agreement with the center of light of these objects.
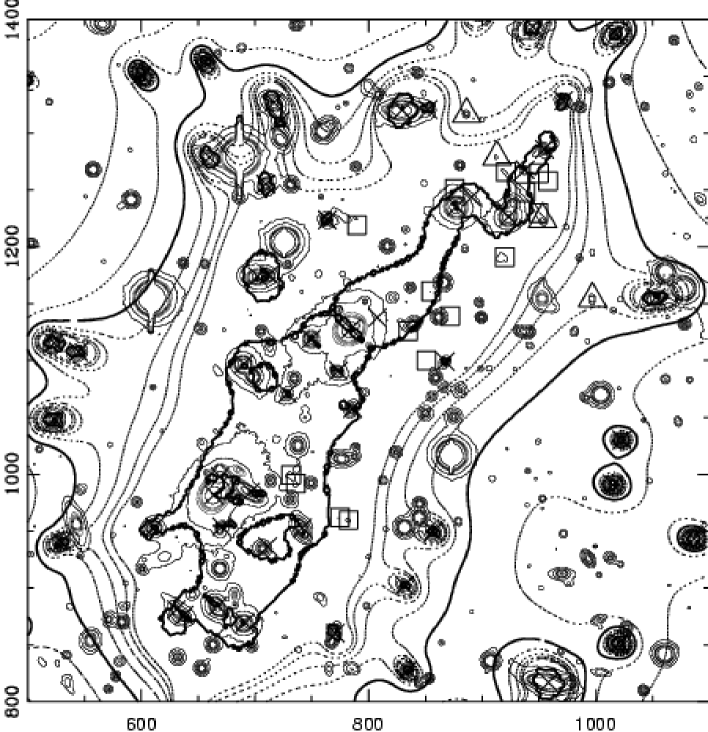
The procedure of the mass modelling was the following: we started from the minimum mass, that the cluster has to have, due to its visible member galaxies: about 150 early type cluster galaxies have been identified by their colors and then their masses have been modeled with singular isothermal spheres using the Faber-Jackson relation (Faber & Jackson FJ76 (1976)). Although the FJ-relation has a quite large scatter, and therefore the light deflection is not accurately described for individual galaxies, this procedure ensures that on average the masses of the galaxies are taken into account correctly, and in particular the mean magnification caused by them is taken into account. The galaxy masses alone are not sufficient to produce the observed multiple images, however indicate the same substructure as a ‘guess by the eye’ lens modelling would derive for the dark matter distribution. Next we admitted three additional dark matter distributions (modelled by EISC) at the southern and northern subclump of the center of E0657, and at the brighter one of the two galaxies west of the arc. The positions of these dark matter distributions were allowed to vary as well, however did not change much from the optically guessed center. Next to critical lines (i.e. where multiple images and arcs arise) the exact mass distribution of cluster galaxies plays a critical role for the light deflection and magnification of the sources. Therefore, we have modelled the nearest galaxies to the arc (the bright one west of the arc and the faint one north of it) by EISCs. Since we have about 16 multiple images (including the arc) positions for the lens modelling, the number of free parameters was never exceeded by the number of constraints. The positions of the multiple images are marked as empty squares in Fig. 7, and the positions of the masses (dark matter and cluster galaxies) are marked as crosses in the same Figure.
The magnification map (for a source) for the best fitting model is shown in Fig. 7. In the major part of the FORS field the cluster magnifies high-redshift sources by more than a factor of 2 in flux, in most of the central part (which is shown in this figure) the magnification is larger than two magnitudes!
The magnification intervals of the objects in Table 1 have been derived by exploiting the variety of ‘in principle-possible’ mass distributions. For example, instead of modelling the cluster galaxies by SIS, we have modelled them by elliptical isothermal spheres (with no core radius) and inferred the orientation and ellipticity from the assumption that the dark mass traces the galaxy light. Also, we have investigated the change of magnification if the bright galaxy 9″west of source A would be a cluster member (which it formally is not, due to its color). In this case (as expected) only the magnification of A is changed, from 1.9-2.0 to 2.1-2.2 magnitudes. The magnification of the sources A,B,C and core are constrained by the lens modelling, whereas the object J is fairly away from the multiple image region, and there the magnification is derived from assuming that the dark matter model (constrained in the center of the cluster) is a valid description also in the more outer region of the cluster.
3.3 Spectral Characteristics
The spectra of Fig. 2 to 5 are not unusual for high-redshift galaxies (Trager et al. TFDO97 (1997)). Several lines of highly ionized metals as well as Ly and Ly are seen in absorption; object C additionally shows strong Ly emission and object J a weak Ly emission component. The absence of a strong N v resonance line indicates a temperature of the dominating stellar population of 30000 K or below; furthermore, the absence of P Cygni emission at this effective temperature shows that supergiants do not contribute significantly to the integrated spectrum (Walborn, Parker, & Nichols 1995) or that the metallicity might be extremely low. The shape of the continuum redward of the Ly line is compatible with the above characteristics; however, determination of the temperature using the continuum slope strongly depends on the assumptions made concerning the presence of dust and the related UV extinction. For example, assuming a LMC law for the intrinsic reddening (see Howarth 1983), an uncertainty of in amounts to a change in the continuum slope that roughly corresponds to a temperature variation of about 5000 K. A more conclusive analysis of the stellar content using spectral features will require re-observation of these objects with a higher S/N ratio, and the use of a realistic model for the stellar population.
Nevertheless, we have undertaken a first tentative step towards a more quantitative analysis of the observed spectra of objects J and A, where the S/N is largest and the observed spectral range redward of Ly is large enough to determine the slope of the continuum flux reliably (which is not true for object C and the arc/core). Based on the above arguments we have used the Munich hot star wind code WMbasic (Pauldrach et al. Petal98 (1998), Petal01 (2001)) to calculate the spectrum of a single 25000 K B-main-sequence star, adopting a typical mass-loss rate of . We have tested models with solar, half solar, and 1/5th solar metallicity and find that the 1/5th solar metallicity model (corresponding to the metallicity of the SMC, see Haser et al. 1998) gives the overall best agreement with the strengths of the observed photospheric line features, but with the given S/N ratio we admit that this value of metallicity is not very well constrained.
Fig. 8 shows this spectrum overlaid on the spectra of objects J and A. To account for both galactic and intrinsic reddening in this comparison, we have de reddened the observed spectra (in the optical spectral range where they were observed) using Howarth’s (H83 (1983)) analytical expression for Galactic extinction with a value of (Burstein and Heiles BH84 (1984)) prior to blueshifting, and reddened the synthetic spectrum in its UV rest frame using the LMC extinction law (to allow for the expected lower metallicity in the observed galaxies) with and for objects J and A, respectively (the latter values are, of course, fit parameters). Apart from hydrogen (with a column density of at the rest frame of the stellar spectrum) we have not yet added interstellar absorption lines to the synthetic spectrum, hence the obvious discrepancy to the observed spectra at these line positions (marked with arrows in Fig. 8). Since the galaxy spectra represent the total stellar population we also expect the fit to improve for a superposition of synthetic spectra of different spectral types corresponding to a more realistic population. We attribute the large spectral difference between stellar model and galaxy spectrum blueward from Ly to the Lyman forest.


3.4 Equivalent Widths

To investigate the stellar population of the observed galaxies in more detail we also measured the rest frame equivalent widths of C iv 1550 and Si iv 1400 from continuum-normalized spectra in the following way:
| (1) |
where
| (2) |
is the line flux at the central rest frame wavelength . For the width of the line window we chose Å; Å is the spectral pixel scale. The continuum flux in the continuum-normalized spectra at is
| (3) |
The error of the measured equivalent width is dominated by the S/N of the spectra (the mean error of the continuum fit is ). For object B we could not measure reliably the equivalent width due to the low S/N of its spectrum.
As described in Section 3.1, in the “arc” of 1E0657-56 we see a map of the outskirts of the background galaxy at , while the “core” maps mainly the total galaxy. Hence, in principle, a gradient of the C iv and Si iv line strengths could be present in the arc. But as seen in Figs. 9a to c (filled circle and asterix) there is no significant difference of the stellar population in the central region and the outskirts of this high- galaxy.
To increase the sample and to compare our lensed galaxies with high- field galaxies we included in Fig. 9 measurements for some FORS Deep Field (FDF, see Appenzeller et al. Aetal00 (2000)) galaxies. The FDF objects were observed with the same spectroscopic setup as the galaxies in 1E0657-56 (see Sect. 2), but using the multi object mask instead of the long slit. The data reduction was performed as described in Sect. 2. To select a subsample of high- galaxies among the FDF sample we used following criteria: mag and . Additionally we needed spectra of sufficient S/N to determine reliable equivalent widths.
Figure 9a shows that for , increases with decreasing redshift. A weighted fit gives a slope of . To continue this relation to we also measured the equivalent width of 5 nearby starburst galaxies (NGC 1705, 4228, 5253, 7673, 7714) arbitrarily chosen from IUE archive111http://ines.vilspa.esa.es. The spectra were obtained by the Short Wavelength Prime Camera (SWP; Å) in the low dispersion mode (6 Å) and with the large aperture (). The standard reductions of the data was done via the pipeline provided by the archive. The equivalent widths were measures as described above. If the corresponding data points at are added to Fig. 9, the trend persists although the linear correlation is less pronounced (). However, if correct, the relation between the C iv strength with is expected not to be linear anyway. Interestingly, the scatter of the C iv equivalent width at is much larger than at high . This apparent correlation is not caused by the galaxies’ luminosity, since the absolute magnitude of our galaxies do not show any significant trend with their redshift. Since mainly depends on the metallicity of the stellar population but only little on the age of a starburst (Leitherer et al. Letal01 (2001)) the correlation with could indicate an increase of metallicity with decreasing redshift (i.e., increasing age of the universe) in the observed high luminosity galaxies. In this respect these galaxies seem to behave similar to the damped Ly systems (Savaglio et al. Saetal01 (2001)). The fact that the scatter for Si iv is much larger at all redshifts and that no correlation with is present for this line may have the following reasons: While is universally present for O supergiants, main sequence stars and dwarfs, is luminosity dependent and rapidly decreases from supergiants to dwarfs (Walborn & Panek 1984; Pauldrach et al. 1990). Therefore the Si iv is more strongly affected by population differences (i.e., stellar age differences) than the C iv line. has its maximum in B0/B1 stars, while is mainly universally present in O and bright B stars (e.g., Leitherer, Robert, and Heckman LRH95 (1995)). Hence the ratio of contains information about the star formation history (instantaneous or continuous) and the stellar population itself (e.g., IMF and cutoff masses). Unfortunately the different parameters that determine the value of cannot be disentangled easily.
As seen in Fig. 9c the ratios of for our high- galaxies are randomly scattered and show no detectable trend with redshift. However, if the local starburst galaxies are included a trend corresponding to increasing ratio with seems to be present (a weighted fit gives ). This could be understood in terms of increase of the relative importance of continuous star formation (decrease of instantaneous starbursts) at low . To test the presence of this correlation we have started to investigate a larger sample of high- galaxies from our FDF survey ().
Finally, Figs. 9d to f show that there is no overall dependence of the measured equivalent width on the galaxies’ luminosity. If in fact is mainly determined by the metallicity, the nearby starburst galaxies seem to follow the well known local metallicity-luminosity relation (e.g. Kobulnicky & Zaritsky 1998), while the high- galaxies do not conform to this relation. As also found for Lyman break galaxies by Pettini et al. (2001) the high- galaxies investigated in this paper seem to be overluminous for their metallicity (), which may indicate that their mass-to-light ratios are low compared to present-day galaxies. Figs. 9d to f also show that our four galaxies magnified by 1E0657-56 belong to the intrinsically faintest starburst galaxies at high redshift that have been investigated spectroscopically so far. In this respect the present investigation provides a good example for the scientific potential of “gravitational telescopes” for the study of distant galaxies.
4 Conclusions
We report on the discovery of five high redshift () galaxies in the background of the cluster 1E0657-56 which are gravitationally lensed and thus magnified and amplified by the cluster. The most interesting object in the field is the prominent arc+core object lying NW of the clusters center. The core represents the main part of a high redshift background galaxy, while some part of the galaxy’s outer region is mapped into three merging images (the arc). We briefly discuss the lens model which yields a flux amplification of the background sources by a factor up to 20 in flux.
The spectra we obtained for the arc+core component and for four other objects confirm that these background sources are indeed young (starburst) galaxies at high redshift. Besides Ly the absorption features of several highly ionized metals are identified. Two objects show additional prominent Ly emission. A comparison with calculated stellar spectra shows that the light of these galaxies is dominated by hot () low metallicity ( 1/5 solar) stars.
The measurements of the C iv and Si iv equivalent widths of the objects studied here plus a sample of nearby and high z galaxies show a strong correlation of C iv with redshift. Though rather speculative at this stage, we interpret this as a result of the increase of metallicity with the age of the universe. The absence of any correlation of Si iv with redshift as well as a little evolution of the Si iv/C iv ratio points to variations in the star formation history and/or an evolution of the stellar population with redshift. These results will have to be confirmed by a larger sample of high- galaxies.
Acknowledgements.
We thank E. Falco and M. Ramella for pointing out this cluster to us as a possible target for our project and also for providing us with their previous NTT images. This research was supported by the Sonderforschungsbereiche 375 and 439, by the DFG in the “Gerhard-Hess-Programm” under grant Pa 477/2-3, and by the DLR under grant 50 QV 9704 1. Some image reduction was done using the MIDAS and/or IRAF/STSDAS packages.References
- (1) Appenzeller, I., Bender, R., Böhnhardt, H., et al. 2000, ESO Messenger, 100, 44
- (2) Bender, R., Appenzeller, I. Boehm, A., et al. 2001, “The FORS Deep Field: photometric data and photometric redshifts”, in the ESO/ECF/STScI Workshop on ”Deep Fields”, eds., S. Cristiani, A. Renzini & R. Williams, in press
- (3) Benitez, N. 2000, ApJ, 536, 571
- (4) Bertin, E., Arnouts, S. 1996, A&AS, 117, 393
- (5) Burstein, D., Heiles, C. 1984, ApJS, 54, 33.
- (6) Carlberg, R., Yee, H.K.C., Ellingson, R., et al. 1996, ApJ, 462, 32
- (7) Ebbels, T.M.D., Le Borgne, J.-F., Pelló, R., et al. 1996, MNRAS, 281, L75
- (8) Faber, S.M., Jackson, R.E. 1976, ApJ, 204, 668
- (9) Fort, B., Mellier, Y. 1994, A&AR, 5, 239
- (10) Franx, M., Illingworth, G. D., Kelson, D. D., et al. 1997, ApJ,486, L75
- (11) Frye, B., Broadhurst, T. 1998, ApJ, 499, L115
- (12) Giavalisco et al. 1998, ApJ, 503, 543
- (13) Haser, S. M., Pauldrach, A. W. A., Lennon, D. J., Kudritzki, R.-P., Lennon, M., Puls, J., Voels, S. A. 1998, A&A, 330, 285
- (14) Howarth, I. D. 1983, MNRAS, 203, 301
- (15) Kobulnicky, H.A., Zaritsky, D. 1998, ApJ, 511, 188
- (16) Leitherer, C., Leao, J.R.S., Heckman, T.M., et al. 2001, ApJ, 550, 724
- (17) Leitherer, C., Robert, C., Heckman, T.M. 1995, ApJS, 99, 173
- (18) Möller, C.S., Fritze-v.Alvensleben, U., Fricke, K.J. 2001, A&A, submitted
- (19) Pauldrach, A. W. A., Hoffmann, T. L., Lennon, M. 2001, A&A, in press
- (20) Pauldrach, A. W. A., Lennon, M., Hoffmann, T. L. 1998, in: Proc. 2nd Boulder-Munich Workshop, PASPC 131, 258
- (21) Pauldrach, A. W. A., Puls, J., Kudritzki, R.-P., Butler, K. 1990, A&A 228, 125
- (22) Pelló, R., Kneib, J.P., Le Borgne, et al. 1999, A&A, 346, 359
- (23) Pelló, R., Kneib, J.P., Le Borgne, et al. 2001, in ASP Conference Series, The evolution of Galaxies on cosmological timescales, eds. J.E. Beckman and T.J. Mahoney, in press
- (24) Pettini, M., Steidel, C.C., Adelberger, K.L., et al. 2000, ApJ, 528, 96
- (25) Pettini, M., Shapley, A.E., Steidel, C.C., et al. 2001, ApJ, in press
- (26) Savaglio, S., Panagia, N., Stiavelli, M. 2001, in ASP Conference Series, Cosmic evolution and galaxy formation: Structure, Interactions, and Feedback, eds. J. Franco, E. Terlevich, O. Lopez-Cruz, I. Aretxaga, in press
- (27) Seitz, S. et al. 2001, A&A in preparation
- (28) Seitz, S., Saglia, R.P., Bender, R., Hopp, U., Belloni, P., Ziegler, B. 1998, MNRAS, 298, 945
- (29) Steidel, C., Hamilton, D. 1992, AJ, 104, 941
- (30) Steidel, C., Hamilton, D. 1993, AJ, 105, 2017
- (31) Trager, S.C., Faber, S.M., Dressler, A., Oemler, A. Jr. 1997, ApJ, 485, 92
- (32) Tucker, W., Blanco, P., Rappoport, S., et al. 1998, ApJ, 496, L5
- (33) Walborn, N. R., Parker, J. W., Nichols, J. S. 1995, ”IUE Atlas of B-type Spectra”, NASA Reference Publication 1363
- (34) Walborn, N. R., Panek, R. J. 1984, ApJL 280, L27
- (35) Yaqoob, T. 1999, ApJ, 511, L75