Development of an XSPEC-Based Spectral Analysis System for the Coded-Aperture Hard X-ray Balloon Payload EXITE2
Abstract
We present the spectral analysis system for the second-generation Energetic X-ray Imaging Telescope Experiment (EXITE2) balloon payload. EXITE2 is an imaging hard X-ray telescope using a coded-aperture mask and a NaI/CsI phoswich detector operating in the energy range 20–600 keV. The instrument was flown on a high-altitude scientific balloon from Ft. Sumner, NM on 1997 May 7-8. We describe the details of the EXITE2 spectral analysis system, with emphasis on those aspects peculiar to coded-aperture instruments. In particular, we have made our analysis compatible with the standard X-ray spectral fitting package XSPEC by generating a response matrix in the appropriate format including all the effects of a coded-aperture system. The use of XSPEC, which may be a first for coded-aperture data, permits great flexibility in the fitting of spectral models. The additional effects of our phoswich system, or any other detector-specific considerations, may be easily included as well. We test our spectral analysis using observations of the Crab Nebula, and find that the EXITE2 Crab spectrum is consistent with those recorded by previous instruments operating in this energy range.
keywords:
balloons , gamma rays: observations , instrumentation: detectors , methods: data analysis , nebulae: individual (Crab Nebula)PACS:
95.55.Ka , 95.75.-z, ††thanks: Present address: Max-Planck-Institut für extraterrestrische Physik, Giessenbachstrasse, D-85748 Garching, Germany, Phone: +49 89 30000-3854; Fax: +49 89 30000-3606 , , ,
1 Introduction
The hard X-ray band (20–600 keV) is a difficult energy range for imaging instruments, since photon energies are too high for focusing optics ( 60–100 keV, within a very small field of view) and too low for Compton telescopes ( keV). Imaging instruments are needed to reduce source confusion in crowded fields and perform wide field-of-view observations for sensitive all-sky surveys. A practical method for hard X-ray imaging is the coded aperture technique [1], in which the position of the cosmic X-ray source can be deduced from the shadow cast by a specially-designed mask onto a large-area, position-sensitive detector. This technique has been successfully applied in numerous balloon and space-based instruments using large scintillator crystals for the detector [1], most notably the French SIGMA telescope [2].
We have developed the second-generation Energetic X-ray Imaging Telescope Experiment (EXITE2) balloon payload, a successor to the original EXITE instrument [3], as a coded-aperture telescope that reduces background using the “phoswich” technique [4]. Although the phoswich technique has been used widely in non-imaging X-ray detectors, EXITE2 is an imaging phoswich detector optimized for spatial and spectral resolution to observe cosmic X-ray sources. (Another imaging phoswich balloon payload is the GRIP-2 telescope built by Caltech [5].) The EXITE2 payload has been described in detail previously [6, 7, 8, 9]. Briefly, the main detector is a 36 cm 36 cm 1 cm NaI(Tl) crystal surrounded on five sides by 2 cm of CsI(Na). Scintillation light from both crystals is collected by a array of photomultiplier tubes (PMTs), allowing the position of the X-ray interaction to be reconstructed by a maximum likelihood method (MLM) [10]. The measured position resolution is mm (FWHM) over most of the detector. NaI(Tl) has a scintillation light decay time of 230 ns, whereas the decay time for CsI(Na) is 680 ns; therefore, the shaped pulse rise time of each event can be measured by a pulse-shape discriminator (PSD) circuit and used to distinguish events absorbed in the NaI from those absorbed in the CsI. The energy of each X-ray event is given by the total light recorded by all 49 PMTs (i.e., the sum of the 49 calibrated pulse heights) combined with the detector gain map, which reflects that fact that photons interacting near the edge of the detector produce fewer detectable scintillation photons. The energy resolution over the entire detector is (FWHM). The PMT gains and offsets (that is, the pulse height channel to energy conversion) are continuously calibrated by four nCi 241Am sources (the “Amcal” sources), which provide 60 keV photons, and 12 LEDs. The Amcal sources are embedded in plastic scintillator coupled to a dedicated PMT via optical fibers, allowing calibration events to be tagged with % efficiency by detection of the coincident 5 MeV -particle. Since the LEDs and Amcal sources have known count rates, 40 counts s-1 total for the four Amcals and 133 Hz for the LEDs, they also provide a measure of the detector deadtime and overall system throughput. Imaging is achieved using a element uniformly-redundant array (URA) coded mask (50% open), extended to cover cycles, placed 2.5 m from the detector. The mask pixels, made of graded lead (12 mm), tin (1 mm), and copper (0.9 mm), are 16 mm square, giving an angular resolution of 22′. A graded lead-brass collimator limits the field of view of the detector to one cycle of the mask pattern, or (FWHM). Telescope aspect is recorded continuously for in-flight corrections and post-flight image reconstruction. Elevation data is given by an inclinometer and shaft-angle encoder, while azimuth data during the daytime are given by either a sun sensor or differential GPS system. We found these daytime aspect systems to be accurate to . At night an intensified video camera records star fields on-axis, allowing pointing to be determined to .
In this paper we report on calibration observations of the Crab Nebula performed by EXITE2 during its first science flight from Ft. Sumner, NM on 1997 May 7–8. We focus on our spectral analysis system, which we have made compatible with the standard X-ray spectral analysis software package XSPEC [11]. This may be the first use of XSPEC with a coded-aperture telescope, and so we describe in detail the method by which our data are analyzed, including the effects of the coded-aperture imaging system in the response matrix. Such a system could be made to work as well for future coded-aperture instruments, such as INTEGRAL and the proposed hard X-ray imaging survey telescope EXIST [12].
2 Observations
The EXITE2 payload was launched from the National Scientific Balloon Facility (NSBF) base in Ft. Sumner, NM at UT 16:15 on 1997 May 7. Due to high westerly winds at our float altitude (115,000–127,000 feet), the observing time was limited to 15 hours. During this time observations were performed of the Crab Nebula, the X-ray binaries 4U 0614+09 and Cyg X-1, and the active galactic nuclei (AGN) 3C 273 and NGC 4151. In this paper we describe our Crab observations; our observations of Cyg X-1 and the AGNs are discussed in separate papers [13, 14]. We did not detect 4U 0614+09, though our data amounted to only 101 seconds of live time (see below).
The Crab Nebula was observed first in the flight, from UT 23:16:00 on 1997 May 7 until UT 00:16:00 on 1997 May 8 (17:16:00–18:16:00 local time). Several problems occurred during the Crab observation that limited the effective observing time. During the initial daytime portion of the flight the azimuth gyroscope electronics overheated, so that the Crab (and 4U 0614+09) drifted in and out of the field of view. (This was fixed by power cycling later in the day and was not a problem during the night.) In addition, a discriminator was incorrectly set, resulting in a large deadtime. Nevertheless, the Crab was strongly detected in only minutes of live time, as measured by the recorded Amcal rate.
3 EXITE2 Spectral Analysis Procedure
The analysis of EXITE2 spectra is performed with XSPEC. The XSPEC program requires as input two files in the FITS format: a Pulse Height Analyzer (PHA) file, containing the count spectrum, and a Redistribution Matrix File (RMF), which describes the instrument response and the pulse height to energy conversion. Additional information may be provided in an Ancillary Response File (ARF), which contains additional multiplicative factors for the response as a function of energy. We note that the standard XSPEC Background (BKG) file is not needed in our case, as the source counts derived from a coded-aperture telescope are already background-subtracted (see Section 3.1). The standard practice is to include in the RMF only the relative probabilities, normalized for each matrix row, of photons being recorded in various pulse height channels (that is, “redistributed”) due to the detector energy resolution, escape peaks, Compton scattering, and any other effects. The effective area as a function of energy is then contained in the ARF file, which includes the effects of the detector efficiency, absorbing materials, collimator response, etc. In the case of EXITE2, however, the inclusion of the PSD rejection efficiency makes the calculation of the redistribution and the effective area difficult to disentangle (see Section 3.2). We have therefore strayed from convention and placed the effective area directly in the RMF file, including all effects which do not change from observation to observation. We have used the ARF file to contain observation-dependent corrections to the effective area, specifically the effects of atmospheric absorption and collimator transmission due to pointing errors.
3.1 Count Spectrum: The PHA File
The PHA file contains the count spectrum, or the number of counts detected in a given time within each detector pulse height channel. Once the detector is calibrated, these pulse height channels correspond directly to energy bands. Since EXITE2 is a coded-aperture imaging telescope, the counts in each channel are found by producing an image in each of the 12 logarithmically-spaced EXITE2 energy bands (chosen to contain roughly equal counts from a Crab-like spectrum). Images are formed by correlating the recorded detector image (the shadow of the mask) with the mask pattern; for a uniformly-redundant mask, the result for a point source is a correlation peak, containing the source counts, on top of a flat background. (Details of coded aperture image reconstruction are given by Caroli et al. [1] and references therein; see also [16] and [8].) In the EXITE2 implementation, the detected counts within each band were binned spatially into “subpixels” to form detector images. The subpixel size, 2.7 mm or 3.7′, was chosen to be one-sixth of the mask pixel size, allowing the mask pattern to be well over-sampled. Because the detector area is not equal to an integral number of mask patterns (), it was then necessary to “pixel shuffle” the detector images in order to perform the correlation using the whole area. This means that counts from the entire detector were shifted and averaged into the corresponding subpixels of one basic mask pattern, in the process improving the signal-to-noise[16, 13]. These shuffled detector images were correlated with the mask pattern to produce sky images. The source counts were then given by the maximum value within an subpixel (40.7′) box around the correlation peak. The mean background level and RMS noise were calculated using all counts outside this box, and the mean was subtracted from the peak value. The EXITE2 correlation is “balanced,” meaning that the numerical mask pattern is composed of 1’s and -1’s to represent, respectively, open and closed mask pixels; this mean background level should therefore be close to zero [15].
Due to the poor pointing stability during the Crab observation, it was necessary to produce images in each band in one second increments. These images were then shifted and added according to the aspect solution from the shaft angle encoder (elevation) and differential GPS (azimuth, which agreed with the independent azimuth determination provided by the sun sensor), since the Crab was observed during the day. Only images with an offset less than 20 subpixels () were included. For each offset included the collimator response was calculated, and a total weighted average of the collimator attenuation was included as a correction in the ARF file (see Section 3.3). The stacked images thus produced give the total source counts in each pulse height band; these 12 numbers and their errors make up the PHA file. The total live time, as calculated from the total number of Amcal events in all the data used in the stacked images, is also included in the PHA file. Finally, an “area scaling factor” is needed in the PHA file due to the pixel shuffling procedure: since the counts in corresponding subpixels are averaged, not added, the total counts appearing in the correlation peak will be reduced from the total recorded (although the averaging improves the signal-to-noise[16, 13]). This scaling factor is simply the ratio of the area of the basic mask pattern to that of the entire detector.
3.2 Response Matrix: The RMF File
The response matrix describes how photons of a given energy are recorded as counts within a given detector pulse height channel, and gives the conversion between pulse height channel and energy. The physics of photon interactions in the detector material and all surrounding materials must be included. In addition, any further effects peculiar to a given instrument must be taken into account. In a coded-aperture telescope, an important correction arises due to the finite position resolution of the detector. Since the recorded detector image will be blurred by the position resolution, the height of the correlation peak will be reduced [1, 16, 8]. In EXITE2, this effect is energy and position dependent, since the position resolution depends on the number of scintillation photons collected. In addition, residual glow in the detector, caused mainly by long time-constant decay modes in the CsI after cosmic ray interactions, leads to an additional degradation in position resolution [9]. Thus it is necessary to calculate the appropriate “imaging factors” for each energy band. This was done by convolving the ideal detector image (the mask pattern) with a Gaussian whose width was given by the measured spatial resolution and varied spatially according to the gain map. The effect of residual glow, as measured by the position resolution of the calibration LED images [9], was included as well. This blurred detector image was then correlated with the mask pattern. The ratio of the height of the correlation peak to the height of the mask auto-correlation peak gives the imaging factor. The EXITE2 imaging factors are plotted as a function of energy in Figure 1. An additional minor correction in coded-aperture telescopes may be made due to the transparency of the mask at high energies, which reduces the difference between open and closed pixels in the detector image. This is not a large effect in the EXITE2 energy range, but we include it.
Additional corrections depend on the type of detector involved. In the case of a phoswich detector such as EXITE2 the PSD rejection efficiency, or the probability that an event which deposits energy in the CsI will be rejected, plays a key role and must be included. This effect, which may be energy-dependent, helps determine the effective area of the detector, since accepting all CsI events would mean including two additional centimeters of sensitive volume below the NaI. Other effects could include the probability of background-rejection techniques excluding valid events. For example, EXIST will include depth-sensing at low energies to reduce background, and so the effective detector thickness will be affected [12].
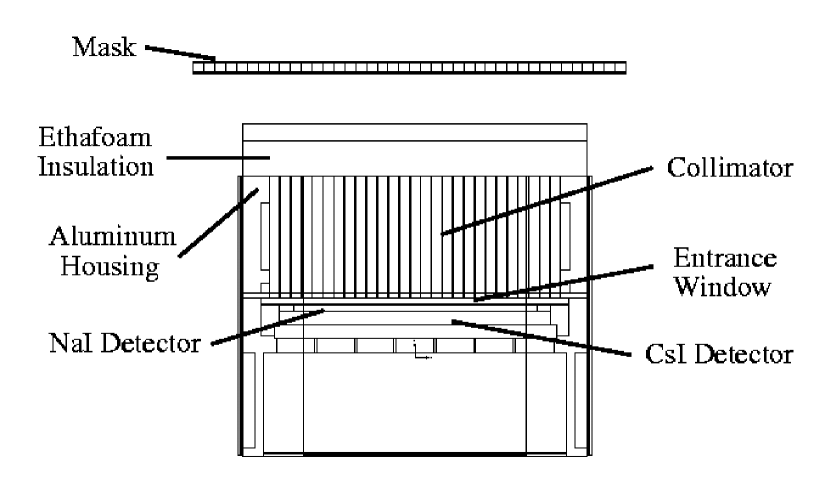
We constructed the EXITE2 response matrix using the Monte Carlo simulation package MGEANT [17] combined with extensive laboratory calibrations using radioactive sources. MGEANT is based on the CERN Program Library particle propagation and interaction simulation package GEANT, providing an improved user interface for specifying detector materials and geometry. We produced a detailed simulation of the EXITE2 detector and all surrounding materials, including the mask, collimator, entrance windows, insulation, NaI, CsI, and aluminum housing. The MGEANT EXITE2 model is shown in Figure 2. Then, at a series of input energies between 10 keV and 1200 keV, monoenergetic photons were allowed to enter the system. The input energies were spaced roughly logarithmically between 10 and 600 keV, giving 7–8 inputs per EXITE2 band, and every 30 keV from 600 keV to 1200 keV. For each input photon the total energy deposited by all interactions in the NaI and CsI crystals was recorded. The recorded energies were first blurred by a Gaussian distribution corresponding to the measured detector energy resolution (Section 1; this capability is included in MGEANT) and then binned into the 12 EXITE2 energy bands. The pulse height boundaries of the energy bands were determined based on 49-point scans with radioactive line sources, in which the response of each PMT was recorded. If more than half of the total energy was deposited in the CsI then the event was accepted or rejected according to the measured PSD efficiency for that band. This selection criterion is somewhat arbitrary, and could be improved with more careful modeling of the pulse shape expected from a combined NaI/CsI event. No correction was made for the slightly lower (%) effective light yield of the CsI.
Since the deposition of energy in the CsI is related to the probabilistic redistribution of photon energies (through Compton scattering, emission of K-escape photons, etc.) but the vetoing of events based on the PSD rejection efficiency helps determine the effective area, it was not possible to separate the two effects into separate files, as pointed out above. Therefore all unchanging factors which determine the effective area were placed in the main response matrix, or RMF file. The coded mask and other absorbing materials were already present in the MGEANT model. The fraction of the input events recorded in each band times the detector geometric area gives the effective area in that band. These effective areas were further reduced by the appropriate imaging factors and mask transparency factors. The results are shown in Figure 3. The resulting response matrix was finally converted into a FITS RMF file for use in XSPEC.
3.3 Atmospheric Attenuation and Collimator Transmission: The ARF File
As a balloon-borne instrument, EXITE2 suffers from atmospheric attenuation and pointing errors. Since the attenuation and pointing history change from observation to observation, we have not included them in the RMF file. Rather, we have created an ARF file for each observation containing only the additional multiplicative factors appropriate for the atmospheric grammage at that source elevation and balloon altitude and the weighted collimator response of the one-second intervals included (see Section 3.1). (The altitude varied between 115,000 feet and 127,000 feet, or g cm-2 and g cm-2 of residual atmosphere, during the flight.) As the source elevation changes during the course of an observation, the entire grammage history was taken into account and a weighted average attenuation at each energy was calculated. These multiplicative factors were combined at the energy of each response matrix row and converted into a FITS ARF file.
4 Results
The effective area of the EXITE2 instrument, as calculated using MGEANT and recorded in the response matrix including all the effects described in Section 3.2, is shown as a function of energy in Figure 3. This figure includes the effects of the residual atmosphere and pointing errors (recorded in the ARF file) from the Crab observation. The response remains flat above 100 keV due to decreased PSD rejection efficiency above keV, which effectively increases the thickness of the detector (and increases the background, of course). A detailed discussion of the PSD efficiencies and the actual sensitivity versus energy are given in a separate paper [13]. (We note that a previously-published calculation of the EXITE2 effective area [7] used overly-optimistic values of the imaging factors and did not include the effects of PSD rejection efficiency.) Figure 3 provides a vivid illustration of the difficulties inherent in performing sensitive imaging observations in the hard X-ray band. Although the geometric area of the NaI crystal is 1296 cm2, at 100 keV the degrading factors of the mask (0.5), atmosphere (0.49), collimator on-axis transmission (0.84), pointing errors (0.83), imaging factor (0.55), and other absorbing material conspire to reduce the effective area to about 115 cm2.
As described in Section 2, the live time during the Crab observation was limited by poor aspect and an improperly set discriminator to just 297 seconds. Nevertheless, the Crab is clearly detected. In Figure 4 we show the EXITE2 image of the Crab Nebula in the 50–70 keV band, in which the source is detected at a significance of . The contours begin at and represent steps of . The peak contour is located from the true location of the Crab, indicated by the cross. This is slightly greater than the accuracy of the differential GPS azimuth determination and represents the uncertainty in the boresighting between the GPS and intensified star camera.
The Crab was detected in EXITE2 images between 30 and 300 keV. We formed a count spectrum as described in Section 3.1 and fit it with a single power law model using XSPEC. In Figure 5 we show the EXITE2 Crab spectrum with the best fit power law of the form photons cm-2 s-1 keV-1 (the pegpwrlw model in XSPEC, which allows the user to select the normalization energy). At the top is the raw count spectrum, in the middle are the fit residuals, and at the bottom is the unfolded source photon spectrum. The residual in the lowest energy bin could be due to an incorrect value for the PSD rejection efficiency; at low energies the effective rise times for NaI and CsI events are similar, making good discrimination difficult [9, 13]. The best fit parameters are photon index and normalization photons cm-2 s-1 keV-1 at 100 keV (errors are 90% confidence for one interesting parameter). The reduced was 0.86 for 6 degrees of freedom. A broken power law model did not improve the fit, and XSPEC could not constrain the break energy.
In Figure 6 we compare the EXITE2 Crab spectrum with results from other instruments operating in the hard X-ray band, including GRIS [18], HEAO A-4 [19], and OSSE [20]. Both the GRIS and HEAO A-4 Crab spectra are best fit with broken power laws (a best fit for OSSE is not reported), though the break energies are quite different: keV for GRIS and keV for HEAO A-4. The power law indices reported above their respective break energies for GRIS () and HEAO A-4 () are consistent with the EXITE2 power law index, though at lower energy the spectra flatten ( for GRIS, for HEAO A-4). Even these values are consistent with the EXITE2 spectral index within . The GRIS, HEAO A-4, and OSSE normalizations near 100 keV only agree to within 20%; for GRIS and HEAO A-4 this is a discrepancy [18]. Our short observing live time does not allow us to resolve this issue; the EXITE2 data are consistent, within the error bars, with all previous measurements in the hard X-ray band (Figure 6).
5 Conclusion
We have successfully generated a response matrix for the EXITE2 imaging hard X-ray telescope and demonstrated its accuracy through calibration observations of the Crab Nebula. The peculiar effects of an imaging phoswich detector using a coded aperture mask have been accounted for and included. Our spectral analysis system is compatible with XSPEC, making it extremely flexible for detailed spectral fitting. We shall incorporate XSPEC into further EXITE2 analysis and suggest it be used for future coded-aperture analysis (e.g. with INTEGRAL or EXIST). The EXITE2 results for the Crab nebula are consistent with measurements by other instruments in the same energy band.
We wish to thank T. Gauron, J. Gomes, V. Kuosmanen, F. Licata, G. Nystrom, R. Scovel, and J. Apple for technical support, and J. Grenzke, K. Lum, and B. Robbason for software development. This work was supported in part by NASA grants NAGW-624 and NAG5-5103. PFB acknowledges partial support from NASA GSRP grant NGT5-50020.
References
- [1] E. Caroli, J. B. Stephen, G. D. Cocco, L. Natalucci, & A. Spizzichino, Space Sci. Rev. 45 (1987) 349.
- [2] J. Paul et al., Adv. Space Res. 11 (1991) 289.
- [3] J. E. Grindlay, M. R. Garcia, R. I. Burg, & S. S. Murray, IEEE Trans. Nuc. Sci. 33 (1986) 750.
- [4] J. D. Kurfess & W. N. Johnson, IEEE Trans. Nuc. Sci. 22 (1975) 626.
- [5] S. M. Schindler et al., Nucl. Instr. & Meth. A 384 (1997) 425.
- [6] R. P. Manandhar, K. S. K. Lum, S. S. Eikenberry, M. Krockenberger, & J. E. Grindlay, Proc. SPIE 2006 (1993) 200.
- [7] K. S. K. Lum, R. P. Manandhar, S. S. Eikenberry, M. Krockenberger, & J. E. Grindlay, IEEE Trans. Nuc. Sci. 41 (1994) 1354.
- [8] R. P. Manandhar, Ph.D. Thesis, Harvard University (1995).
- [9] Y. Chou, P. F. Bloser, J. Grenzke, J. E. Grindlay, K. S. K. Lum, G. Monnelly, & B. Robbason, in Conference Record of the 1998 IEEE Nuclear Science Symposium, IEEE, Piscataway, NJ, 1998, 210.
- [10] W. R. Cook, M. Finger, & T. A. Prince, IEEE Trans. Nucl. Sci. 32 (1985) 129.
- [11] K. A. Arnaud, in ASP Conf. Ser. 101, Astronomical Data Analysis Software and Systems V, ed. J. H. Jacoby & J. Barnes, ASP, San Fransisco, 1996, 17.
- [12] J. E. Grindlay et al., in AIP Conf. Proc. 510, The Fifth Compton Symposium, eds. M. C. McConnell & J. M. Ryan, AIP Press, New York, 2000, 784.
- [13] Y. Chou et al., Astrophys. Jour., submitted.
- [14] Y. Chou et al., Astrophys. Jour., submitted.
- [15] E. E. Fenimore & T. M. Cannon, Applied Optics 17 (1978) 337.
- [16] C. E. Covault, Ph.D. Thesis, Harvard University (1991).
- [17] S. J. Sturner, H. Seifert, C. Shrader, & B. J. Teegarden, in AIP Conf. Proc. 510, The Fifth Compton Symposium, ed. M. C. McConnell & J. M. Ryan, AIP Press, New York, 2000, 814.
- [18] L. Bartlett, Ph.D. Thesis, University of Maryland (1994).
- [19] G. V. Jung, Astrophys. Jour. 338 (1989) 972.
- [20] R. Much et al., Astron. & Astrophys. 120 (1996) 703.
Fig 1: The calculated imaging factors for the EXITE2 coded-aperture telescope as a function of energy. The factors arise due to the finite position resolution of the detector, which degrades the correlation peak. All factors which affect the position resolution, including positional gain variations and residual glow from cosmic ray interactions, have been included.
Fig 2: MGEANT model of the EXITE2 detector. The components affecting the response matrix are labeled, including the coded mask, collimator, mylar and aluminum entrance windows, NaI and CsI crystals, aluminum housing, and Ethafoam thermal insulation.
Fig 3: Effective area of the EXITE2 detector from MGEANT simulations. The atmospheric and pointing parameters of the Crab observation were used. Included are the effects of mask attenuation, PSD rejection efficiency, mask transparency, and imaging factors. The response remains flat above 100 keV due to decreased PSD rejection efficiency, which effectively makes the detector thicker.
Fig 4: EXITE2 image of the Crab Nebula, 50–70 keV. The source is detected at a significance of 5.7 in this range despite a live time of only 297 seconds. The contours begin at 3 and represent steps of 0.5 .
Fig 5: EXITE2 spectrum of the Crab with a power law fit. The raw count spectrum is shown at the top, the fit residuals in the middle, and the unfolded photon spectrum at the bottom. The fit parameters are given in the text.
Fig 6: The best-fit EXITE2 power law spectrum of the Crab, together with Crab spectra from GRIS, HEAO A-4, and OSSE. Also shown are the unfolded EXITE2 data points.