X–ray bright optically quiet galaxies: the case of P3
Abstract
Recent X–ray surveys have clearly demonstrated that a population of optically dull, X–ray bright galaxies is emerging at X–ray fluxes of the order of erg cm-2 s-1. The nature of these objects is still unknown. We present the results of multiwavelength observations of what can be considered the best studied example: the Chandra source CXOUJ031238.9–765134 optically identified by Fiore et al. (2000) with an apparently normal galaxy at =0.159 and called “FIORE P3”.
Osservatorio Astronomico di Bologna, via Ranzani 1, 40127 Bologna, Italy
Dipartimento di Astronomia Universita’ di Firenze, Italy
Osservatorio Astronomico di Roma, Italy
Universita’ Roma Tre, Roma, Italy
IFCTR/CNR, Milano, Italy
1. Introduction
The unprecedent arcsec Chandra spatial resolution allowed to unambiguosly identify a class of X–ray emitting sources associated with the nuclei of optically “normal” galaxies without any obvious signature of AGN activity (Mushotzky et al. 2000, Barger et al. 2001, Fiore et al. 2000 (hereinafter F00), Giacconi et al. 2001, Hornschmeier et al. 2001). The high X–ray–to–optical flux ratio and the hard X–ray spectra both suggest the presence of an obscured AGN. Unfortunately, most of the sources are detected with a number of photons which is too low to apply conventional X–ray spectral fitting techniques and to constrain the absorbing column density. As a consequence, alternative possibilities (besides an obscured AGN) are still viable.
In this paper we present a multiwavelength study of the X–ray source CXOUJ 031238.9–765134 (hereinafter P3, being the third source catalogued by F00 in the field containing the quasar PKS 0312–76) optically identified as a normal early type galaxy at =0.159.
The observations have been carried out as a part of a program aimed to understand the nature of the sources responsible for most of the hard X–ray background by means of multiwavelength follow–up observations of hard X–ray selected sources serendipitously discovered in the XMM–Newton field of view. The survey (named HELLAS2XMM as extend the BeppoSAX High Energy Large Area Survey to XMM–Newton) is described elsewhere in this volume (Fiore et al. and Baldi et al.). Here we briefly report on the multiwavelength observations of P3 carried out in the X–ray, optical, infrared and radio bands and present the overall broad band energy distribution. A more detailed description of the observations and the results is reported in Comastri et al. (2001).
2. Multiwavelength observations


Radio observations were performed at 5 GHz with the Australia Telescope Compact Array (ATCA). The data were analysed with the software package MIRIAD. We searched for a possible radio counterpart of P3 within a box of 20 20 arcsec centered on the X–ray position determined by Chandra where the noise is relatively uniforme at an average level of 50 Jy. No sources were found and thus the 3 upper limit on the radio flux is 0.15 mJy.
Near Infrared spectroscopic observations were performed at the ESO Very Large Telescope (VLT). The galaxy has been observed with the 1′′ slit in two different different filters, SH (1.42-1.83 m) and SK (1.84-2.56 m), available for the Low Resolution grating (LR) in the Short Wavelength (SW) configuration of ISAAC. The corresponding H and Ks magnitudes are 15.7m and 14.9m respectively. The final spectra in both the filters are shown in the left panel of Fig. 1 (precision on the flux calibration 10%). Additional imaging observations in the L band have been performed with the ISAAC camera. The source is not detected at the limiting magnitude of 13.4m (3 upper limit).
Optical spectroscopy was performed with the ESO 3.6m telescope equipped with EFOSC2 during two different observing runs. The comparison of spectra taken one year apart shows a reasonable good agreement, compatible with the precision of the flux calibration ( 15%). In the righr panel of Fig. 2 we show the average of the two spectra, with the principal identified absorption lines labelled. Also plotted are the emission line [OII] at 3727 Å and the expected position of the H features. Unfortunately, at the redshift of P3 the H line position coincides with the stronger atmospheric telluric band in the optical. The magnitudes in the R and B bands are 18.0m and 19.7m respectively. The average redshift is = 0.15950.0007, measured from the position of the principal absorption lines and comparison with an early–galaxy template.
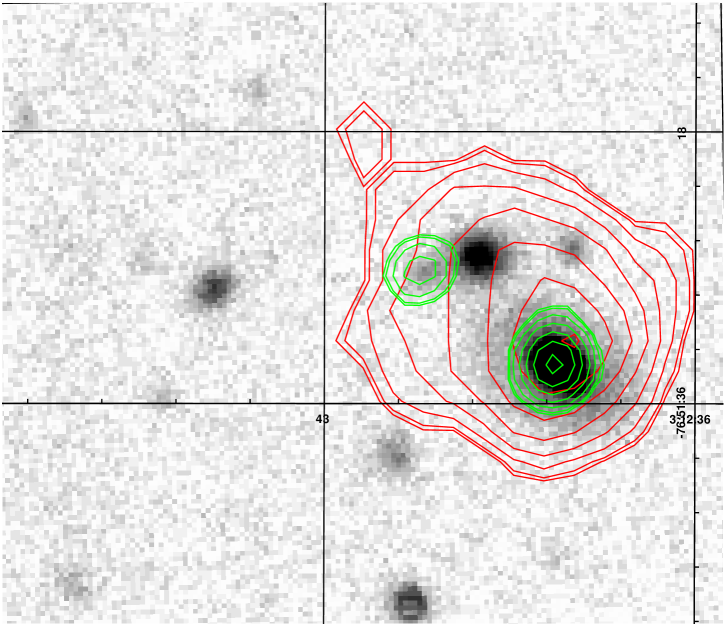
The Chandra observation reported by F00 has been combined with an additional exposure of the same field and analysed using version 2.1 of the CXC software. The 2–10 keV flux, computed from the exposure corrected image assuming a power law spectrum of = 1.8 and Galactic absorption, (8 1020 cm-2) is 2.6 10-14 erg cm-2 s-1. Although the counting statistic is too poor to allow spectral fitting the number of counts detected in the 2–8 keV and 0.5–2 keV bands suggest a hard spectrum. Our target was clearly detected also in the 25 ksec XMM–Newton PV observation of the same field. Even though the XMM positional accuracy is not as good as the Chandra one, the two X–ray centroids agree within about 2 arcsec. The XMM and Chandra contours are overlaid on a R band optical image in Fig. 2. It can be seen that the elongated XMM contours are probably due to the presence of a faint X–ray source which is clearly resolved by Chandra at a distance of 6 arcsec from P3.
The XMM–Newton data were analyzed using the latest version of the SAS software. The PN and MOS spectra were extracted from the cleaned event files, (see Baldi et al. 2001 for a description of data reduction) rebinned with at least 20 counts per channel and fitted simultaneously using XSPEC leaving the relative normalizations free to vary. The latest version of response and effective area files was used. The spectrum is hard also in the XMM–Newton observation being equally well fitted by a flat power law with photon index = 1.100.35 or by a steeper spectrum with the slope fixed at =1.8 (a typical value for AGN) plus an intrinsic column density = 85 1021 cm-2 at the source frame. The de–absorbed X–ray luminosity in the hard 2–10 keV band is about 3 1042 erg s-1.
3. What’s going on in the nucleus of P3 ?
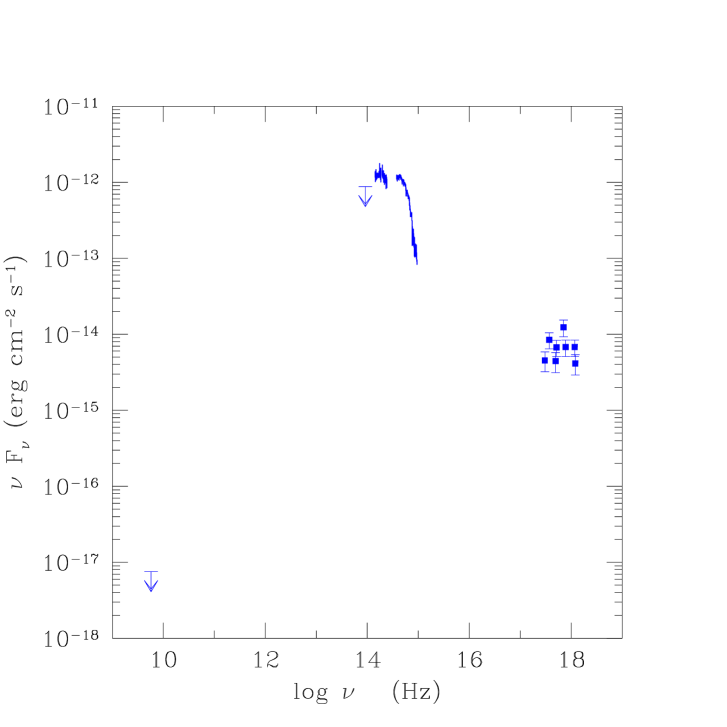
The broad band observations discussed above are shown in a vs plot in Fig. 3. At the first sight the overall spectral energy distribution (hereinafter SED) is clearly dominated by the optical–infrared light of the host galaxy. The X–ray flux level is however almost two order of magnitude greater than that expected on the basis of the – correlation of early type galaxies (Fabbiano et al. 1992). The relatively high X–ray luminosity and the X–ray spectral properties strongly suggest nuclear activity in the central regions of P3. Based on the Chandra detection and the optical spectrum F00 suggest three different possibilities namely: 1) a radiatively inefficient advection dominated accretion flow (ADAF), 2) a BL LAC object, 3) a completely obscured AGN. The multiwavelength observations presented in this paper allow us to investigate in more detail these possibilities.
Although the hard X–ray spectrum is consistent with the flat power law slope expected by (some) ADAF models (see Di Matteo et al. 2000), the model predicted radio flux is in excess of the present upper limit.
The BL Lac hypothesis might be tenable despite the presence of a large Calcium break and the low radio flux density. Indeed there is increasing evidence that the Blazars SED can be unified in a spectral sequence determined from the total luminosity (Fossati et al. 1998, Ghisellini et al. 1998). The objects populating the low–luminosity extreme of the sequence are called HBL (High peak BL Lacs) as their SED peak at relatively high frequency (typically in the X–rays) when compared to that of e SED of other blazars. The upper limit on the 5 GHz radio luminosity density ( 1039 erg s-1), on the radio to X–ray spectral index () and the flat slope in the X–ray band would be consistent with the presence of a rather extreme member of the HBL class hosted by the P3 galaxy.
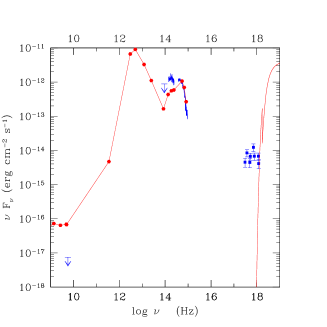
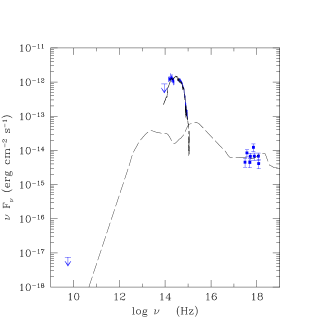
An alternative explanation would be the presence of an hidden AGN. There are several examples of (obscured) AGN discovered only by means of X–ray observations and not recognized by optical spectroscopy (see Matt, this volume, and reference therein). In order to test whether this is the case for P3 we have compared the observed SED (Fig. 4, left panel) with that of NGC 6240: a highly obscured AGN. The AGN SED is normalized to match the P3 optical flux. Besides the disagreement at long wavelengths which can be due to a more intense star–formation in NGC 6240, the P3 multiwavelength data are in relatively good agreement with the obscured AGN template. If P3 hosts a Compton thick AGN with a SED similar to that of NGC 6240 then a luminous X–ray source should be present at higher energies. The observed SED would be also consistent with an early type galaxy template normalized to match the optical and infrared spectrum plus the average SED of radio–quiet AGN (Elvis et al. 1994) rescaled to the observed X–ray flux (Fig. 4, right panel). In this case the optical AGN emission lines are diluted by the host galaxy starlight and could be revealed by narrow–slit optical spectroscopy with HST.
In both the cases further X–ray and optical observations are required to understand the nature of P3 and of the X–ray bright optically quiet galaxy population.
References
Baldi A., Molendi S., Comastri A., Fiore F., Matt G., Vignali C., 2001, ApJ, in press (astro–ph/0108514)
Barger A., Cowie L., Mushotzky R.F., Richards E.A., 2001, AJ, 121, 662
Comastri A., et al. 2001, in preparation
Di Matteo T., Quataert E., Allen S.W., Narayan R., Fabian A.C., 2000, MNRAS, 311, 507
Elvis M., Wilkes B.J., McDowell J.C., et al. 1994, ApJS, 95, 1
Fabbiano G., Kim D.W., Trinchieri G., 1992, ApJS, 80, 531
Fiore F., La Franca F., Vignali C., et al. 2000, (F00) New Astronomy 5, 143
Fossati G., Maraschi L., Celotti A., Comastri A., Ghisellini G., 1998, MNRAS, 299, 433
Ghisellini G., Celotti A., Fossati G., Maraschi L., Comastri A., 1998, MNRAS, 301, 451
Giacconi R., Rosati P., Tozzi P., et al. 2001, ApJ, 551, 664
Hornschemeier A., et al. 2001, in press (astro–ph/0108228)
Mushotzky R.F., Cowie L.L., Barger A.J., Arnaud K.A., 2000, Nature, 404, 459