A comprehensive study of reported high metallicity giant HII regions. I. Detailed abundance analysis
Abstract
We present long-slit observations in the optical and near infrared of fourteen HII regions in the spiral galaxies: NGC 628, NGC 925, NGC 1232 and NGC 1637, all of them reported to have solar or oversolar abundances according to empirical calibrations. For seven of the observed regions, ion-weighted temperatures from optical forbidden auroral to nebular line ratios have been obtained and for six of them, the oxygen abundances derived by standard methods turn out to be significantly lower than solar. The other one, named CDT1 in NGC 1232, shows an oxygen abundance of 12+log(O/H) = 8.95 0.20 and constitutes, to the best of our knowledge, the first high metallicity HII region for which accurate line temperatures, and hence elemental abundances, have been derived.
For the rest of the regions no line temperature measurements could be made and the metallicity has been determined by means of both detailed photoionisation modelling and the sulphur abundance parameter S23. Only one of these regions shows values of O23 and S23 implying a solar or oversolar metallicity.
According to our analysis, only two of the observed regions can therefore be considered as of high metallicity. The two of them fit the trends previously found in other high metallicity HII regions, i.e. N/O and S/O abundance ratios seem to be higher and lower than solar respectively.
keywords:
galaxies: abundances – galaxies: HII regions, abundances1 Introduction
The study of nebular abundances has been widely carried out in low metallicity HII regions, since they show a high excitation spectrum in which the temperature sensitive lines, like [OIII] 4363 Å are clearly visible and measurable. This allows the determination of the gas electron temperature and eventually the derivation of the ionic abundances of the different elements with observable emission lines. Some more complex effects have to be taken into account, like the existence of different temperatures for different lines, the possible presence of temperature fluctuations along the line of sight, corrections for unseen ionisation states, etc… which can be found from observations or from theoretical models, but they are of secondary importance unless a very high accuracy is needed, as can be the case for the primordial helium abundance determinations.
The analysis of high metallicity HII regions is far more complicated since, in general, their low excitation makes any temperature sensitive line too weak to be measured. In many cases, the [OIII] 5007 Å line, which is tipically one hundred times more intense than the auroral [OIII] 4363 Å one, can be barely seen. The reason for this is that the oxygen optical lines act as the main coolant for the nebula. A higher oxygen abundance leads to a more effective cooling and, as the gas cools down, the electron temperature gets lower and the [OIII] optical forbidden lines get weaker. This results in a well known anticorrelation between electron temperature –and hence emission line strengths of the oxygen lines– and oxygen abundances. This anticorrelation is the basis of the empirical calibrations used to derive abundances in regions in which the electron temperature cannot be directly determined. The one most widely used is that proposed by Pagel et al. (1979). It gives the O/H abundance as a function of R23 = ([OII] 3727 + [OIII] 4959, 5007)/H which is, to first order, independent of ionisation parameter. The calibration is empirical at the high excitation (low metallicity) end but, at the low excitation (high metallicity) one it has to rely on theoretical modelling, since up to now there are no direct determinations of abundances for high metallicity regions.
Single star photoionisation models show that R23 depends both on ionisation parameter, U, and on stellar effective temperature, T∗, and different assumptions about the effects of metallicity on either nebular ionisation structure or ionising temperature have been used by different authors to define a sequence of models that would eventually allow the calibration of the upper branch of the R23 versus (O/H) relation. From analyses of HII region data, McCall, Rybski & Shields (1985) concluded that T∗ varied with metallicity while the filling factor was constant, while Dopita & Evans (1986) concluded just the opposite: that T∗ was constant while U varied with metallicity. These two different assumptions produced calibrations of R23 yielding abundances that differ by more than a factor of two.
Theoretical stellar evolution models point to a relation between stellar metallicity and effective temperature so that, for a given mass, stars of higher metallicities show lower effective temperatures. This fact led McGaugh (1991) to produce a new R23 calibration based on more realistic theoretical models in which the ionisation was provided by stellar clusters and the effect of metallicity predicted by Maeder (1990) was taken into account through the use of the appropriate stellar atmosphere models. According to his models, in the high metallicity branch, R23 is relatively insensitive to both T∗ and U and the models converge to a unique line in the diagram. It should however be taken into account that McGaugh’s star clusters correspond to zero age stellar populations which might not be very representative of the ionising populations of HII regions. The evolution of massive stars is fast and metallicity dependent, and the cluster ionising temperature might not be a monotonically decreasing function of age due to the appearance of WR stars (García Vargas & Díaz 1994; García-Vargas, Bressan & Díaz 1995).
Yet, despite their difficulty, the importance of an accurate determination of the abundances of high metallicity HII regions cannot be overestimated since they constitute most of the HII regions in early spiral galaxies (Sa to Sbc) and the inner regions of most late type ones (Sc to Sd) (Díaz 1989; Vila-Costas & Edmunds 1992) without which our description of the metallicity distribution in galaxies cannot be complete. In particular, the effects of the choice of different calibrations on the derivation of abundance gradients can be very important since any abundance profile fit will be strongly biased towards data points at the ends of the distribution. It should be kept in mind that abundance gradients are widely used to constrain chemical evolution models, histories of star formation over galactic discs or galaxy formation scenarios.
With the aim of deriving accurate values of abundances in this regime we have undertaken the observation of HII regions for which a relatively high oxygen abundance (solar or oversolar) has been reported in the literature on the basis of empirical calibrations. A first work on this series has already been published (Díaz et al. 2000) in which the analysis of eight HII regions in the galaxy NGC 4258 was performed. Two of the regions analysed had been observed before and their oxygen abundances were found to be close to solar on the basis of the empirical R23 calibration. Our analysis, based on the measurement of the transauroral [SIII] 6312 Å line which, combined with the near infrared [SIII] 9069, 9532 lines, can provide a sulphur electron temperature, yielded oxygen abundances lower than solar by a factor of about two. Now, we have selected the HII regions to be observed from the sample of Van Zee et al. (1998) (hereinafter VZ98) who reported detections of the transauroral [SIII] 6312 Å line for some of them.
In section 2 we describe the observations; the results are presented in section 3, the calculated photoionisation models in section 4 and both are discussed in section 5. Finally, section 6 summarizes the main conclusions of this work.
2 Observations and data reduction
The observed HII regions have been selected from the sample of VZ98 and all of them present oxygen abundances close to solar or higher, as deduced from empirical calibrations based on optical forbidden lines. The selected regions are located in four spiral galaxies: NGC 628, NGC 925, NGC 1232 and NGC 1637 whose main properties are given in Table 1.
NGC 628 (M 74) is a late-type giant spiral classified as Sc(s)I (Sandage & Tammann, 1981) and SA(s)c (de Vaucouleurs et al., 1991 (hereinafter RC3)). Sharina et al. (1996) derive a distance of 7.3 Mpc by means of BV photometry of bright blue supergiants. Several authors have studied the radial abundance gradients across this galaxy (McCall, Ribsky & Shields 1985; Bresolin et al. 1999; Belley & Roy 1992; Ferguson, Gallagher & Wyse 1998; VZ98) as derived from empirical calibrations. We have observed four HII regions in this galaxy, identified as H13, H3, H4, and H5 in Hodge (1976). These regions are located at a galactocentric distance of 225 and VZ98 derive for them values of 12 + log(O/H) around 8.7.
NGC 925 is a late-type barred spiral classified as SBc(s)II-III (Sandage & Tammann 1981) and SAB(s)d (RC3). Son & Davidge (1998) derive a distance of 8.6 Mpc by means of VRI photometry of red supergiants. This result is in excellent agreement with that derived from Cepheids (Silbermann et al. 1996). The abundance gradients in this galaxy have been derived by Martin & Roy (1994), and Zaritsky et al. (1994) conclude that the oxygen gradient is flatter than those observed in normal galaxies of the same morphological type. The new observations of VZ98, however, result in a steepening of the abundance gradient across this galaxy. We have observed four of their HII regions, at a galactocentric distance of 20 for which VZ98 derive values of 12 + log(O/H) near solar (8.92).
NGC 1232 is a face-on Sc spiral with well defined optical colours (RC3) typical of late-type spiral galaxies. Van Zee et al. (1998b) adopt a distance of 21.5 Mpc based on its radial velocity, an assumed H0 of 75 Km s-1 Mpc-1 and a Virgocentric infall model. Sixteen HII regions have been analysed by VZ98. We have observed five of them.
NGC 1637 is a late-type barred spiral classified as SAB(rs)c by RC3 and SBc(s)II-III by Sandage & Tammann (1981). Son & Davidge (1998) derive a distance of 7.8 Mpc. The spiral structure is asymmetric with the single outer spiral arm segregated from the inner disc (Ryder & Dopita 1993). Fifteen HII regions in this galaxy have been observed by VZ98. We have observed one region from their sample which fits our selection criteria.
Our spectrophotometric observations were obtained with the 4.2m William Herschel Telescope at the Roque de los Muchachos Observatory, in 1999 November 8, using the ISIS double spectrograph, with the EEV12 and TEK4 detectors in the blue and red arm respectively. The incoming light was split by the dichroic at 7500 Å . Two different gratings were used: R300B in the blue arm and R600R in the red arm, covering 3400 Å in the blue (3800 to 7200) and 800 Å in the near IR (8840 to 9650) and yielding spectral dispersions of 1.73 Å pixel-1 in the blue arm and 0.79 Å pixel-1 in the red arm. With a slit width of 103, spectral resolutions of 2.0 Å and 1.5 Å FWHM in the blue and red arms respectively were attained. This is an optimal configuration which allows the simultaneous observation of a given region in both frames in a single exposure. Unfortunately, it excludes the [OII] 3727 line from observation. We have therefore complemented our data with those of VZ98 who observed this line on all cases.
The nominal spatial sampling is 04 pixel-1 in each frame and the average seeing for this night was 10. A journal of the observations is given in Table 2.
The data were reduced using the IRAF (Image Reduction and Analysis Facility) package following standard methods. The two-dimensional wavelength calibration was accurate to 1 Å in all cases by means of Cu, Ne and Ar calibration lamps. The two-dimensional frames were flux calibrated using three spectroscopic standard stars observed before and after each programme object with a 3 width slit. These standard fluxes have been obtained from the most updated version of the original Oke’s spectra (Oke 1990) and cover the 3200 to 9200 Å range. Standard fluxes between 9200 and 9650 Å have been obtained from stellar atmosphere models. The agreement between the individual calibration curves was better than 5% in all cases and a weighted mean calibration curve was derived. The spectra were previously corrected for atmospheric extinction using a mean extinction curve applicable to La Palma observing site. Regarding background subtraction, the high spectral dispersion used in the near infrared allowed the almost complete elimination of the night-sky OH emission lines and, in fact, the observed 9532/9069 ratio is close to the theoretical value of 2.48 in all cases.
Telluric absorptions are negligible in the observed spectra of NGC 628, NGC 1232 and NGC 1637. These features have been removed from the spectra of the other regions (NGC 925) dividing by a relatively featureless continuum of a subdwarf star observed on the same night.
3 Results
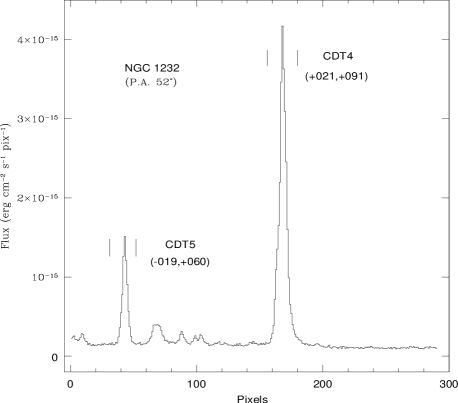
Figure 1 shows the spatial distribution of the H flux along the slit for the six different positions observed in the sample, a single one in the case of NGC 628, NGC 925 and NGC 1637 and three different ones for NGC 1232.
Regions H13, H3, H4 and H5 (after Hodge 1976) in NGC 628 are clearly resolved at position angle PA=38°. H3, H4 and H5 are very close together but have been analysed separately due to the different excitation conditions evidenced by the [OIII] optical forbidden lines.
Four different regions in NGC 925 are identified at PA=103°that we have named CDT1, CDT2, CDT3 and CDT4. They show a high degree of structure. CDT1, CDT2 and CDT3 are close to the nucleus of the galaxy.
Three different slit positions have been observed in NGC 1232. Two regions are clearly identified at PA=357°that we have named CDT1 and CDT2. Another region has been observed at PA=78°(CDT3) and two regions have been resolved at PA=52°(CDT4 and CDT5). Region CDT5 in NGC 1232 could not be observed in the near IR frame.
Finally, one HII region has been observed in NGC 1637 at PA=24°(CDT1). All the regions, except CDT5 in NGC 1232, had been previously observed by VZ98.
Two representative spectra of our sample are shown in Fig. 2 (region H13 in NGC 628) and Fig. 3 (region CDT1 in NGC 1232). Wolf-Rayet features around 4680, 5800 Å are seen in the spectrum of region H13 in NGC 628 and, to a lesser extent, in those of regions CDT1, CDT3, CDT4 and CDT5 in NGC 1232.
3.1 Line intensities
Emission line fluxes were measured using the IRAF SPLOT software package, by integrating the line intensity over a local fitted continuum. The errors in the observed line fluxes have been calculated from the expression = N1/2[1 + EW/(N)]1/2, where is the error in the line flux, represents the standard deviation in a box near the measured emission line and stands for the error in the continuum placement, N is the number of pixels used in the measurement of the line flux, EW is the line equivalent width, and is the wavelength dispersion in angstroms per pixel.
The observed line intensities relative to the H line were corrected for interstellar reddening according to an average extinction curve (Osterbrock 1989) and assuming the Balmer line theoretical values for case B recombination (Brockehurst 1971). The presence of an underlying stellar population is clearly evident in the blue spectra of the observed regions in NGC 925. The H and H Balmer lines are clearly affected by this stellar absorption. For all the observed regions an iterative process was applied in order to fit observed and theoretical Balmer line intensities and to obtain the reddening constant c(H) and its associated error. In all cases, H, H and H were fitted within the errors, except for the regions of NGC 925, for which H seems to be underestimated, and region CDT3 (NGC 1232) for which both H and H are clearly underestimated. Reddening corrected Paschen lines, when measured, are consistent with their theoretical values. Once the reddening constant has been determined from the Balmer and Paschen lines, the errors in the reddening corrected line intensities have been derived by means of error propagation theory. These line intensities, together with their corresponding errors, are given in Table 3 (NGC 628), Table 4 (NGC 1232), Table 5 (NGC 925) and Table 6 (NGC 1637) for all the observed HII regions . Also given in the tables are the extinction corrected H flux, the H equivalent width and the reddening constant. All the regions in our sample were observed by VZ98 and their measured intensities for the strongest lines are included in our tables for comparison. In general, both sets of measurements agree within the errors. The major differences arise in NGC 925 because of the high degree of structure, that makes difficult an accurate identification of each region.
3.2 Physical conditions of the gas
Electron densities for each observed region have been derived from the [SII] 6717, 6731 Å line ratio, following standard methods (e.g. Osterbrock 1989). They were found to be, in all cases, 200 cm-3, which corresponds to the low density limit.
Different auroral forbidden lines were used for temperature determinations when possible: [OIII] 4363 Å, [SIII] 6312 Å, [NII] 5755 Å and [SII] 4068,4076 Å together with their associated nebular lines. We followed the scheme proposed by Aller (1984) using the atomic data by Mendoza & Zeippen (1983), except in the case of [SIII] for which the more recent data by Tayal (1997) were used.
For seven HII regions, 50% of the sample, it was possible to determine the [SIII] temperature from the 6312 Å/ 9069,9532 Å ratio. These are the four observed regions in NGC 628 and three of the regions of NGC 1232. For five of them, at least another line temperature could be determined and for one of them, H13 in NGC 628, the four different temperatures: t(O++), t(N+), t(S++) and t(S+) were directly derived.
For region H13 in NGC 628, the four measured temperatures agree within the errors yielding a single value of Te = 9700 K. This is actually expected from theoretical photoionisation models (Stasińska 1980; Garnett 1992) in this temperature range. The predicted value of t(O+) is, according to the models, 9900 K. Region H3 in the same galaxy also shows comparable temperatures of about 10000 K. The rest of the regions for which temperature determinations are available, show temperatures substantially lower (5400 K T() 8700 K) implying higher abundances.
In these cases, photoionisation models predict S++ temperatures which are intermediate between those of O++ and O+. We have used the linear relation between t(O++) and t(S++) (t = 10-4 T) found by Garnett (1992) to predict the temperature of the O++ zone . For the three regions with measured temperatures in NGC 1232, predicted t(O+) are fully consistent with measured t(N+). For these regions t(O++) was predicted from the measured t(S++) using Garnett’s relation and was found to be intermediate between t(S++) and t(O+) with relatively low values (0.45 t() 0.84).
For the rest of the regions: CDT2 in NGC 1232 and all the observed regions in NGC 925 and NGC 1637, it was not possible to obtain a direct measure of the electron temperature. For these regions an average temperature has been adopted from the empirical calibration of the sulphur parameter, S23 = ([SII]6717, 6731 + [SIII]9069, 9532)/H, (Díaz & Pérez Montero 2000, (hereinafter DPM00)). No analysis for region CDT5 in NGC 1232, for which no IR data were obtained, has been performed.
Electron densities and temperatures for each of the observed regions are given in Table 7. Values of the electron temperature derived from measured line ratios are quoted with their corresponding error. The temperatures derived from other indirect means are shown without any error assigned.
3.3 Chemical abundances
Ionic abundances of the most relevant elements: helium, oxygen, nitrogen, neon and sulphur have been derived following standard methods (Pagel et al. 1992) and using the corresponding ion-weighted temperatures.
We have assumed that most of the oxygen is in the first and second ionisation stages, and therefore O/H = O+/H+ + O++/H+, and N/O= N+/O+. We have also assumed S/H = S+/H+ + S++/H+ which seems to be justified given the relatively low estimates of the electron temperature found for most of the observed regions.
For regions H3, H4 and H5 in NGC 628, no [OII]3727 Å line fluxes are available since these three regions were integrated together in VZ98. Therefore the total abundance of oxygen is derived by means of the empirical S23 calibration.
Mean values of the helium abundance have been determined from the He I 4471, 5876 and 6678 Å lines, using the expressions given by Kunth & Sargent (1983) and Benjamin, Skillman & Smits (1999). The contribution of neutral helium has been estimated from the expression:
(Kunth & Sargent 1983).
Ionic and total abundances for all the observed regions are also given in Table 7. Again, values derived from directly determined temperatures are quoted with their corresponding error, while those derived from empirical calibrations are shown without any error assigned.
3.4 Wolf-Rayet features
Relatively prominent Wolf-Rayet features have been observed at 4660, 5808 Å in region H13 in NGC 628 (see Figure 4). The observed stellar lines at the 4660 Å blue bump have been identified as: NV 4604, 4620 Å, NIII 4634, 4640 Å, a little contribution around 4650 Å possibly due to carbon, and the broad HeII feature at 4686 Å. Nebular emission lines, [FeIII] at 4658 Å and [ArIV] at 4711 Å are also observed. The red bump of the spectrum shows a broad CIV feature at 5801, 5812 Å while CIII at 5696 Å is absent. We can therefore classify the observed WR stars as WN7 with weak NV emission, no presence of CIII at 5696 Å and CIV present but weak. The observed feature around 4650 Å might belong to CIV, since we have not identified any lines from CIII in the spectrum (see Lundström & Stenholm 1984). The presence of CIV in WN spectra is widely discussed by Conti et al. (1983).
Another Wolf-Rayet feature has been observed in region CDT3 in NGC 1232 (see Figure 5, top). The observed blue bump at 4660 Å comprises the features of NIII 4634, 4640 Å, a weak contribution of CIV at 4660 Å and HeII 4686 Å lines. The NV lines at 4604, 4620 Å are not detected. Nebular lines, characteristic of shocked gas, are present, e.g. [FeIII] at 4658 Å, [FeIII] 5271 Å and [FeII] 5159 Å. Another evidence for the existence of shocked gas in this region is the observed broadening of the nebular [OI]6300, 6364 Å forbidden lines. The red bump at 5808 Å shows a weak CIV feature at 5801, 5812 Å. CIII at 5696 Å is absent. Other interesting lines typical of WR stars are found, e.g. weak bumps around 5140 Å and 4069 Å due to CII and CIII and CIII respectively.
The fact that the combined NIII lines are stronger than the HeII 4686 Å line, suggests that the observed WR stars can be classified as WN8. The detection of CII and CIII at 5140Å, could be interpreted as a signature of early or intermediate WC stars. Hence a mixture of two different WR populations could be present in this region.
Fainter Wolf-Rayet features are found in regions CDT1, CDT4 and CDT5 in NGC 1232. In region CDT1 (see Figure 5, bottom) the NIII 4634, 4640 Å line strengths indicate that the observed WR stars can be classified as WN8. NIII4512, 4528 Å are also detected. The red bump is not clearly observed. Wolf-Rayet feature intensities and equivalent widths are given in Table 8.
4 Functional parameters of the observed HII regions
Three are the fundamental parameters which control the emission line spectra of HII regions (Díaz et al. 1991): the shape of the ionising continuum, the degree of ionisation of the nebula and the abundance of the gas. This has been parametrised by Z which is scaled with solar, Z⊙. Solar element abundances are adopted as defined in Grevesse & Anders (1989) with refractory elements (Fe, Mg, Al, Ca, Na, Ni) depleted by a factor of ten, and Si by a factor of two (Garnett et al. 1995), to take into account the depletion onto dust grains. The adopted solar abundance is then as follows: He/H : -1 ; O/H : -3.08 ; N/H : -3.95 ; S/H : -4.79 ; C/H : -3.44 ; Ne/H : -3.91 ; Ar/H : -5.44 ; Si/H : -4.75 ; Fe/H : -5.33 ; Mg/H : -5.42 ; Al/H : -6.53 ; Ca/H : -6.64 ; Na/H : -6.67 ; Ni/H : -6.75, in the notation 12 + log(A/H). The ionisation parameter – i. e. the ratio of the ionising photon density to the particle density – is a measure of the degree of ionisation of the nebula and can be deduced from the ratio of two lines of the same element corresponding to two different ionisation states, e.g. [OII]/[OIII] or [SII]/[SIII]. Alternatively, it can also be determined from [OII/H] or [SII/H] if the metallicity of the region is known (Díaz 1994). We have derived from the expressions given by Díaz et al. (2000). In all cases the value of U derived from the [OII]/[OIII] ratio is systematically lower than the rest thus implying low effective temperatures for the ionising stars. We have therefore discarded this value and computed U as the mean of the other three. These adopted ionisation parameters – – are also listed in Table 7 and their uncertainty is estimated to be around 0.2 dex.
The shape of the ionising continuum is directly related to the effective temperature of the stars that dominate the radiation field responsible for the ionisation of the nebula and, in photoionisation models with a single ionising star, corresponds to the star effective temperature. A recent version of the photoionisation code CLOUDY (Ferland 1999) has been used to estimate the mean effective temperature of these stars. We have used Mihalas (1972) NLTE single-star stellar atmosphere models, with a plane-parallel geometry and a constant particle density through the nebula. The ionising stars are of solar metallicity and no effects due to line blanketting or stellar winds are taken into account.
The best-fitting models are obtained by using an optimisation method that includes the more intense emission line ratios relative to H. Input parameters are the derived oxygen abundance, electron density and ionisation parameter given in Table 7. The only varying parameter is the stellar effective temperature. For the starting model, the relative abundance ratios are taken to be solar. Once the best fit is obtained, N/O and S/O abundance ratios are varied in order to reconcile, when possible, these ratios with the derived ones. The computed models can be affected by the assumed refractory elements depletion in the high metallicity regime. In particular Si and, to a lesser extent, Fe and Mg can seriously affect the predicted emission line intensities of [OII] 3727Å and [OIII] 5007Å, and consequently, the derived ion-weighted temperatures (Henry 1993). For example, a change in the assumed depletion for Si from 2 to 10 relative to solar, implies an enhancement in the predicted optical forbidden lines of a 50% in the case of region CDT1 in NGC 1637.
We have also used CoStar NLTE single-star stellar atmosphere models (Schaerer 1996) which include line-blanketing effects and mass loss by stellar winds in order to compare the possible differences between the input parameters of Mihalas and CoStar models at a given metallicity, since these models are available only for two metallicities, 0.2Z⊙ and solar. Photoionisation models for a nebula of a given O/H abundance computed using the two different stellar atmosphere sets, which produce the same emission line spectra, have values of ionisation parameters and effective temperature which differ by 0.1 dex and 1000 K respectively.
For most regions, consistency is found for effective temperatures between 34,700 K and 36,600 K. Predicted line intensities and abundances from these single-star photoionisation models, as compared to observations, are given in Table 9 for all the regions in the sample, except for CDT2 and CDT3 in NGC 925, for which no satisfactory fit was found. These regions present serious discrepancies in the observed line intensities in comparison to VZ98 data, and therefore have been excluded from our subsequent analysis.
5 Discussion
5.1 Observed HII regions in NGC 628
The observations of region H13 provide the spectra with the highest signal-to-noise ratio of the whole sample. The auroral line of [SIII] at 6312 Å was already detected and measured by VZ98 and the agreement between our measurements and theirs is excellent (as for the rest of the measured lines) as can be seen from Table 3. We have therefore taken their observed [OII] 3727 Å line intensity in order to perform our abundance analysis. The four measured electron temperatures (see Table 7) are all around 10,000K, except for T(N+) which is slightly lower (9,000K 700). It must be taken into account, however, that the measurement of the [NII]5755 Å line could be affected by the presence of the observed red bump due to Wolf-Rayet stars around 5800 Å. The scheme proposed by Garnett (1992) seems to describe properly the thermal structure of this region. This global isothermal behaviour is perhaps surprising if we consider that prominent features due to Wolf Rayet stars are observed.
Indeed, when comparing both the emission line spectra and the derived chemical abundances of regions H13 and H3 (see Tables 3 and 7), they are found to be nearly identical. In region H13, both standard methods and the S23 parameter provide oxygen abundances of 12 + log(O/H) = 8.24 and 8.20 respectively. As for region H3, VZ98 do not provide the [OII]3727Å line intensity since they analyse regions H3, H4 and H5 taken together. Hence, we have calculated the oxygen abundance from the S23 calibration, which yields a value of 8.23. These values are, at least, 0.5 dex lower than previous ones derived from empirical calibrations based on the optical forbidden lines (VZ98 and references therein). The derived N/O ratios, lower than solar, are consistent with the relatively high excitation shown by these regions. Total and ionic sulphur abundances, calculated for both regions from standard methods, are nearly identical and S/O ratios are found to be lower than solar.
A closer look at the observed line intensities reveals one important difference between H13 and H3; both the [NeIII]3869Å and the [OIII]4363Å line intensities are 2 and 1.6 times lower respectively in region H13. In fact, when comparing our line intensities with those from VZ98 for region H13, we clearly see a complete agreement in all the observed lines except [NeIII]3869Å which is underestimated in our data by nearly 15% (0.06 versus 0.07). This discrepancy is a serious one when attempting to proceed further in the analysis of the Ne2+/O2+ ionic ratio. If we choose our observed value, we obtain log(Ne2+/O2+)=-0.96. If, in turn, we adopt the value given by VZ98, log(Ne2+/O2+)=-0.89, which seems to be more consistent with current observations in other galactic and extragalactic HII regions. This value is very close to the one derived for region H3 (-0.83).
Regarding the [OIII]4363Å, the observed difference in the line intensity for both regions, H13 and H3, yields a difference of nearly 2,000 K in the corresponding mean ion-weighted temperature which translates into a difference of 0.25 dex in the excitation degree given by the O2+/O ratio. Again, we must be cautious about this result since the measurement of this line in region H3 offers less realibility due to the lower signal-to-noise ratio. Hence, from the comparison of both spectra and taking into account the discussed uncertainties, we can conclude that both regions H13 and H3 show similar spectral characteristics and therefore the presence of WR stars in region H13 does not seem to change the global ionisation structure of this region.
We have calculated NLTE single star photoionisation models (Mihalas 1972), assuming a plane-parallel geometry and a constant particle density across the nebula and a gas metallicity, Z, corresponding to the derived O/H abundance. The best fitting models reproduce both the observed emission line spectrum and the O, S and N ionic abundances. The low estimate of the effective temperature in this region confirms our conclusions from the comparison of H13 and H3 spectra, that is, the presence of WR stars in region H13 changes neither the ionisation structure nor the strength of the ionising radiation for the whole emitting volume of the region.
Regions H4 and H5 are in contact with each other and show different excitation conditions from their neighbour region H3. Their observed spectra are less excited than that of region H3, because of the lower photon density that heats these regions. The most interesting feature in their emission line spectra is the low intensity measured for the HeI 5876 Å recombination line which indicates that a large fraction of helium must be in the neutral state, since no HeII lines are observable at all.
In these regions, oxygen abundances have been derived by means of the S23 abundance calibration. Values of 8.31 and 8.34 are found for regions H4 and H5 respectively. These values are close to the ones derived in H3 and H13. Sulphur abundances can be derived by means of the measured T(S2+). Hence, with these measurements, S/O abundance ratios yield values of -1.56 and -1.67 respectively. The latter corresponds to solar within the errors. The former one, if real, must be accounted for although it is plausible that, due to the weakness of the [SIII]6312Å line (0.005 relative to H), the measured T(S2+) would be underestimated.
Single star photoionisation models point to low ionising temperatures of around 34,700 K for these two regions.
Prior to our investigation, there was only one HII region in this galaxy with the oxygen abundance derived from direct measurements of the electron temperature: (+292,-020) (VZ98) which lies well below the oxygen abundance gradient derived by Zaritsky et al. (1994) from the calibration of the oxygen optical lines. Corrections to this calibration on the basis of excitation considerations have been introduced by Pilyugin (2000, 2001) who suggests that central oxygen abundances and, therefore, gradient slopes based on previous, uncorrected calibrations, could be appreciably overestimated. Figure 6 shows the oxygen radial distribution for NGC 628 as deduced from the empirical calibrations by Zaritsky et al.(1994), squares, and Pilyugin (2001), triangles. Our data are also shown, as filled circles together with the datum by VZ98. The three regions for which the oxygen abundances have been derived by the two different calibrations and direct methods are shown as filled symbols, thus allowing a direct comparison. Our data and that of VZ98 are slightly below the trend found by using Pilyugin (2001) calibration which provides a slope flatter than that found with Zaritsky et al. (1994) calibration and providing absolute values for the oxygen abundances lower than theirs by a factor of about 3. Our data then seem to confirm the suspicion that values of abundances for low excitation HII regions might have been severely overestimated.
5.2 Observed HII regions in NGC 1232
Three of the five observed HII regions in NGC 1232: CDT1, CDT3 and CDT4 can be considered as supergiant HII regions, i. e. have H luminosities greater than 1039 erg s-1 (Kennicutt 1983). Ion weighted temperatures have been derived for the three of them. From our analysis, the adopted trend that T(A+)T(S2+) (where A denotes sulphur or nitrogen) in regions with an electron temperature lower than 10,000K (Stasińska 1990, Garnett 1992) seems to be confirmed. Though more reliable observations must be done in order to confirm this trend, it seems that a three-zone model nebula can explain the ionisation structure of these HII regions.
5.2.1 The high metallicity region CDT1
Region CDT1 deserves special attention because of both its high metal content and the presence of Wolf Rayet stars . Derived values for the T(S2+) and T(N+) ion-weighted temperatures for these region are 5400K and 6700K with relative errors of 10% and 8% respectively. This is, to our knowledge, the first time that electron temperatures are measured in a high metallicity extragalactic HII region.
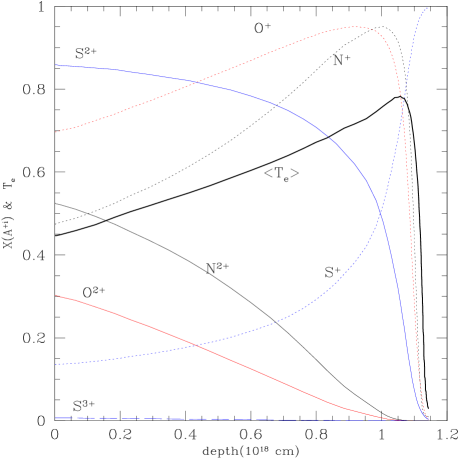
A Mihalas model with Z=Z⊙, Teff=34,900K and logU=-2.85 fits adequately the emission line spectra and total abundance. The ionisation structure of this model is shown in Figure 7 where ionic ratios of O, N and S, together with the average electron temperature, are plotted against nebular geometrical depth. It can be seen from this plot that there is a gradual decrease of the average Te towards the inner part of the nebula. Since, at these low temperatures the O2+ emission is going to take place mostly at IR wavelengths, this could lead, in principle, to a certain underestimation of the O2+ ratio, and therefore of the total O abundance. However, given the low electron temperature of the nebula, most of the oxygen is in the first ionisation state and hence the fraction of O2+ non accounted for would be very small.
In our analysis, T(O2+) has been derived from the observed T(S2+) using Garnett’s (1992) expression under the assumption of no temperature fluctuations, yielding a value of 4500 600 K and hence a derived oxygen abundance of 8.95 0.20, close to the solar value. Also, the derived values for log O23 and log S23 are 0.25 and 0.11 which, according to DPM00, implies solar or oversolar abundances. The N/O ratio is found to be higher than solar by 0.1 dex and, if the above value of O/H is adopted, S/O is lower than solar by about the same factor. However, the value of the O2+/H+ ionic abundance is 12 + log(O2+/H) = 8.63, too high in comparison to what is observed in galactic HII regions (Shaver et al. 1983), where the excitation degree decreases with increasing metallicity, and somewhat in disagreement with the ionisation parameter implied by both the [OII]/[OIII] and [SII]/[SIII] line ratios.
A somewhat independent estimate of the total oxygen abundance can be made under the assumption of a solar S/O ratio and a negligible contribution of S3+ to the total S abundance, which seems to be justified given the low temperatures involved (see Fig. 7). In this case values of 12 + log(O/H) = 8.85 and 12 + log(O2+/H) = 8.40 are found, more in agreement with what is expected from the observed excitation degree. This implies a value of t(O++) = 0.49, slightly higher than that predicted by Garnett’s scheme, but well inside our quoted value. Given that O+/H+ provides a lower limit to the total oxygen abundance, a conservative value of 12 + log(O/H) = 8.85 0.20 can be given.
This region can therefore be considered the first high metallicity HII region for which a reliable total oxygen abundance has been obtained. The fact that a single star model of Teff 35,000K adequately reproduces the emission line spectrum seems to imply that the presence of WR stars is not appreciably affecting the ionisation structure of the region.
5.2.2 Rest of the regions in NGC 1232
Three mean ion-weighted temperatures have been measured in the supergiant HII region CDT3 (see Table 7). The derived oxygen abundance is 12 + log(O/H) = 8.56 which is 0.3 dex lower than the derived value from empirical calibrations (VZ98). The predicted value from the S23 abundance parameter is 8.51, quite consistent with our derived value from standard methods. Total N/O and S/O ratios are solar within the errors. The Ne2+/O2+ ionic ratio is 0.11, slightly lower than the mean value derived for galactic HII regions.
This region also shows the presence of WR stars. Again, single star photoionisation models, yield a low estimate for the effective temperature of the ionising radiation (35,000 K) which is combined with a moderately low ionisation parameter (logU -2.7).
Similar results are obtained for the supergiant HII region CDT4. The derived mean oxygen content range from 8.37, by means of standard methods, to 8.51 by using the S23 abundance parameter. The derived N/O and S/O ratios are solar and oversolar respectively, though this latter one is close to solar when considering the propagated errors. Single-star photoionisation models reproduce satisfactorily the observations with an estimated effective temperature of 35,000 K combined with a moderately low ionisation parameter (logU -2.7).
5.2.3 Abundance gradient in NGC 1232
A similar analysis to that made in NGC 628, can be applied to the observed HII regions in NGC 1232. Up to now, the oxygen abundance has been derived from direct measurements of the electron temperature for only one HII region: (+135,+114) (VZ98) which lies well below the oxygen abundance gradient derived by Zaritsky et al. (1994) from the calibration of the oxygen optical lines. Figure 8 shows the oxygen radial distribution for NGC 1232 where symbols have the same meaning as in Figure 6. Our data and that of VZ98 follow the same trend found by using Pilyugin (2001) calibration which provides in this case a slope similar to that found with Zaritsky et al. (1994) calibration but providing absolute values for the oxygen abundances lower than theirs by a factor of about 3. A discrepancy is found, however, for the derived oxygen abundance in the high metallicity HII region CDT1, which seems to lie between those derived according to both empirical calibrations. Again, our data seem to confirm the suspicion that values of abundances for low excitation HII regions might have been severely overestimated.
5.3 Observed HII regions in NGC 925 and NGC 1637
No auroral forbidden lines could be measured for the four observed HII regions in NGC 925, due to the low signal-to-noise ratio of their spectra, therefore total oxygen abundances were derived from the S23 parameter. Values of 8.52, 8.71, 8.50 and 8.41 are found for regions CDT1, CDT2, CDT3 and CDT4 respectively. These derived abundances must be handled with care since, from the O23-S23 diagnostic diagram, (DPM00), these regions fall near the reversal of the abundance calibration parameter S23. Another source of uncertainty is the large scatter (20%) found between our data and those from VZ98 in the three former regions. These regions are very close to the centre of the galaxy, and hence they are expected to show a large contribution from an old stellar population. This fact is straightforward from the observed spectra as evidenced by the presence of absorption wings in the Balmer lines and the low values of the measured H equivalent widths that range from 6 Å to 47 Å.
Finally, CDT1 in NGC 1637 shows values for log O23 and log S23 of 0.11 and -0.03 respectively. According to these values the metallicity of this region is likely to be oversolar. The detailed modelling shows that a Mihalas model with Z/Z⊙=1.80, Teff=35,000K and logU=-3.10 fits adequately the emission line spectra, except for the near IR [SIII] lines which are overestimated by a factor of 2.
5.4 Global analysis
The analysis of the derived electron temperatures in four of the observed GEHR’s, indicate that, at least in the cases where the global emission from the nebula is considered, the mean ion-weighted temperature of single-ionised atoms (N+ and S+) is higher than that corresponding to twice-ionised species (S2+) for electron temperatures below 10000 K. Given the high signal-to-noise ratio of these spectra, and despite the small sample we are dealing with, it can be inferred that the temperatures in the N+ and S+ dominated zones vary as a function of the S2+ temperature and, therefore, Garnett’s scheme (Garnett 1992) seems to explain consistently the temperature stratification in HII regions. Another important evidence is the measurement in region H13 of four ion-weighted temperatures, showing a mean value of 10000 700 K, which is again consistent with predictions from single star photoionisation models (Garnett 1992).
These results are to be compared with the determination of electron temperatures in other well studied HII regions. On the whole, the situation is not as clear as one can infer from our results. The observed HII regions in NGC 7714 (González- Delgado et al. 1995) and NGC 3310 (Pastoriza et al. 1993) show a higher excitation than the ones in our sample. The temperature stratification in these regions is reversed in the sense that electron temperatures from twice-ionised species are higher than those corresponding to single-ionised atoms. This behaviour can be understood through the dominance of twice-ionised species in the cooling of the nebula. In general, a fair agreement is found between model predictions and these observations, but several discrepancies are found between t(S2+) and t(O2+), specially in NGC 7714. These discrepancies can be explained in terms of the adopted effective collision strengths for sulphur. For example, the measured T(S2+) in regions B and C are 13,300 K and 12,000 K respectively, far above T(O2+) (11,100 K and 10,100 K respectively). With the updated collision strengths from Tayal (1997), their derived T(S2+) would decrease to 11,500 K and 10,600 K. These values would be in good agreement, within the errors, with the ones derived for T(O2+). The same argument can be applied to the Jumbo region in NGC 3310. The measured T(S2+) and T(O2+) are 12,500 K and 10,700 K respectively, but T(S2+) would be lowered to 10,900 K if Tayal values are adopted.
Regarding global abundances, although according to our selection criterion all the observed regions show a high oxygen content (solar or oversolar) as deduced from empirical calibrations based on the optical oxygen forbidden lines, from this work we can conclude that just two of the observed regions can be considered as high metallicity HII regions. One of them, region CDT1 in NGC 1232, constitutes probably the first high metallicity extragalactic HII region for which a direct abundance determination has been derived. Kinkel & Rosa (1994) also reported a solar oxygen content for region S5 in M101. However, they derived electron temperatures for low ionisation species ([NII] and [OII]) since the lack of proper data on the [SIII] 9069, 9532Å lines, precluded an accurate derivation of the [SIII] temperature. As for the other high metallicity HII region, CDT1 in NGC 1637, the oxygen abundance has been derived from detailed modelling and therefore, should be considered less reliable. For the rest of the regions where an electron temperature has been determined, the abundances are at least 0.3 dex lower than previously derived. Our values are in fair agreement with the derived ones from the S23 abundance calibration (DPM00), which seems to be a reliable parameter for abundance determinations up to metallicities of 0.7Z⊙. Hence, two important questions arise from our results: the reliability of derived abundances from empirical calibrations through the oxygen optical forbidden lines and, what seems to be more important, the reliability of the determination of radial abundance gradients in external galaxies, which is based on the previous point.
Figure 9 shows the commonly used diagram of 12+log(O/H) vs logR23. Crosses correspond to HII regions in spiral and irregular galaxies and open circles to HII galaxies. Open triangles correspond to high metallicity HII regions for which a detailed modelling has been performed. Four different calibrations are shown as labelled in the plot. The one by Torres-Peimbert et al. (1989) is fully empirical. That of Edmunds & Pagel (1984) is semiempirical and relies heavily on the model of S5 in M 101 by Shields & Searle (1978). The other two are based on sequences of single star photoionisation models constructed following two different assumptions: the filling factor remains constant and the ionising temperature changes with metallicity (McCall, Rybski & Shields 1985) or conversely, the ionising temperature remains constant while the ionisation parameter varies with metallicity (Dopita & Evans 1986). Those of our data, for which reliable estimates of O/H have been obtained by means of direct measurement of the ion-weighted temperatures, are shown as filled circles (H13 in NGC 628; CDT1, CDT3 and CDT4 in NGC 1232; 74C, 69C and 5N in NGC 4258 (Díaz et al. 2000)). They all fall below the theoretical calibrations and, in particular, the position occupied by region CDT1 in NGC 1232, with a directly derived oxygen abundance, points to a calibration considerably flatter than commonly assumed. All our regions have values of the excitation parameter P= [OIII]4959+5007/R23 (Pilyugin 2001) less than 0.5 and therefore lie on a low excitation sequence. If this is the case for a large fraction of giant extragalactic HII regions, their oxygen abundances may have been rated too high which can have profound implications on the derived gradients. It is clear that more good quality observations of high metallicity regions are necessary in order to clarify this important matter.
The new data presented in this work also provides an improved S23 calibration. All the observed regions of moderately high metallicity lie nicely on the calibration of DPM00. The position of region CDT1 in NGC 1232 seems to indicate that the turnover of the calibration might be around 12+log(O/H) = 8.7 (Fig. 10). Again, more detailed studies of HII regions in this abundance range are needed.
Reliable sulphur abundances have been derived for seven of the observed regions in the sample. Several authors have discussed a possible gradient in S/O from Galactic observations (Simpson & Rubin 1990, Shaver et al. 1983). In the case of extragalactic HII regions, Garnett (1989) conclude, that within the observational errors, S/O remains constant as O/H varies. On the other hand, Díaz et al. (1990) claim that, despite a global constancy within the errors, differences are found from galaxy to galaxy (a negative trend in M33 and a positive one in M101). In our case, it can be inferred that S/O remains constant as O/H varies with a dispersion around the solar value of 0.2 dex (see Fig. 11, left). Anyway it is interesting to note that in regions H13 and H3, with relatively low oxygen abundances (0.2 Z⊙), the S/O abundance ratio seems to be subsolar. The S/O abundance ratio in the high metallicity HII region CDT1 in NGC 1232 has been analysed in detail in section 5.2.1. Clearly, more high spectral resolution observations are needed in order to infer a possible trend in the S/O abundance ratio.
Fig. 11 (right) shows the N/O versus O/H abundance diagram for the regions with the most reliable abundance determinations: H13 in NGC 628, CDT1, CDT3 and CDT4 in NGC 1232. We have also included regions 74C and 69C in NGC 4258 for which similar data were previously analysed (Díaz et al. 2000). Our values are very close to those obtained by Garnett & Shields (1987) for M81 HII regions with similar oxygen content. Region H13 in NGC 628 shows an undersolar value (-1.08 versus -0.87) although larger than the LMC by 0.4 dex (Garnett 2000), which shows a similar oxygen content. On the extreme, region CDT1 in NGC 1232 shows a slightly oversolar value very close to those found for the HII regions in M51. In general, our data follow the global trend of increasing N/O with O/H found in HII regions over galactic discs. The relation between N/O and O/H is difficult to explain once the closed box model for chemical evolution is abandoned. Although in principle, abundance ratios between different elements are a good signature of stellar nucleosynthesis processes, the O/H abundance can be affected by other processes like infall and/or radial outflows of gas. Also, some amount of oxygen may be locked into dust grains thus disappearing from the gas phase, which complicates the interpretation of the observed N/O in terms of stellar yields. Anyway the relatively large value of N/O found for the high metallicity region CDT1 in NGC 1232 seems to imply a certain contribution by secondary nitrogen production.
5.5 Possible evolutionary effects in GEHR’s.
Masegosa (1988) found, from a wide sample
of Giant Extragalactic HII Regions (GEHR) and HII galaxies, an increase
in the
Ne2+/O2+ ionic ratio with decreasing H equivalent width,
i.e., as the ionising cluster turns out to be more evolved,
though there is a non-negligible dispersion in the observed values. This
dispersion, as addressed by her, can be attributed to
evolutionary effects in these regions through the presence of several ionising clusters
with different ages and functional parameters. Furthermore, she found that the
Ne2+/O2+ ionic ratio decreases with increasing O2+/O ratio.
These observations are in complete disagreement with observations in our
Galaxy. Stellar nucleosynthesis theory
predicts both Ne and O to be produced solely by massive stars (M 8M⊙),
hence the ionic ratio should be constant for any oxygen abundance.
Observations of HII regions in both the Milky Way and the
Magellanic Clouds (Peimbert & Costero 1969; Pagel et al. 1978; Simpson
et al. 1995) support this constancy. Furthermore, Henry (1990), from
the study of a wide sample of planetary nebula in the Galaxy, the Magellanic
Clouds and M31, finds a perfect
correlation between Ne and O that holds over a range of more
than an order of magnitude for the abundances of these two elements. These
observations seem to be robust in the sense that planetary nebula are formed from
the ejection of the dying star outer envelope that contains He, C and N. Then, the
observed constancy in the Ne/O ratio implies that intermediate-mass stars
(B stars) neither produce nor destroy significant amounts of neon and oxygen
during their evolution through the HR diagram. Hence this
analysis could explain why galactic HII regions show a constant
Ne/O ratio as only a few OB stars, with the same properties,
are required to ionise these regions.
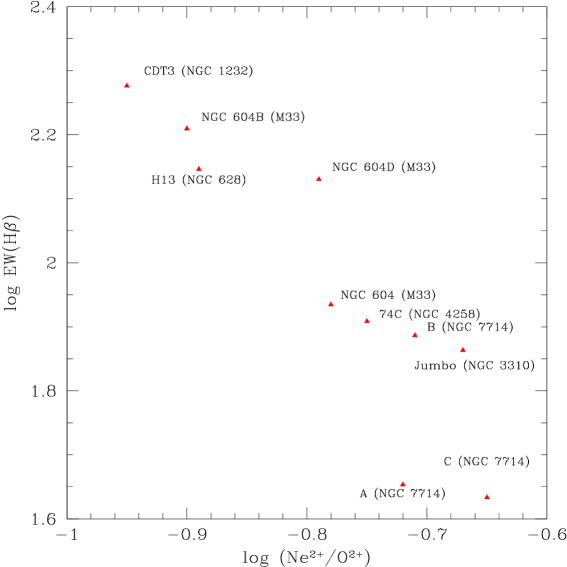
We have plotted the H equivalent width versus the Ne2+/O2+ ionic ratio (Figure 12) for a sample of well studied GEHR’s with Wolf-Rayet stars embedded in them. Evolutionary effects are readily apparent in NGC 604 (M33) (see Díaz et al. 1987). We can see a 0.2-0.3 dex difference in the observed EW(H) values between the individual ionising clusters (604-B and 604-D) and the full aperture integrated region (604). As for log(Ne2+/O2+), there is a 0.1 dex and 0.02 dex difference between the integrated spectrum and 604B, 604D respectively. Finally, the derived oxygen abundance for the whole NGC 604 region differs in 0.1 dex from both individual regions. Hence, a non-negligible difference is found between the individual regions and the fully integrated spectra. Figure 12 shows an increase in the Ne2+/O2+ ionic ratio with decreasing H equivalent width, as Masegosa found for her sample. But, the main problem is that we cannot ensure that either the observed regions in the sample are individual regions (i.e. ionised by a single star cluster) or can be considered representative of the whole emitting volume. Moreover, it could be possible to sample partial contributions from different regions (i.e. star clusters). All these possible combinations would yield different values for the EW(H), and the slope in the diagram would change. It is apparent that the EW(H) can produce misleading trends when used as a diagnostic indicator. As for the ionic ratio, the inferred difference of 0.1 dex in the log(Ne2+/O2+) ratio between 604B and NGC 604 cannot be considered significative within the observational errors.
The problem would be solved if we could observe each ionising cluster separately. In this case, each one could be treated as a single galactic HII region, and the derived properties would be single-valued. This cannot be achieved until high spatial resolution spectroscopy is performed in a significant number of GEHR’s.
6 Summary and conclusions
We have made long-slit spectrophotometric observations in the optical and near infrared of 14 HII regions in different spiral galaxies (NGC 628, NGC 925, NGC 1232 and NGC 1637). For all the sample, a relatively high oxygen abundance (solar or oversolar) has been reported in the literature (VZ98) as deduced from empirical calibrations based on the optical oxygen forbidden lines. These spectrophotometric observations were performed with a wide spectral coverage and at a resolution high enough to detect and measure both weak auroral forbidden lines and Wolf-Rayet features. Electron temperatures have been derived in order to investigate the ionisation structure and to derive the chemical composition of the gas in these regions.
For seven of the observed regions, H13, H3, H4, H5 (NGC 628); CDT1, CDT3 and CDT4 (NGC 1232), we have been able to measure reliable electron temperatures from different nebular to auroral line intensity ratios, which allows the derivation of accurate abundances following standard methods. In particular, the metallicities found for these regions (except CDT1 in NGC 1232), previously reported to be close to solar, are found to be lower by factors between 0.2 and 0.5 dex, the latter in the case of H13 and H3. For the rest of the regions both an empirical calibration based on the sulphur emission lines and detailed modelling has been used to determine a mean oxygen content.
In the case of CDT1 (NGC 1232), it is the first time that it has been possible to derive, in a consistent manner, the mean oxygen content in a high metallicity HII region following standard methods. The derived value is 12 + log(O/H) = 8.95, though a conservative value of 8.85 can be adopted under ionisation structure considerations. This region, together with one observed in NGC 1637 (CDT1) (its oxygen abundance derived from detailed modelling), are the only two regions in the sample that can be considered as of high metallicity.
Our data and those from different empirical calibrations are compared in order to investigate the radial abundance gradients in NGC 628 and NGC 1232. It can be inferred from this analysis that, except for Pilyugin’s calibration (Pilyugin 2000), which is in fair agreement with our observed values, all of the others overestimate, by a factor of about 3, the oxygen abundances in relatively low excitation HII regions.
Our observational results show a mean S/O abundance ratio of 0.2 dex around the solar value. Nevertheless, it is important to stress that both regions H13 and H3 (NGC 628) show a subsolar S/O abundance ratio. Regarding the high metallicity region CDT1 in NGC 1232, a solar S/O abundance ratio is found, and this value must be considered an upper limit for this abundance ratio. This result seems to support the trends, previously found by Díaz et al. (1991) from detailed modelling for the observed high metallicity HII regions in M51. Regarding the N/O abundance ratio, all the observed regions show undersolar or solar values within the errors, except CDT1 (NGC 1232) where a direct value of -0.81 is obtained implying a secondary contribution of nitrogen as metallicity increases.
In the four observed GEHR’s (H13, CDT1, CDT3 and CDT4), ion-weighted temperatures have been derived from different auroral to nebular line ratios. Our results show that mean ion-weighted temperatures from single-ionised atoms (N+ and S+) are higher than those corresponding to twice-ionised species (S2+) for electron temperatures below 10,000 K. The derived values are in excellent agreement with predictions from single-star photoionisation models (Garnett 1992). In the case of region H13, the mean value of the four measured electron temperatures is 10,000 700 K, and, again, models predict this isothermal behaviour at 10,000 K. Moreover, by adopting the new effective collision strengths from Tayal (1997), several important discrepancies between T(S2+) and T(O2+) in other well studied GEHR’s can be successfully removed. Therefore, Garnett’s three-zone model nebula (Garnett 1992) seems to explain consistently the temperature stratification in HII regions.
Wolf-Rayet features have been detected in the four observed GEHR’s, and are specially prominent in region H13. In this case, when comparing both the emission line spectra and the inferred abundances with those derived in the nearby region H3, it is confirmed that they closely resemble each other, despite the presence of Wolf-Rayet stars in region H13. From this result, it can be concluded that the presence of WR stars in this region does not alter its ionisation structure. This fact can be understood in terms of the low derived value for the WR/O star ratio (Castellanos et al. 2001, Paper II, in preparation). Another fact that supports the previous conclusion is the isothermal behaviour observed in H13.
From the calculation of single-star photoionisation models, one striking result is the derived constancy for the mean effective temperature of the ionising clusters in the four observed GEHR’s, with a value around 35,000 K (Mihalas models). This result is remarkable given the scatter in the derived metal abundances and Wolf-Rayet properties for the observed GEHR’s.
Acknowledgements
We thank Bernard Pagel for his suggestions which significantly improved the content of the paper as well as an anonymous referee for many useful comments. The WHT is operated in the island of La Palma by the Issac Newton Group in the Spanish Observatorio del Roque de los Muchachos of the Instituto de Astrofísica de Canarias. We would like to thank CAT for awarding observing time.
E.T. is grateful to an IBERDROLA Visiting Professorship to UAM during which part of this work was completed. This work has been partially supported by DGICYT project PB-96-052.
References
- [] Aller L.H., 1984, Physics of thermal gaseous nebula (D. Reidel Publishing Company, Dordrecht)
- [] Belley J., Roy J.-R., 1992, ApJS, 78, 61
- [] Benjamin R.A., Skillman E.D., Smits D.P., 1999, ApJ, 514, 307
- [] Bresolin F., Kennicutt R.C., Garnett D.R., 1999, ApJ, 510, 104
- [] Brocklehurst M., 1971, MNRAS, 153, 471
- [] Castellanos M., Díaz A.I., Terlevich E., (Paper II) 2001 , MNRAS (in preparation)
- [] Conti P.S., Leep E.M., Perry D.N., 1983, ApJ, 268, 228
- [] Díaz A.I., 1989, in Evolutionary Phenomena in Galaxies, Cambridge and New York, Cambridge University Press, p. 377-397
- [] Díaz A.I., 1994, in Violent Star Formation: From 30 Doradus to Quasars, Ed. G. Tenorio-Tagle (Cambridge University Press), p. 105
- [] Díaz A.I., 1999, Ap&SS, 263, 143.
- [] Díaz A.I., Pérez Montero E., 2000, MNRAS, 312, 130 (DPM00)
- [] Díaz A.I., Terlevich E., Pagel B.E.J., Vílchez J.M., Edmunds M.G., 1987, MNRAS, 226, 19
- [] Díaz A.I., Terlevich E., Vílchez J.M., Pagel B.E.J., Edmunds M.G., 1991, MNRAS, 253, 245
- [] Díaz A.I., Castellanos M., Terlevich E., García-Vargas M.L., 2000, MNRAS, 318, 462
- [] Dopita M.A., Evans I.N., 1986, ApJ, 307, 431
- [] Edmunds M.G., Pagel B.E.J., 1984, MNRAS, 211, 507
- [] Ferguson A.M.N., Gallagher J.S., Wyse R.F.G., 1998, AJ, 116, 673
- [] Ferland G.J., 1999, HAZY: A Brief Introduction To CLOUDY. Univ. Kentucky internal report
- [] García-Vargas M.L., Díaz A.I., 1994, ApJS, 91, 553
- [] García-Vargas M.L., Bressan A., Díaz A.I., 1995, A&ASS, 112, 35
- [] Garnett D.R., Shields G.A., 1987, ApJ, 317, 82
- [] Garnett D.R., 1989, ApJ, 345, 282
- [] Garnett D.R., 1992, AJ, 103, 1330
- [] Garnett D.R., Dufour R.J., Peimbert M., Torres-Peimbert S., Shields G.A., Skillman E.D., Terlevich E., Terlevich R. J., 1995, ApJ, 449, 77
- [] Garnett D.R., 2000, in IAU Symp. 190, New Views of the Magellanic Clouds, ed. Y.-H. Chu, N. B. Suntzeff, J. E. Hesser, & D. A. Bohlender (San Francisco: ASP), 266
- [] González-Delgado R.M., Perez E., Díaz A.I., García-Vargas M.L., Terlevich E., Vílchez J.M., 1995, ApJ, 439, 604
- [] Grevesse N., Anders E. 1989, in AIP Conf. Proc. 183, Cosmic Abundances of Matter, ed. C. J. Waddington (New York: AIP), 1
- [] Henry R.B.C., 1990, ApJ, 356, 229
- [] Henry R.B.C., 1993, MNRAS, 261, 306
- [] Kinkel U., Rosa M.R., 1994, A&A, 282, 37
- [] Hodge P.W., 1976, ApJ, 205, 728
- [] Kennicutt R.C., 1983, A&A, 120, 219
- [] Kunth D., Sargent W.L.W., 1983, ApJ, 273, 81
- [] Lundstrom I., Stenholm B., 1984, A&AS, 56, 43
- [] Maeder A., 1990, A&AS, 84, 139
- [] Martin P., Roy J.R., 1994, ApJ, 424, 599
- [] Masegosa J., 1988, Ph.D. Thesis, Granada University, Spain.
- [] McCall M.L., Rybski P.M., Shields G.A., 1985, ApJS, 57, 1
- [] McGaugh S.S., 1991, ApJ, 380, 140
- [] Mendoza C., Zeippen C.J., 1983, MNRAS, 202, 981
- [] Mihalas D.,1972, ApJ, 177, 115
- [] Oke J.B., 1990, AJ, 99, 1621
- [] Osterbrock D.E., 1989, Astrophysics of Gaseous Nebulae and Active Galactic Nuclei (Mill Valley: University Science Books)
- [] Pagel B.E.J., Edmunds M.G., Fosbury R.A.E., Webster B.L., 1978, MNRAS, 184, 569
- [] Pagel B.E.J., Edmunds M.G., Blackwell D.E., Chun M.S., Smith G., 1979, MNRAS, 189, 95
- [] Pagel B.E.J., Simonson E.A., Terlevich R.J., Edmunds M.G., 1992, MNRAS, 255, 325
- [] Pastoriza M.G., Dottori H.A., Terlevich E., Terlevich R., Díaz A.I. 1993, MNRAS, 260, 177
- [] Peimbert M., Costero R., 1969, Bol. Obs. Tonantzintla y Tacubaya, 5, 3
- [] Pilyugin L.S., 2000, A&A, 362, 325
- [] Pilyugin L.S., 2001, A&A, 369, 594
- [] Ryder S.D., Dopita M.A., 1993, ApJS, 88, 415
- [] Sandage A., Tammann G., 1981, A Revised Shapley-Ames Catalog of Bright Galaxies, p. 42
- [] Schaerer D., 1996, A&A, 309, 129
- [] Sharina M.E., Karachentsev I.D., Tikhonov N.A., 1996, A&AS, 119, 499
- [] Shaver P.A., McGee R.X., Newton L.M., Danks A.C., Pottasch S.R., 1983, MNRAS, 204, 53
- [] Shields G.A., Searle, L., 1978, ApJ, 222, 821
- [] Silbermann N.A., et al., 1996, ApJ, 470, 1
- [] Simpson J.P., Rubin R.H., 1990, ApJ, 354, 165
- [] Simpson J.P., Colgan S.W.J., Rubin R.H., Erickson E.F., Haas M.R., 1995, ApJ, 444, 721
- [] Sohn Y-J., Davidge T.J., 1998, AJ, 115, 130
- [] Stasińska G., 1980, A&A, 84, 320
- [] Stasińska G., 1990, A&AS, 83, 501
- [] Tayal S.S., 1997, ApJ, 481, 550
- [] Torres-Peimbert S., Peimbert M., Fierro J., 1989, ApJ, 345, 186
- [] Van Zee L., Salzer J.J., Haynes M.P., O’Donoghue A.A., Balonek T.J., 1998, AJ, 116, 2805 (VZ98)
- [] Van Zee L., Salzer J.J., Haynes M.P., 1998, ApJ, 497, 1
- [] Vaucouleurs G.,de, et al., 1991, Third Reference Catalogue of Bright Galaxies, Austin, Texas (RC3)
- [] Vila-Costas M.B., Edmunds M.G., 1992, MNRAS, 259, 121
- [] Zaritsky D., Kennicutt R.C., Huchra J.P., 1994, ApJ, 420, 87


| Property | NGC 628 | NGC 925 | NGC 1232 | NGC 1637 |
| Type | .SAS5 | .SXS7 | .SXT5 | .SXT5 |
| Distance (Mpc) | 7.3 | 8.6 | 21.5 | 7.8 |
| MB 111NGC 628, Sharina et al. (1996); NGC 925 and NGC 1637, Sohn & Davidge (1998); NGC 1232, (RC3) | -19.5 | -21.07 | -21.2 | -19.72 |
| i () | 25 | 58 | 30 | 36 |
| R25 (′′) | 314 | 314 | 222 | 120 |
| Galaxy | P.A. (°)222All the observations made on 1999 November 8/9 | Slit position333E-W, N-S | Grating | range (Å) | Exposure (s) | Mean airmass (sec z) |
|---|---|---|---|---|---|---|
| NGC 628 | 38 | (-086,+186) | R300B | 3800-7200 | 21800+11200 | 1.050 |
| 38 | R600R | 8840-9650 | 21800+11200 | |||
| NGC 925 | 103 | (-008,+000) | R300B | 3800-7200 | 21200 | 1.896 |
| 103 | R600R | 8840-9650 | 21200 | |||
| NGC 1232 | 357 | (+059,+078) | R300B | 3800-7200 | 21800 | 1.547 |
| 357 | R600R | 8840-9650 | 21800 | |||
| 78 | (+004,-101) | R300B | 3800-7200 | 11800+11200 | 1.596 | |
| 78 | R600R | 8840-9650 | 11800+11200 | |||
| 52 | (+021,+091) | R300B | 3800-7200 | 21200 | 1.894 | |
| 52 | R600R | 8840-9650 | 21200 | |||
| NGC 1637 | 24 | (+047,-031) | R300B | 3800-7200 | 1800 | 1.504 |
| 24 | R600R | 8840-9650 | 1800 | |||
| GD 50 (standard) | R300B | 3800-7200 | 600 | 1.298 | ||
| R600R | 8840-9650 | 1200 | ||||
| HD 93521 (standard) | R300B | 3800-7200 | 2 | 1.190 | ||
| R600R | 8840-9650 | 60 | ||||
| Feige 34 (standard) | R300B | 3800-7200 | 60 | 1.150 | ||
| R600R | 8840-9650 | 600 | ||||
| HD 93521 (standard) | R300B | 3800-7200 | 2 | 1.115 | ||
| R600R | 8840-9650 | 60 |
| Region | H13 (-085,+193) | H3 (-068,+214) | H4 (-066,+217) | H5 (-064, +218) | |
|---|---|---|---|---|---|
| Line | |||||
| 3727 (VZ98) | [OII] | 2960 110 | – | – | – |
| 3835 | H9+HeII | 52 2 | – | – | – |
| 3869 | [NeIII] | 60 8 | 92 11 | – | – |
| 3869 (VZ98) | [NeIII] | 70 3 | – | – | – |
| 3888 | H8+HeI | 157 5 | 161 10 | 131 7 | 143 9 |
| 3970 | [NeIII]+H | 156 2 | 177 6 | 113 4 | 126 4 |
| 4068 | [SII] | 17 2 | – | – | – |
| 4076 | [SII] | 12 1 | – | – | – |
| 4102 | H | 246 10 | 221 5 | 215 7 | 208 8 |
| 4340 | H | 458 8 | 462 7 | 427 15 | 430 10 |
| 4363 | [OIII] | 10 2 | 16 2 | – | – |
| 4471 | HeI | 44 1 | 36 1 | – | – |
| 4658 | [FeIII] | 8 1 | – | – | – |
| 4711 | [ArIV] | 3 1 | – | – | – |
| 4861 | H | 1000 20 | 1000 10 | 1000 30 | 1000 30 |
| 4881 | [FeIII] | 3 1 | – | – | – |
| 4922 | HeI | 7 1 | – | – | – |
| 4959 | [OIII] | 526 5 | 510 6 | 166 4 | 175 4 |
| 4987 | [FeIII] | 7 1 | – | – | – |
| 5007 | [OIII] | 1547 10 | 1596 12 | 488 8 | 519 8 |
| 4959+5007 | [OIII] | 2073 15 | – | – | – |
| 4959+5007 (VZ98) | [OIII] | 2068 45 | – | – | – |
| 5012 | HeI | 26 1 | – | 21 2 | 22 2 |
| 5200 | [NI] | 6 1 | 14 1 | 14 1 | 11 1 |
| 5517 | [ClIII] | 4 1 | – | – | – |
| 5537 | [ClIII] | 5 1 | – | – | – |
| 5755 | [NII] | 5 1 | – | – | – |
| 5876 | HeI | 98 8 | 103 3 | 46 4 | 45 3 |
| 6300 | [OI] | 18 1 | 38 4 | 26 3 | 30 5 |
| 6300 (VZ98) | [OI] | 18 1 | – | – | – |
| 6312 | [SIII] | 12 1 | 11 1 | 5 1 | 7 2 |
| 6312 (VZ98) | [SIII] | 10 1 | – | – | – |
| 6364 | [OI] | 6 1 | 9 2 | – | – |
| 6548 | [NII] | 160 3 | 162 6 | 205 15 | 205 17 |
| 6563 | H | 2860 30 | 2860 100 | 2880 180 | 2870 170 |
| 6584 | [NII] | 496 8 | 470 20 | 603 40 | 603 43 |
| 6548+6584 | [NII] | 656 11 | – | – | – |
| 6548+6584 (VZ98) | [NII] | 686 24 | – | – | – |
| 6678 | HeI | 27 2 | 26 2 | 19 2 | 18 2 |
| 6717 | [SII] | 204 5 | 270 13 | 309 20 | 333 24 |
| 6731 | [SII] | 151 4 | 186 9 | 215 15 | 227 17 |
| 6717+6731 | [SII] | 355 9 | – | – | – |
| 6717+6731 (VZ98) | [SII] | 360 12 | – | – | – |
| 7065 | HeI | 17 2 | – | – | – |
| 8863 | P11 | 8 2 | 9 2 | 10 2 | 11 1 |
| 9014 | P10 | 11 3 | 12 3 | 13 2 | 15 2 |
| 9069 | [SIII] | 168 10 | 136 10 | 147 12 | 149 10 |
| 9229 | P9 | 26 1 | 24 2 | 26 1 | 26 2 |
| 9532 | [SIII] | 374 15 | 351 25 | 385 23 | 399 20 |
| 9546 | P8 | 34 2 | 37 3 | 38 2 | 34 3 |
| c(H) | 0.29 0.01 | 0.44 0.01 | 0.48 0.03 | 0.47 0.03 | |
| F(H) 44410-16 erg cm-2 s-1, corrected for reddening | 1039 | 187 | 109 | 126 | |
| EW(H)(Å) | 140 | 231 | 207 | 215 | |
| EW(H)(Å) (VZ98) | 152 | – | – | – |
| Region | CDT1 (+059,+058) | CDT2 (+057,+098) | CDT3 (+004,-101) | CDT4 (+021,+091) | CDT5 (-019,+060) | |
|---|---|---|---|---|---|---|
| Line | ||||||
| 3727 (VZ98) | [OII] | 1490 70 | 4180 220 | 3180 150 | 2530 120 | – |
| 3869 | [NeIII] | – | – | 25 3 | – | – |
| 3888 | H8+HeI | 128 5 | – | 92 4 | 187 10 | – |
| 3970 | [NeIII]+H | 128 4 | – | 96 5 | 217 10 | 231 3 |
| 4068,76 | [SII] | 48 6 | ||||
| 4102 | H | 242 6 | 256 16 | 184 7 | 268 5 | 261 5 |
| 4340 | H | 470 7 | 510 20 | 374 10 | 466 7 | 489 15 |
| 4471 | HeI | 19 1 | 65 1 | 32 2 | 37 3 | – |
| 4861 | H | 1000 20 | 1000 20 | 1000 12 | 1000 10 | 1000 20 |
| 4922 | HeI | – | – | 7 1 | 10 2 | – |
| 4959 | [OIII] | 77 2 | 456 8 | 284 6 | 393 3 | 63 2 |
| 4987 | [FeIII] | – | – | 6 2 | – | – |
| 5007 | [OIII] | 229 4 | 1350 20 | 842 13 | 1162 8 | 200 4 |
| 4959+5007 | [OIII] | 306 6 | 1806 28 | 1126 19 | 1555 11 | 263 6 |
| 4959+5007 (VZ98) | [OIII] | 300 10 | 1590 55 | 979 30 | 1349 41 | – |
| 5012 | HeI | 10 1 | – | 24 2 | 17 1 | – |
| 5200 | [NI] | 18 1 | – | 22 2 | 41 2 | – |
| 5755 | [NII] | 4 1 | – | 8 2 | 8 1 | – |
| 5876 | HeI | 84 2 | 75 8 | 120 6 | 122 5 | 77 2 |
| 6300 | [OI] | 25 2 | 111 15 | 43 3 | 35 4 | 30 5 |
| 6300 (VZ98) | [OI] | 19 1 | 131 9 | 45 2 | 32 2 | – |
| 6312 | [SIII] | 2 1 | – | 8 2 | 13 2 | – |
| 6312 (VZ98) | [SIII] | 2 1 | 18 5 | 7 1 | 7 1 | – |
| 6364 | [OI] | 9 1 | – | 15 2 | 11 2 | – |
| 6548 | [NII] | 328 8 | 231 15 | 290 10 | 252 14 | 293 18 |
| 6563 | H | 2870 50 | 2870 100 | 2870 150 | 2870 20 | 2870 90 |
| 6584 | [NII] | 1040 21 | 717 30 | 892 30 | 758 40 | 961 40 |
| 6548+6584 | [NII] | 1368 29 | 948 45 | 1182 40 | 1010 54 | 1254 58 |
| 6548+6584 (VZ98) | [NII] | 1349 54 | 1030 42 | 1203 48 | 1018 41 | – |
| 6678 | HeI | 19 1 | – | 31 3 | 29 4 | – |
| 6717 | [SII] | 357 8 | 537 15 | 333 10 | 307 20 | 400 14 |
| 6731 | [SII] | 274 6 | 372 10 | 272 9 | 233 15 | 295 10 |
| 6717+6731 | [SII] | 631 14 | 909 25 | 605 19 | 540 35 | 695 24 |
| 6717+6731 (VZ98) | [SII] | 663 25 | 1028 42 | 728 27 | 580 21 | – |
| 8863 | P11 | – | – | 14 2 | 14 4 | – |
| 9014 | P10 | – | – | 19 3 | 19 4 | – |
| 9069 | [SIII] | 197 13 | 191 15 | 229 10 | 249 10 | – |
| 9229 | P9 | 24 2 | – | 26 2 | 25 3 | – |
| 9532 | [SIII] | 455 34 | 535 40 | 614 30 | 665 20 | – |
| 9546 | P8 | 37 2 | – | 30 6 | 34 3 | – |
| c(H) | 0.25 0.01 | 0.32 0.01 | 0.32 0.03 | 0.62 0.02 | 0.31 0.02 | |
| F(H) 55510-16 erg cm-2 s-1, corrected for reddening | 376 | 41 | 767 | 871 | 114 | |
| EW(H)(Å) | 48 | 84 | 189 | 138 | 63 | |
| EW(H)(Å) (VZ98) | 63 | 86 | 191 | 113 | – |
| Region | CDT1 (-008,+000) | CDT2 (-005,+000) | CDT3 (+010,-004) | CDT4 (+042,-011) | |
|---|---|---|---|---|---|
| Line | |||||
| 3727 (VZ98) | [OII] | 2880 110 | 2370 90 | 2940 120 | 2820 120 |
| 3888 | H8+HeI | 177 12 | – | – | – |
| 3970 | [NeIII]+H | 134 6 | – | – | 150 17 |
| 4102 | H | 215 20 | – | – | 256 20 |
| 4340 | H | 479 23 | 430 20 | 468 40 | 463 9 |
| 4861 | H | 1000 13 | 1000 20 | 1000 60 | 1000 16 |
| 4959 | [OIII] | 301 7 | 322 12 | 315 13 | 239 4 |
| 5007 | [OIII] | 849 14 | 892 24 | 967 36 | 737 10 |
| 4959+5007 | [OIII] | 1150 21 | 1214 36 | 1282 49 | 976 14 |
| 4959+5007 (VZ98) | [OIII] | 915 23 | 698 19 | 826 24 | 1275 35 |
| 5200 | [NI] | – | – | – | 36 4 |
| 5876 | HeI | – | – | – | 64 2 |
| 6300 | [OI] | 41 4 | 94 9 | 90 10 | 39 2 |
| 6300 (VZ98) | [OI] | 43 4 | – | 59 5 | – |
| 6548 | [NII] | 203 11 | 280 20 | 242 18 | 196 7 |
| 6563 | H | 2800 130 | 2890 190 | 2880 190 | 2850 80 |
| 6584 | [NII] | 568 28 | 723 40 | 661 30 | 593 18 |
| 6548+6584 | [NII] | 771 39 | 1003 60 | 903 48 | 789 25 |
| 6548+6584 (VZ98) | [NII] | 866 32 | 899 34 | 919 35 | 758 30 |
| 6678 | HeI | 28 3 | 16: | – | 25 2 |
| 6717 | [SII] | 577 30 | 787 40 | 672 30 | 437 15 |
| 6731 | [SII] | 391 20 | 498 25 | 449 22 | 298 11 |
| 6717+6731 | [SII] | 968 50 | 1285 65 | 1121 52 | 735 26 |
| 6717+6731 (VZ98) | [SII] | 873 30 | 931 32 | 945 34 | 751 29 |
| 9069 | [SIII] | 125 9 | 198 15 | 83 15 | 160 10 |
| 9229 | P9 | – | – | – | 28 3 |
| 9532 | [SIII] | 359 25 | 480 30 | 222 30 | 342 25 |
| c(H) | 0: | 0.23 0.03 | 0.19 0.02 | 0.32 0.01 | |
| F(H) 66610-16 erg cm-2 s-1, corrected for reddening | 103 | 66 | 93 | 143 | |
| EW(H)(Å) | 22 | 6 | 15 | 47 | |
| EW(H)(Å) (VZ98) | 17 | 13 | 15 | 44 |
| Region | CDT1 (+047,-031) | |
| Line | ||
| 3727 (VZ98) | [OII] | 1170 60 |
| 4102 | H | 220 10 |
| 4340 | H | 455 7 |
| 4861 | H | 1000 10 |
| 4959 | [OIII] | 29 2 |
| 5007 | [OIII] | 84 10 |
| 4959+5007 | [OIII] | 113 12 |
| 4959+5007 (VZ98) | [OIII] | 137 7 |
| 5876 | HeI | 71 10 |
| 6300 | [OI] | 32 6 |
| 6548 | [NII] | 315 22 |
| 6563 | H | 2840 30 |
| 6584 | [NII] | 1037 60 |
| 6548+6584 | [NII] | 1352 82 |
| 6548+6584 (VZ98) | [NII] | 1304 54 |
| 6717 | [SII] | 335 20 |
| 6731 | [SII] | 249 15 |
| 6717+6731 | [SII] | 584 35 |
| 6717+6731 (VZ98) | [SII] | 534 21 |
| 9069 | [SIII] | 99 9 |
| 9532 | [SIII] | 247 15 |
| c(H) | 0.52 0.02 | |
| F(H) 77710-16 erg cm-2 s-1, corrected for reddening | 243 | |
| EW(H)(Å) | 74 | |
| EW(H)(Å) (VZ98) | 76 |
| NGC 628 | |||||
|---|---|---|---|---|---|
| Parameter | H13 | H3 | H4 | H5 | |
| ne | 80 | 40 | 40 | 40 | |
| log U | -2.78 0.10 | -2.92 0.15 | -2.95 0.15 | -2.97 0.15 | |
| t(S2+) | 1.02 0.03 | 1.03 0.05 | 0.74 0.04 | 0.82 0.06 | |
| t(O2+) | 0.98 0.05 | 1.17 0.10 | 0.69 | 0.79 | |
| t(S | 0.99 0.06 | – | – | – | |
| t(N | 0.90 0.06 | – | – | – | |
| t(O | 0.99 | 1.10 | 0.79 | 0.85 | |
| 12 + log(O2+/H+) | 7.77 0.07 | 7.53 0.10 | 7.89 0.13 | 7.66 0.15 | |
| 12 + log(O+/H+) | 8.06 0.09 | 8.14 0.16 | 8.10 0.15 | 8.24 0.15 | |
| 12 + log(O/H) | 8.24 0.08 | 8.23 0.15 | 8.31 0.15 | 8.34 0.15 | |
| 12 + log(S2+/H+) | 6.25 0.02 | 6.20 0.03 | 6.52 0.04 | 6.43 0.05 | |
| 12 + log(S+/H+) | 5.91 0.05 | 5.92 0.06 | 6.35 0.05 | 6.29 0.05 | |
| 12 + log(S/H) | 6.41 0.04 | 6.38 0.05 | 6.75 0.04 | 6.67 0.05 | |
| log(N/O) | -1.08 0.04 | -1.14 0.10 | -0.94 0.10 | -1.07 0.10 | |
| log(S/O) | -1.83 0.04 | -1.85 0.11 | -1.56 0.11 | -1.67 0.10 | |
| log(Ne2+/O2+) | -0.89 0.04 | -0.83 0.04 | – | – | |
| He+/H+ | 0.077 0.005 | 0.074 0.005 | – | – | |
| ICF(He) | 1.19 | 1.25 | – | – | |
| He/H | 0.093 0.006 | 0.093 0.006 | – | – | |
| NGC 1232 | |||||
| Parameter | CDT1 | CDT2 | CDT3 | CDT4 | |
| ne | 130 | 40 | 223 | 118 | |
| log U | -2.95 0.20 | -2.95 0.15 | -2.72 0.10 | -2.72 0.10 | |
| t(S2+) | 0.54 0.05 | – | 0.74 0.05 | 0.87 0.04 | |
| t(O2+) | 0.45 | – | 0.69 | 0.84 | |
| t(S | – | – | 0.90 0.06 | – | |
| t(N | 0.67 0.05 | – | 0.86 0.06 | 0.90 0.06 | |
| t(O | 0.62 | – | 0.79 | 0.89 | |
| – | 0.81 | – | – | ||
| 12 + log(O2+/H+) | 8.63 0.30 | 8.03 | 8.13 0.15 | 7.90 0.10 | |
| 12 + log(O+/H+) | 8.66 0.12 | 8.46 | 8.37 0.12 | 8.20 0.13 | |
| 12 + log(O/H) | 8.95 0.20 | 8.61 0.15 | 8.56 0.14 | 8.37 0.12 | |
| 12 + log(S2+/H+) | 6.97 0.09 | 6.53 | 6.72 0.06 | 6.60 0.04 | |
| 12 + log(S+/H+) | 6.67 0.11 | 6.47 | 6.30 0.11 | 6.21 0.06 | |
| 12 + log(S/H) | 7.14 0.10 | 6.80 | 6.86 0.07 | 6.75 0.05 | |
| log(N/O) | -0.81 0.08 | -1.15 | -0.96 0.04 | -0.91 0.06 | |
| log(S/O) | -1.81 0.10 | -1.81 | -1.70 0.07 | -1.62 0.07 | |
| log(Ne2+/O2+) | – | – | -0.95 0.05 | – | |
| He+/H+ | 0.052 0.012 | – | 0.077 0.005 | 0.077 0.005 | |
| ICF(He) | 1.15 | – | 1.19 | 1.20 | |
| He/H | 0.060 0.014 | – | 0.092 0.006 | 0.093 0.006 | |
| NGC 925 and NGC 1637 | |||||
| Parameter | CDT1 | CDT2 | CDT3 | CDT4 | CDT1 (NGC 1637) |
| ne | 40 | 40 | 40 | 40 | 100 |
| log U | -3.00 0.30 | -3.26 0.20 | -3.30 0.20 | -3.00 0.25 | -3.30 0.20 |
| 0.86 | 0.76 | 0.87 | 0.93 | 0.40 | |
| 12 + log(O2+/H+) | 7.73 | 7.97 | 7.75 | 7.52 | 8.57 |
| 12 + log(O+/H+) | 8.44 | 8.62 | 8.41 | 8.35 | 8.94 |
| 12 + log(O/H) | 8.52 | 8.71 | 8.50 | 8.41 | 9.10 |
| 12 + log(S2+/H+) | 6.32 | 6.55 | – | 6.28 | 6.80 |
| 12 + log(S+/H+) | 6.45 | 6.67 | 6.51 | 6.27 | 6.86 |
| 12 + log(S/H) | 6.69 | 6.91 | – | 6.58 | 7.13 |
| log(N/O) | -1.07 | – | – | -1.01 | -0.88 |
| log(S/O) | -1.83 | -1.80 | – | -1.83 | -1.97 |
| Region | L(WR)/H | EW(WR)(Å ) | L(HeII)/H | EW(HeII)(Å ) |
|---|---|---|---|---|
| Region H13 (NGC 628) | 0.08 | 8.9 | 0.04 | 4.8 |
| Region CDT1 (NGC 1232) | 0.04 | 2.0 | 0.015 | 0.8 |
| Region CDT3 (NGC 1232) | 0.03 | 5.9 | 0.015 | 2.7 |
| Region CDT4 (NGC 1232) | 0.08 | 10 | 0.03 | 3.9 |
| NGC 628 | ||||||||||||
| Region | H13 | H3 | H4 | H5 | ||||||||
| Model | Observed | Model | Observed | Model | Observed | Model | Observed | |||||
| Parameter | ||||||||||||
| log U | -2.70 | -2.78 0.10 | -2.90 | -2.92 0.15 | -2.93 | -2.95 0.15 | -2.97 | -2.97 0.15 | ||||
| ne(cm-3) | 100 | 80 | 10 | 40 | 10 | 40 | 10 | 40 | ||||
| Teff(K) | 35,000 | – | 36,000 | – | 34,700 | – | 34,800 | – | ||||
| 12 + log(O/H) | 8.24 | 8.24 0.08 | 8.23 | 8.23 0.15 | 8.35 | 8.31 0.15 | 8.35 | 8.34 0.15 | ||||
| 12 + log(S/H) | 6.53 | 6.41 0.04 | 6.52 | 6.38 0.05 | 6.64 | 6.75 0.04 | 6.64 | 6.67 0.05 | ||||
| log(N/O) | -1.06 | -1.08 0.04 | -1.13 | -1.14 0.10 | -1.15 | -0.94 0.10 | -1.15 | -1.07 0.10 | ||||
| log(S/O) | -1.71 | -1.83 0.04 | -1.71 | -1.85 0.11 | -1.71 | -1.56 0.11 | -1.71 | -1.67 0.10 | ||||
| 3727 [OII] | 3519 | 2960 110 | – | – | – | – | – | – | ||||
| 5007[OIII] | 1523 | 1547 10 | 1528 | 1596 12 | 489 | 488 8 | 540 | 519 8 | ||||
| 6584[NII] | 523 | 496 8 | 477 | 470 20 | 642 | 603 40 | 642 | 603 43 | ||||
| 6716[SII] | 171 | 204 5 | 246 | 270 13 | 305 | 309 20 | 318 | 333 24 | ||||
| 9069[SIII] | 220 | 168 10 | 213 | 136 10 | 216 | 147 12 | 215 | 149 10 | ||||
| 4072[SII] | 24 | 29 3 | – | – | – | – | – | – | ||||
| 4363[OIII] | 9 | 10 2 | 10 | 16 2 | – | – | – | – | ||||
| 5755[NII] | 9 | 5 1 | – | – | – | – | – | – | ||||
| 6312[SIII] | 12 | 12 1 | 12 | 11 1 | 10 | 5 1 | 10 | 7 2 | ||||
| t(O2+) | 0.97 | 0.98 0.05 | 0.99 | 1.17 0.10 | 0.89 | 0.69 | 0.90 | 0.79 | ||||
| t(S2+) | 1.00 | 1.02 0.03 | 1.02 | 1.03 0.05 | 0.92 | 0.74 0.04 | 0.93 | 0.82 0.06 | ||||
| t(S+) | 0.99 | 0.99 0.06 | – | – | – | – | – | – | ||||
| t(N+) | 1.03 | 0.90 0.06 | – | – | – | – | – | – | ||||
| NGC 1232 | ||||||||||||
| Region | CDT1 | CDT2 | CDT3 | CDT4 | ||||||||
| Model | Observed | Model | Observed | Model | Observed | Model | Observed | |||||
| Parameter | ||||||||||||
| log U | -2.85 | -2.95 0.20 | -3.03 | -2.95 0.15 | -2.80 | -2.72 0.10 | -2.65 | -2.72 0.10 | ||||
| ne(cm-3) | 130 | 130 | 10 | 40 | 230 | 223 | 100 | 118 | ||||
| Teff(K) | 34,900 | – | 36,900 | – | 34,900 | – | 35,000 | – | ||||
| 12 + log(O/H) | 8.97 | 8.95 0.20 | 8.55 | 8.61 0.15 | 8.60 | 8.56 0.14 | 8.49 | 8.37 0.12 | ||||
| 12 + log(S/H) | 7.26 | 7.14 0.10 | 6.89 | 6.80 | 6.96 | 6.86 0.07 | 6.89 | 6.75 0.05 | ||||
| log(N/O) | -0.87 | -0.81 0.08 | -1.10 | – | -1.00 | -0.96 0.04 | -0.94 | -0.91 0.06 | ||||
| log(S/O) | -1.71 | -1.81 0.10 | -1.66 | – | -1.64 | -1.70 0.07 | -1.60 | -1.62 0.07 | ||||
| 3727 [OII] | 1782 | 1490 70 | 4105 | 4180 220 | 3365 | 3180 150 | 2925 | 2530 120 | ||||
| 5007[OIII] | 275 | 229 4 | 1347 | 1350 20 | 830 | 842 13 | 1259 | 1162 8 | ||||
| 6584[NII] | 1190 | 1040 21 | 729 | 717 30 | 921 | 892 30 | 760 | 758 40 | ||||
| 6716[SII] | 326 | 357 8 | 470 | 537 15 | 317 | 333 10 | 261 | 307 20 | ||||
| 9069[SIII] | 299 | 197 13 | 320 | 191 15 | 348 | 229 10 | 342 | 249 10 | ||||
| 4072[SII] | – | – | – | – | 41 | 48 6 | – | – | ||||
| 5755[NII] | 5 | 4 1 | – | – | 9 | 8 2 | 9 | 8 1 | ||||
| 6312[SIII] | 4 | 2 1 | – | – | 11 | 8 2 | 13 | 13 2 | ||||
| t(O2+) | 0.55 | 0.45 | 0.81 | – | 0.76 | 0.69 | 0.79 | 0.84 | ||||
| t(S2+) | 0.59 | 0.54 0.05 | 0.85 | – | 0.80 | 0.74 0.05 | 0.83 | 0.87 0.04 | ||||
| t(S+) | – | – | – | – | 0.83 | 0.90 0.06 | – | – | ||||
| t() | 0.62 | 0.67 0.06 | – | – | 0.83 | 0.86 0.06 | 0.88 | 0.90 0.06 | ||||
| NGC 925 and NGC 1637 | ||||||||||||
| Region | CDT1 | CDT4 | CDT1 | |||||||||
| Model | Observed | Model | Observed | Model | Observed | |||||||
| Parameter | ||||||||||||
| log U | -3.05 | -3.00 0.30 | -3.05 | -3.00 0.25 | -3.10 | -3.30 0.20 | ||||||
| ne(cm-3) | 10 | 40 | 10 | 40 | 100 | 100 | ||||||
| Teff(K) | 36,500 | – | 36,000 | – | 35,000 | – | ||||||
| 12 + log(O/H) | 8.72 | 8.52 0.20 | 8.62 | 8.41 0.20 | 9.17 | 9.10 | ||||||
| 12 + log(S/H) | 7.01 | 6.69 | 6.91 | 6.58 | 7.37 | 7.13 | ||||||
| log(N/O) | -0.97 | -1.07 | -0.97 | -1.01 | -0.87 | -0.88 | ||||||
| log(S/O) | -1.71 | -1.83 | -1.71 | -1.83 | -1.80 | -1.97 | ||||||
| 3727 [OII] | 3414 | 2880 110 | 3710 | 2820 120 | 1169 | 1170 60 | ||||||
| 5007[OIII] | 819 | 849 14 | 784 | 737 10 | 89 | 84 10 | ||||||
| 6584[NII] | 1075 | 568 28 | 1067 | 593 18 | 1180 | 1037 60 | ||||||
| 6716[SII] | 469 | 577 30 | 435 | 437 15 | 349 | 335 20 | ||||||
| 9069[SIII] | 296 | 125 9 | 276 | 160 10 | 201 | 99 9 | ||||||
| tadopt | 0.70 | 0.86 | 0.75 | 0.93 | 0.46 | 0.40 | ||||||