Cosmological Implications of the PSCz PDF and its Moments
Abstract
We compare the pdf and its low-order moments (variance and skewness) of the smoothed PSCz galaxy density field and of the corresponding simulated PSCz look-alikes, generated from N-body simulations of 6 different DM models; four structure normalized with and , one COBE normalized and the old SCDM. The galaxy distributions are smoothed with a Gaussian window at three different smoothing scales , and . We find that the simulation PSCz look-alike pdf’s are sensitive only on the normalization of the power spectrum, probably due to shape similarity of the simulated galaxy power spectrum on the relevant scales. We find that the only models that are consistent, at a high significance level, with the observed PSCz pdf are models with a relatively low power spectrum normalization . From the phenomenologically derived relation, fitted from the simulation data, we find that the PSCz moments suggest .
Keywords: cosmology: theory - galaxies: general - large-scale structure of universe - Infrared: galaxies
1 Introduction
The study of the galaxy or cluster one-point probability density function (pdf), defined as the probability of having cells of volume with overdensity , has been used in order to probe the Gaussian or not nature of the cosmic density field as well as cosmological probe, since the pdf depends on the two-point correlation function or its Fourier Transform, the power spectrum, but also on higher order correlations.
The pdf of the primordial density field evolves due to gravitational instability and even if it follows Gaussian statistics originally, it eventually becomes non-Gaussian by the mere effects of gravity. One therefore may envision that smoothing on large enough scales the present day galaxy density field one can recover the initial conditions. This procedure is unstable due to the fact (1) that galaxies are probably a biased tracer of the underline density field and (2) the central limit theorem ensures that heavy smoothing will Gaussianize even an inherently non-Gaussian field. However, elaborate inversion techniques have been devised and applied with varying level of success to real and simulation data (see Monaco et al. 2000 and references therein) and the general outcome is that indeed the present-day galaxy distribution appears to originate from the effects of gravitational instability on an initial Gaussian fluctuation field.
Many authors studying the pdf statistics of different samples of extragalactic objects, assuming linear biasing, have claimed that if the large-scale distribution of galaxies trace the underlying matter distribution then the observed pdf can be approximated using Gaussian initial conditions (cf. Bouchet et al. 1993; Gaztañaga & Yokohama 1993; Sheth et al. 1994; Kofman et al. 1994). Other authors, using N-body simulations, studied the evolution of the pdf and its moments (cf. Coles & Frenk 1991; Juszkiewicz et al. 1993; Coles et al. 1993; Kofman et al. 1994; Colombi 1994) and concluded that the normalized skewness of the matter distribution, depends on the shape of the power spectrum.
Saunders et al. (1991) used the lower-order moments of the pdf (the variance and skewness) of the sparse sampled IRAS 0.6Jy sample (QDOT) to put constraints on cosmological models. They found that on large scales they are larger than the corresponding moments of QDOT look-alikes, generated from the old standard CDM model. In this paper we will utilize the completed PSCz-IRAS redshift survey in a similar attempt.
The layout of this paper is as follows: in Section 2 we describe briefly our simulations and the considered models; in Section 3 we present the analysis method and the results obtained; we state our main conclusions in Section 4.
2 The Data
2.1 The PSCz sample
In this work we use the recently completed PSCz-IRAS flux-limited redshift survey which is described with details in Saunders et al. (2000). It is based on the IRAS Point Source Catalog and contains galaxies with flux Jy covering the of the sky.
Due to the fact that the PSCz catalog is a flux-limited sample there is the well-known degradation of sampling as a function of distance from the observer which is represented by the selection function. It is necessary therefore to recover the true galaxy density field from the observed flux-limited sample. This is done by weighting each galaxy by , where the selection function, , is defined as the fraction of the galaxy number density that is observed above the flux limit at some distance In this work we use a luminosity function of the form assumed by Saunders et al. (1990) with , , and (cf. Rowan-Robinson et al. 2000).
In order to take into account (1) the 16% of the sky which is devoided of data, due to high cirrus emission areas and unobserved regions, and (2) the distortion of galaxy positions due to peculiar velocities, we utilize the corrected galaxy catalog of Branchini et al. (1999). These authors followed the Yahil et al. (1991) prescription to fill the galactic plane with synthetic objects that reproduce the mean density of galaxies of the nearby regions while at higher galactic latitudes they fill randomly the masked regions with synthetic objects, reproducing the overall mean number density of PSCz galaxies. Furthermore, in order for them to minimize the so called “Kaiser” effect (Kaiser 1987) and recover the true 3D galaxy distances they used an iterative technique and reconstructed the PSCz galaxy density field for different values of . In our present analysis we use their reconstruction, since recently Branchini et al. (2001), using the VELMOD analysis to correlate the PSCz density field with the SFI galaxy velocities (cf. Haynes et al. 1999) found .
2.2 N-body Simulations
We use mock PSCz catalogs, generated from six large cosmological N-body simulations (see Cole et al. 1998), in order to investigate whether the pdf and its moments can discriminate between models. The PSCz look-alikes have been generated by E. Branchini, choosing suitable LG-like observers (having similar to the observed Local Group velocity, shear and overdensity), and he generously provided them to us. Note that due to our ignorance in assigning galaxy formation sites to the DM halo distribution and for a consistent treatment of all models, a biasing factor of 1 has been used in generating the PSCz look-alikes.
Four of the models that we consider are structure normalized with and fluctuation amplitude in 8 Mpc scale of (Eke, Cole, & Frenk 1996), which are: (1) a flat low-density CDM model with () (2) a model with () (3) an model () and (4) an open model with (OCDM); a COBE normalized Einstein de Sitter model with (CCDM) and finally the old ’standard’ CDM model with and (SCDM).
For each cosmological model we average results over 10 nearly independent mock PSCz catalogs which are treated in exactly the same way as the real PSCz data.
| CCDM | SCDM | OCDM | ||||
|---|---|---|---|---|---|---|
| Mpc | ||||||
| PSCz | 0.00 | 0.00 | 0.00 | 0.00 | 0.09 | 0.33 |
| CCDM | 1.00 | 0.00 | 0.00 | 0.00 | 0.00 | |
| 0.00 | 0.00 | 0.00 | 0.00 | |||
| 1.00 | 0.00 | 0.00 | ||||
| SCDM | 0.00 | 0.00 | ||||
| OCDM | 1.00 | |||||
| Mpc | ||||||
| PSCz | 0.00 | 0.00 | 0.00 | 0.00 | 0.46 | |
| CCDM | 1.00 | 0.00 | 0.00 | 0.99 | 0.04 | |
| 0.00 | 0.00 | 0.00 | 0.00 | |||
| 0.00 | 1.00 | 0.00 | ||||
| SCDM | 0.00 | 0.00 | ||||
| OCDM | 1.00 | |||||
3 The pdf Derivation
We obtain a continuous galaxy density field by smoothing the discrete distribution of PSCz galaxies on a grid. We use a Gaussian kernel with smoothing radius, , varying from 5 to 15 Mpc. The grid size that we use is set equal to . If is the smoothed density field at a grid point, then the relative fluctuations are given by , where the average density does not depend on . The frequency distribution of ’s is the pdf.
Basilakos, Plionis & Rowan-Robinson (2001) investigated the systematic biases that enter in such a smoothing procedure due to the convolution between the PSCz selection function and the constant smoothing radius.
The effect is such that the derived smooth density field, at large distances, is overestimated in regions where galaxies are detected (due to the large weighting), while it is underestimated in underdense regions. They devised a phenomenological procedure that corrects effectively the high density regions for such effects. Since this procedure is multiplicative in nature, it is not as effective in recovering the underdense regions and thus we confine our analysis within a limited radius, (, 110 and 120 Mpc for the , 10 and 15 Mpc fields, respectively), within which we have verified that the derived density field is mostly unaffected by the above mentioned bias. This was achieved by comparing the pdf and its moments of PSCz look-alikes and the full 3D “galaxy” distribution in the simulations. Even within the raw values of the variance and skewness are overestimated by , but only for the and 15 Mpc fields. Applying the Basilakos et al. (2001) phenomenological correction procedure does recover the correct values of these moments.
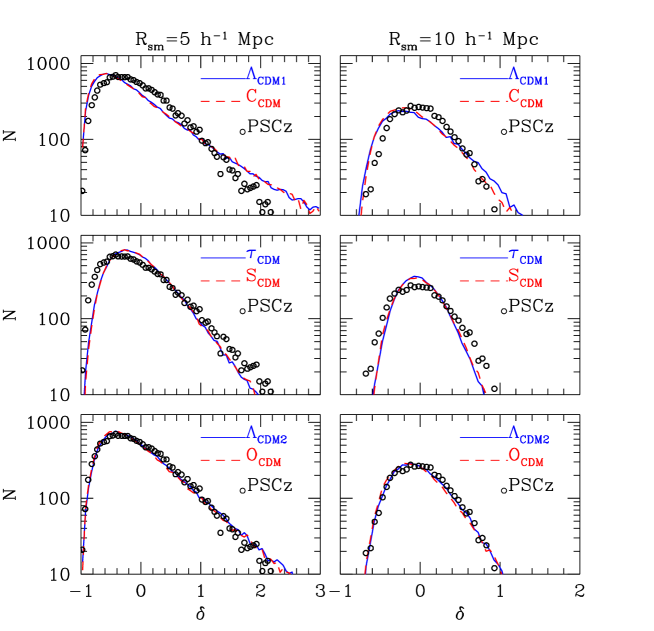
In order to investigate how discriminative between models is the pdf, we have performed a statistical test, comparing the model pdf between them. We find that the present pdf analysis can discriminate only different models, irrespectively of the DM content and the geometry. By using the whole 3D simulation data, we have verified that neither shot-noise nor the PSCz selection function is responsible for such behaviour; which is probably due to the shape similarity of the derived “galaxy” power spectrum on the relevant scales (see figure 2 of Cole et al. 1998). This is particularly true for the OCDM and models that both have and .
Furthermore, we find that the most effective, in discriminating power, smoothing scale is the Mpc one. In Table 1 we present the probabilities, , of significant differences between any two pdf’s for the two indicated smoothing scales. It is clear that the statistical test identifies 3 families of consistent among them models, all of which are based on their relevant normalization.
In figure 1 we present a comparison between the PSCz pdf and those of the 3 families of models. From this figure as well as from table 1, it is clear that the models with are the only ones consistent with the data.
3.1 Moments of the pdf
The variance and the skewness are defined as the second– and third– order moments of the field, respectively. We therefore have
| (1) |
| (2) |
where is the total number of grid points within . Gaztañaga & Yokoyama (1993) have shown that the smoothing process itself suppresses considerably the shot–noise effects. A proper treatment of these effects should entail subtracting the “Poisson” terms from and but in conjunction with the effects of smoothing, which is not a trivial task. However, since all the mock PSCz distributions have the same and we treat them similarly, the possible shot-noise effects are relatively and qualitatively cancelled out in the model and data intercomparison.
| Model | |||
|---|---|---|---|
| CCDM | 5 | 0.8390.135 | 2.3421.256 |
| 10 | 0.1700.014 | 0.0730.031 | |
| 15 | 0.0610.007 | 0.0100.006 | |
| 5 | 0.8560.098 | 2.5891.111 | |
| 10 | 0.2100.028 | 0.1270.054 | |
| 15 | 0.0830.010 | 0.0200.009 | |
| OCDM | 5 | 0.4770.067 | 0.7290.355 |
| 10 | 0.1290.014 | 0.0470.027 | |
| 15 | 0.0540.006 | 0.0090.008 | |
| 5 | 0.4750.065 | 0.7230.295 | |
| 10 | 0.1250.017 | 0.0450.023 | |
| 15 | 0.0620.037 | 0.0170.031 | |
| SCDM | 5 | 0.2630.025 | 0.1870.063 |
| 10 | 0.0740.005 | 0.0150.005 | |
| 15 | 0.0330.003 | 0.0050.003 | |
| 5 | 0.2610.021 | 0.1700.042 | |
| 10 | 0.0680.006 | 0.0140.005 | |
| 15 | 0.0290.004 | 0.0030.003 | |
| PSCz | 5 | 0.361 | 0.326 |
| 10 | 0.109 | 0.025 | |
| 15 | 0.048 | 0.003 |
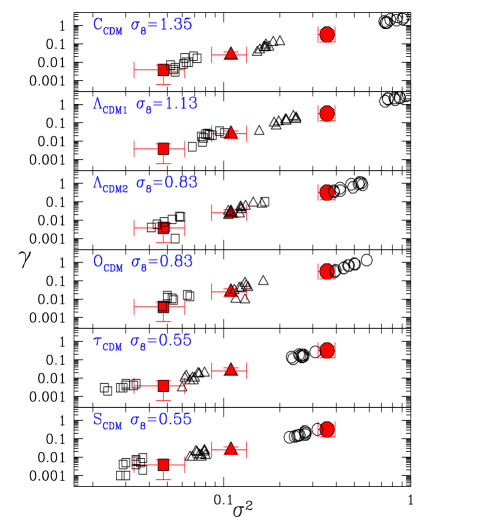
In Figure 2 we plot the – plane, following Coles & Frenk (1991), for the PSCz density field (red filled dots) and for the simulation mock PSCz fields. The results of the , 10 and 15 Mpc field are represented as open circles, triangles and squares, respectively. Each simulation point represents one of the 10 realizations, so that the scatter represents the effect of cosmic variance. The PSCz errorbars represent the scatter estimated by dividing the whole available volume in 4 equal and independent subsamples.
We can estimate the reduced skewness by least-square fitting a relation: , which for is a generic prediction of perturbation theory, of the hierarchical and log-normal clustering models on linear scales (cf. Coles & Frenk 1991). According to Bouchet et al. (1992) the reduced moments are independent of the density and geometry of cosmological models and for this reason they have been used to discriminate between different biasing models rather than cosmological models (cf. Gaztañaga & Frieman 1994). Indeed, keeping we find for all the models, with scatter over the 10 realizations, of . This value is in agreement, within the errors, with the PSCz value (), where the scatter is from the 4 independent volumes used in the estimate. Furthermore, this value is in excellent agreement with , estimated from the IRAS 1.2Jy sample (cf. Fry & Gaztañaga 1994). Leaving unconstrained the value of we find, for both PSCz data and models, which by construction have Gaussian initial conditions, values in the range and . The deviation from is probably due to the effects of shot-noise.
These results argue against large-scale non-gaussianity in the Universe since, according the study of Coles et al (1993), non-gaussian models show departures from such a relation.
In Table 2 we report the real and simulation PSCz pdf moments. Again from both the figure 2 and table 2 it is evident that the PSCz results are nearer to the simulations.
3.2 Recovering the of our Universe
What is also evident, from figure 2, is that there is a tight scaling between and the values of and in the simulation PSCz look-alike fields. We have verified this by fitting a linear relation to the robust Mpc result, to find
with a correlation coefficient of .
Since from the simulation data we have seen that the pdf moments depend only on the value of , we can now attempt to recover, by inserting our PSCz moments to the above relations, the of our Universe. We find
where the quoted uncertainty is the scatter of the mean from using the raw or corrected moments (see section 3) and the -variance or skewness relation. This result is in agreement with many recent studies (cf. Eke et al 1998; Einasto et al. 1999; Moscardini, Matarrese & Mo 2001) and in particular with the most recent cluster X-ray luminosity function evolution results from the ROSAT Deep Cluster Survey (Borgani et al 2001).
4 Conclusions
We have derived the pdf moments of the PSCz galaxy catalog and compared them with the corresponding moments of mock PSCz distributions, generated from six different cosmological models. The pdf and its low-order moments were estimated from the Gaussianly smoothed density field on a grid, using three different smoothing scales, , 10 and 15. For each model we have used 10 PSCz-like realizations to have a handle of cosmic variance. We find that this type of analysis can discriminate models only on the basis of their different values. We find that from the three families of CDM models (, 0.83 and ) the PSCz pdf and its lower order moments are consistent with models having intermediate values of .
Furthermore, using a phenomenological relation, derived from the model PSCz look-alike pdf’s, we find that the PSCz data strongly suggest .
Acknowledgments
The authors wish to thank E.Branchini for providing us with his reconstructed PSCz density field, with the PSCz simulation look-alikes and for useful discussion. M.Plionis acknowledges the hospitality of the Astrophysics Group of Imperial College, where this work was completed.
References
- [] Basilakos, S., Plionis, M., Rowan-Robinson, M., 2001, MNRAS, 323, 47
- [] Bouchet F. R., Strauss M., Davis M., Fisher K. B., Yahil A., Huchra J. P., 1993, ApJ, 417, 36
- [] Borgani S., et al., 2001, ApJ in press, (astro-ph/0106428)
- [] Branchini, E., et al., 1999, MNRAS, 308, 1
- [] Branchini, E., Freudling, W., Da Costa, L.N., Frenk, C.S., Giovanelli, R., Haynes, M.P., Salzer, J.J., Wegner, G., Zehavi, I., 2001, MNRAS, in press
- [] Cole, S., Hatton, S., Weinberg, D. H., Frenk, C. S., 1998, MNRAS, 300, 945
- [] Coles P. & Frenk C. S., 1991, MNRAS, 253, 727
- [] Coles P., Moscardini, L., Lucchin, F., Matarrese, S., Messina, A., 1993, MNRAS, 264, 749
- [] Colombi S., 1994, ApJ, 435, 536
- [] Einasto, J, Einasto, M., Tago, E., Müller, V., Knebe, A., Cen, R., Starobinsky, A. A., Atrio-Barandela, F., 1999, ApJ, 456, 468
- [] Eke, V. R., Cole, S., Frenk, C. S., 1996, MNRAS, 282, 263
- [] Eke, V. R., Cole, S., Frenk, C. S., Henry, P. J., 1998, MNRAS, 298, 1145
- [] Fry, J.N. & Gaztãnaga E., 1994, ApJ, 425, 1
- [] Kaiser, N., 1987, ApJ, 284, L9
- [] Kofman L., Bertschinger E., Gelb J. M., Nusser A., Dekel A., 1994, ApJ, 420, 44
- [] Gaztãnaga E., &, Yokoyama J., 1993, ApJ, 403, 450
- [] Gaztãnaga E., &, Frieman, J. A., 1994, ApJ, 437, L13
- [] Haynes, M., et al., 1999, AJ, 117, 1668
- [] Juszkiewicz R., Bouchet F. R., Colombi S., 1993, ApJ, 412, L9
- [] Monaco P., et al., 2000, MNRAS, 318, 681
- [] Moscardini, L., Matarrese, S., Mo, J. H., 2001, MNRAS, in press, (astro-ph/0009006)
- [] Rowan-Robinson, M., et al., 2000, MNRAS, 314, 37
- [] Saunders, W., Rowan-Robinson, M., Lawrence, A., Efstathiou, G., Kaizer, N., Ellis, R. S., Frenk, C. S., 1990, MNRAS, 242, 318
- [] Saunders W., Frenk, C. S., Rowan-Robinson, M., Lawrence, A., Efstathiou, G., et al., 1991, Nature, 349, 32
- [] Saunders, W., et al., 2000, MNRAS, 317, 55
- [] Sheth R. K., Mo H. J., Saslaw W. C., 1994, ApJ, 427, 562
- [] Yahil A., Strauss M., Davis M., Huchra J.P., 1991, ApJ, 372, 380