Observations of the Extended Distribution of Ionized Hydrogen in the Plane of M31
Abstract
We have used the Wisconsin H-Alpha Mapper (WHAM) to observe the spatially extended distribution of ionized hydrogen in M31 beyond the stellar disk. We obtained five sets of observations, centered near the photometric major axis of M31, that extend from the center of the galaxy to just off the edge of the southwestern HI disk. Beyond the bright stellar disk, but within the HI disk, weak H is detected with an intensity 111photons cm-2 s-1 ster-1. Since M31 is inclined 77∘ with respect to the line of sight, this implies that the ambient intergalactic ionizing flux onto each side of M31 is photons cm-2 s-1. Just beyond the outer boundary of the HI disk we find no significant detection of H and place an upper limit .
1 Introduction
The distribution of neutral hydrogen (HI) in spiral galaxies often extends well beyond their optical disks (see review by Sancisi & van Albada (1987)). Additionally, some spiral systems have neutral hydrogen column densities that sharply truncate at large galactocentric distances (van Gorkom, 1991; Corbelli & Salpeter, 1993). This may be interpreted as the edge of the gaseous disk of the galaxy; however, recent theoretical arguments and observational evidence suggest that an additional phase of material, ionized hydrogen, may exist beyond the regions of observed HI (Maloney, 1993; Bland-Hawthorn et al., 1997). Direct observations of this ionized gas would yield important physical information about the true size of spiral galaxies, and with sufficient sensitivity and spectral resolution, could extend the rotation curve of spiral galaxies, yielding more insight into the dynamics of spiral galaxies and their distribution of dark matter. Observations of ionized hydrogen beyond the stellar disk may also lead to information about the sources of ionization, which may be within the galactic system, as in the case of a hot galactic corona, or outside of it. An external source of radiation, the intergalactic Lyman continuum flux, plays an important role in cosmological models. By observing the brightness of the H in the outer HI disk of a local galaxy, one may constrain the magnitude of the ionizing background flux.
We have used the Wisconsin H-Alpha Mapper (WHAM) to observe the distribution of diffuse ionized hydrogen in the local spiral galaxy M31. The high sensitivity and large field of view of WHAM make M31 the best galaxy in which to search for an extended disk of ionized hydrogen.
2 Observations
The WHAM instrument is a fully remotely operated facility with a 15 cm, dual-etalon Fabry-Perot spectrometer at the focal plane of a 0.6 m telescope atop Kitt Peak in Arizona (Reynolds et al., 1998; Tufte, 1997). The WHAM spectrometer has a 1∘ diameter circular field of view on the sky, and a velocity resolution of 12 km s-1 within a 200 km s-1 wide spectral window that can be centered on any wavelength between 4800 Å and 7300 Å. WHAM was designed to detect very weak emission lines from ionized gas.
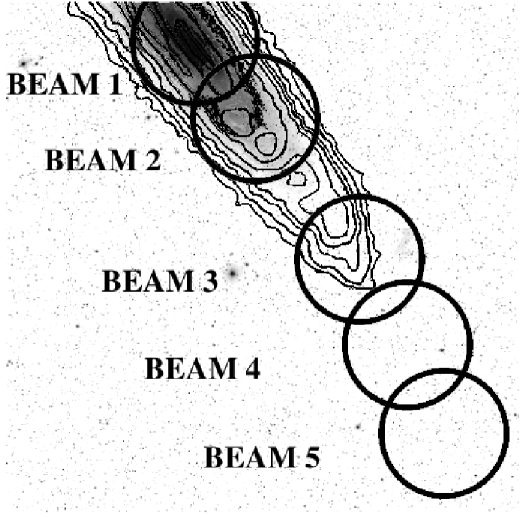
For the observations of M31, the spectral window was centered at approximately -500 km s-1 with respect to rest H, which is the approximate radial velocity of the southwestern half of the galaxy. Spectra were obtained toward a total of nine lines of sight. Five lines of sight (“ONs”) were centered near the photometric major axis of M31 and extended from the center of M31 to just off the edge of the observed southwestern HI disk (see Figure 1). Four lines of sight (“OFFs”), located a couple of degrees away from M31 (see Table 1) and free of M31 H emission, were used as comparison spectra. Each direction was observed for 300 s at a time, alternating between OFFs and ONs. The data were obtained over a total of five nights during three different periods separated by almost one year. This was done to take advantage of the motion of the expected M31 H emission line with respect to fixed weak atmospheric lines. Table 1 summarizes the details of the observations.
The WHAM interferometer produced 128128 pixel ring images from which spectra were extracted via an annular ring summing technique; each position within the 1∘ beam is equally sampled by each spectral element (Tufte, 1997). The resultant spectra were flat-fielded, continuum subtracted, and intensity calibrated. Signatures of cosmic rays and physical defects in the interference filter were removed with pixel masking.
Figure 2 shows an average of 44 spectra toward all OFF lines of sight taken on the same night, free of M31 emission. The bright feature in the red side of the spectrum is a well-known OH atmospheric line at 6553.6 Å, which we used for precise wavelength calibration. The feature near -480 km s-1 is a Fabry-Perot ghost from the bright geocoronal H line near 0 km s-1; the other features are extremely weak, unidentified atmospheric lines within the spectral window. The strengths of all of these lines vary both temporally and spatially on the sky, which make the task of identifying the weak H emission line from M31 formidable.
To isolate the emission solely due to M31, the spectra obtained in the OFF directions were subtracted from the ON spectra. Due to the complex nature of the intensity variations of the weak atmospheric features, only a subset of the OFF spectra were subtracted from the ONs. This subset satisfied the criteria that the resultant spectra formed a flat baseline around the region of expected M31 emission. This process produces accurate spectra if the OFFs possess no significant extra-terrestrial emission features within the spectrum. The potentially incomplete subtraction of the atmospheric lines is the largest source of uncertainty in our results.
3 Results
Beam 1, positioned at the center of M31, reveals significant H emission. However, due to the dynamical location of the line of sight, the width of the line extended beyond the 100 km s-1 range of the spectrum. Hence, an accurate spectral baseline and estimate of the emission line strength was not possible. For the remaining ON beam positions, the expected emission line width should be relatively narrow, comparable to the thermal and turbulent motion of the emitting gas. This is confirmed by observations of M31’s flat rotation curve toward these directions, as seen in the 21 cm spectrum along the major axis (Cram et al., 1980).
The spectra taken toward Beam 2 also reveals significant H emission, as seen in Figure 3, with an intensity of I. The error in this measurement is due to the uncertainty in the spectral baseline generated by the incomplete subtraction of the weak atmospheric features. Toward the line of sight off of the stellar disk, but within the HI disk (Beam 3), H emission is detected near the velocity of the HI, with I (see Figure 4). Figure 1 shows that this emission arises far from the optical stellar disk.
Toward the two lines of sight just off the edge of the HI disk (Beams 4 & 5), no significant H emission was detected. Upper limits of and were determined for Beams 4 and 5, respectively (see Figure 4). These are the strengths of the strongest emission that can be placed at the HI velocity, with the same width as the H emission detected in Beam 3, and not be discernable in the spectra. Note that the scatter in the spectra toward Beam 5 is considerably larger than for Beam 4. This increase in the scatter arises from intrinsically larger variations in the atmospheric lines in this direction. A more accurate removal of these lines toward Beam 4 has provided a stronger upper limit, which we adopt as the largest H emission strength allowable off the edge of the HI disk in M31. Although the data indicate a somewhat lower limit, we have concluded that the variations in the atmospheric lines, which produce incomplete subtraction of these features in the ON-OFF spectra, could hide a signal up as large as . We note that the 2 uncertainty due to Poisson noise in the data is much lower, at .
Other deep CCD imaging searches for faint H emission in external galaxies (Zurita et al., 2000; Ferguson et al., 1998a; Martin & Kennicutt, 2001; Walterbos & Braun, 1992) are sensitive to signals ranging from to , with typical sensitivities of tens of Rayleighs. Our ability to detect emission down to is a result of the unique dual-etalon, high resolution Fabry-Perot design of WHAM, combined with the power of the ON-OFF technique.
4 Discussion and Conclusions
One of the original motivations for these deep H observations of M31 was to search for HII extending beyond the radius of the HI cutoff. No such extended emission was found down to our detection limit of . This corresponds to a face-on emission measure cm-6 pc for a temperature of 10K, and a column recombination rate of hydrogen recombinations cm-2 s-1. To calculate the emission measure and recombination rate we estimated the extinction of the H photons as they pass through the Milky Way along each of the lines of sight. We used the Galactic neutral hydrogen column density toward each direction (Hartmann & Burton, 1997), and the relationship between and given by Bohlin et al. (1978) and Mathis (1990) to increase IHα by 30% over the observed IHα. The extinction within the outer disk of M31 is negligible as compared to the foreground Galaxy (Cuillandre et al., 2001), and we therefore have not corrected for that effect.
On the other hand, we did detect ionized hydrogen in the extended HI disk of M31 (Beam 3). One possible source of this ionization is young, massive O stars within the HI layer. Cuillandre et al. (2001) recently completed a deep, V and I band photometric imaging study of a region within our Beam 3, and did find evidence of young B stars. However, they also mention that while an estimate of the threshold for very massive star formation in this region is difficult to ascertain, it is unlikely that the gas disk surface density exceeds the critical density (Martin & Kennicutt, 2001). Therefore, while deep H imaging studies of galaxies of later-type than M31 (Sb) have revealed sites of massive star formation at comparably large galactocentric distances (Ferguson et al., 1998a, b), it seems unlikely that the observed H emission toward Beam 3 arises from photoionization from massive O stars.
Another possible source of this HII is an external flux of Lyman continuum radiation. Since the HI fills the WHAM beam for position 3 (see Cram et al. (1980)), the observed H intensity of provides a direct estimate of the required ionizing flux (Maloney, 1993). Assuming that the HI absorbs all of the incident Lyman continuum photons and that the gas is optically thin to H, we find that an ionizing flux incident photons cm-2 s-1 on each side of M31 would account for the H. We derived this value assuming case B and an electron temperature K, making the small extinction correction described above, and taking into account the 77∘ inclination of M31’s disk from the line of sight. However, since additional sources of ionization may be present, e.g. B stars, planetary nebulae, or hot white dwarf stars in the outer disk and halo of M31 (Cuillandre et al., 2001), this value of must be considered an upper limit on the external ionizing flux. Other authors have derived with various techniques combining both observations and theory and probing a variety of extragalactic environments (see Table 1 of Shull et al. (1999)). We find that our value of photons cm-2 s-1 is among the lowest of these reported values.
Our upper limit on near M31 implies that a spherical, isolated HI cloud bathed only in an isotropic intergalactic radiation field of the Local Group would have an H intensity . This is significantly ( factor of 3) below the observed intensities of high velocity HI clouds in the Milky Way’s halo (Tufte et al., 1998) and in the Magellanic Stream (Weiner & Williams, 1996), implying an additional source of ionizing radiation in the halo of the Milky Way, such as Lyman continuum photons from O stars escaping the disk (Bland-Hawthorn & Maloney, 1999; Dove, Shull, & Ferrara, 2000). H observations of high velocity HI clouds may therefore provide important information about the location of clouds within the Local Group. Specifically, clouds far from a galaxy (e.g. Blitz et al. (1999)) should have H intensities .
References
- Bland-Hawthorn et al. (1997) Bland-Hawthorn, J., Freeman, K.C, & Quinn, P.J. 1997, ApJ, 490, 143
- Bland-Hawthorn & Maloney (1999) Bland-Hawthorn, J. & Maloney, P.R. 1999, ApJ, 510, L33
- Blitz et al. (1999) Blitz, L., Spergel, D.N., Teuben, P.J., Hartmann, D., & Burton, W.B. 1999, ApJ, 514, 818
- Bohlin et al. (1978) Bohlin, R.C., Savage, B.D., & Drake, J.F. 1978, ApJ, 224, 132
- Corbelli & Salpeter (1993) Corbelli, E. & Salpeter, E.E. 1993, ApJ, 419, 104
- Cram et al. (1980) Cram, T.R, Roberts, M.S., & Whitehurst, R.N. 1980, A&AS, 40, 215
- Cuillandre et al. (2001) Cuillandre, J., Lequeux, J., Allen, R.J., Mellier, Y., & Bertin, E. 2001, ApJ, 554, 190
- de Vaucouleurs et al. (1991) de Vaucouleurs, G., de Vaucouleurs, A., Corwin, J. R., Buta, R. J., Paturel, G., & Fouque, P. 1991, Third Reference Catalogue of Bright Galaxies (New York: Springer)
- Dove, Shull, & Ferrara (2000) Dove, J.B, Shull, J.M, & Ferrar, A. 2000, ApJ, 531, 846
- Ferguson et al. (1998a) Ferguson, A.M.N, Gallagher, J.S., & Wyse, R.F.G. 1998a, AJ, 116, 673
- Ferguson et al. (1998b) Ferguson, A.M.N., Wyse, R.F.G, Gallagher, J.S., & Hunter, D.A. 1998b, ApJ, 506, L19
- Hartmann & Burton (1997) Hartmann, D., & Burton, W.B. 1997, Atlas of Galactic Neutral Hydrogen, (Cambridge; New York: Cambridge University Press)
- Maloney (1993) Maloney, P.R. 1993, ApJ, 414, 41
- Martin & Kennicutt (2001) Martin, C.L., Kennicutt, R.C. 2001, ApJ, 555, 301
- Mathis (1990) Mathis, J.S. 1990, ARA&A, 28, 37
- Reynolds et al. (1998) Reynolds, R.J., Tufte, S.L., Haffner, L.M., Jaehnig, K., & Percival, J.W. 1998, PASA, 15, 14
- Sancisi & van Albada (1987) Sancisi, R. & van Albada, T.S. 1987, in Dark Matter in the Universe, ed. J. Kormendy & G.R. Knapp (IAU Symp. 117), 67
- Shull et al. (1999) Shull, J.M., Roberts, D., Giroux, M.L., Penton, S.V, & Fardal, M.A. 1999, ApJ, 118, 1450
- Stanek & Garnavich (1998) Stanek, K.Z. & Garnavich, P.M. 1998, ApJ, 503, L131
- Tufte (1997) Tufte, S.L. 1997, Ph.D. Thesis, U. Wisconsin - Madison
- Tufte et al. (1998) Tufte, S.L., Reynolds, R.J., & Haffner, L.M. 1998, ApJ, 504, 773
- van Gorkom (1991) van Gorkom, J.H. 1991, in ASP Conf. Ser. 16, Atoms, Ions, and Molecules: New Results in Spectral Line Astrophysics, ed. A.D. Haschick & P.T.P. Ho (San Fransisco:ASP), 1
- Walterbos & Braun (1992) Walterbos, R.A.M, & Braun, R. 1992, A&AS, 92, 625
- Weiner & Williams (1996) Weiner, B.J., & Williams, T.B. 1996, AJ, 111, 1156
- Zurita et al. (2000) Zurita, A., Rozas, M., & Beckman, J.E. 2000, A&A, 363, 9
| Distance | IHα | vHαddVelocity of the H emission with respect to the LSR. | FWHM | |||||
|---|---|---|---|---|---|---|---|---|
| Beam # | ON/OFF | aaCoordinates given in [B1950] equinox. | aaCoordinates given in [B1950] equinox. | (kpc)bbGalactocentric distance, using a distance of 784 kpc to M31 (Stanek & Garnavich, 1998). | ()ccRadius of the mag arcsec-2 isophote (de Vaucouleurs et al., 1991). | () | (km s-1) | (km s-1) |
| 1 | ON | 0h 40m 00s | 41∘ 00’ 00” | … | … | … | … | … |
| 2 | ON | 0h 37m 33s | 40∘ 24’ 32” | 10.3 | 0.47 | -535 0.5 | 51 1 | |
| 3 | ON | 0h 33m 16s | 39∘ 17’ 54” | 29.2 | 1.34 | -521 1.5 | 36 5 | |
| 4 | ON | 0h 31m 26s | 38∘ 37’ 26” | 39.5 | 1.82 | 520 | 36 | |
| 5 | ON | 0h 30m 00s | 37∘ 55’ 00” | 49.8 | 2.29 | 520 | 36 | |
| 6 | OFF | 0h 08m 00s | 38∘ 15’ 00” | … | … | … | … | … |
| 7 | OFF | 1h 00m 00s | 38∘ 00’ 00” | … | … | … | … | … |
| 8 | OFF | 0h 20m 00s | 41∘ 00’ 00” | … | … | … | … | … |
| 9 | OFF | 0h 55m 00s | 41∘ 30’ 00” | … | … | … | … | … |