Cascades in the Earth’s magnetosphere
initiated by photons with the parameters
of the highest energy AGASA events
Włodzimierz Bednarek
Department of Experimental Physics, University of Łódź,
90-236 Łódź, ul. Pomorska 149/153, Poland
Abstract
We investigate the cascading effects of extremely high energy (EHE) photons in the Earth’s magnetosphere assuming that these photons arrive with the parameters of the highest energy AGASA events (energies, arrival directions). For the location of the AGASA Observatory, we determine the directions in the sky from which photons can cascade with a high (low) probability. In the case of the primary photons with the parameters of the events with the energies eV, we compute the average cascade spectra of secondary photons entering the Earth’s atmosphere, and estimate their fluctuations around these average values by selecting the events with the largest and smallest number of secondary cascade photons. It is shown that most photons with the parameters of the highest energy AGASA events should initiate cascades in the Earth’s magnetosphere with a high probability even though they tend to arrive from directions in the sky for which the perpendicular component of the magnetic field is weaker. On the other hand, if these events are caused by the photons with lower energies, then the fluctuations in their shower development in the magnetosphere and the atmosphere should be higher than in the case of photons with the energies estimated by the AGASA experiment.
1 Introduction
It is believed that the number of photons in the cosmic rays with the energies above eV may be significant. Extremely high energy cosmic ray hadrons should produce many photons in collisions with the Microwave Background Radiation when propagating through the universe (Wdowczyk & Wolfendale 1990, Halzen et al. 1990). The EHE photons may also be efficiently produced from the decay of massive particles (e.g. Higgs and gauge bosons), as predicted by some more exotic theories (see for review Bhattacharjee & Sigl 2000). Therefore, the investigation of the photon content in the EHE cosmic rays (CR) can give us important information about its origin. It is very difficult to obtain experimental constraints on the content of EHE CR due to the low statistics of detected particles at these energies and problems with the particle interaction models. In spite of these problems first efforts have been undertaken. For example, the analysis of the Haverah Park data allows the authors to put the upper limit on the photonic content in the cosmic rays above eV equal to 55% (Ave et al. 1999, 2002). Similar limits have recently been obtained from the analysis of the AGASA data (Shinozaki et al. 2002). On the other hand, there is also experimental evidence, e.g. small scale clustering of EHE CR with the energies above eV (Takeda et al. 1999, 2001, Tinyakov & Tkachev 2001), which suggest that the EHE cosmic rays contain a significant part of neutral particles (-rays, neutrons ?).
Even if photons may not completely dominate the highest energy cosmic rays, it is useful to investigate the hypothesis of their photonic origin since photons of sufficiently high energies may convert into pairs when propagating in a perpendicular magnetic field (Erber 1966). It has been shown by McBreen & Lambert (1981) that such a conversion of photons should also occur in the Earth’s magnetic field. The secondary pairs created by photons should produce many secondary synchrotron photons, which in turn can again convert into pairs. Cascades initiated by the primary photons in the Earth’s magnetosphere have already been discussed in the general context of the photon initiated cascade theory in the Earth’s atmosphere by e.g. Aharonian, Kanevsky & Sahakian (1991), Karakuła (1997), Kasahara (1997), Stanev & Vankov (1997), Anguelov & Vankov (2000) and also in the context of detecting high energy photons by planned Auger Observatories by Bednarek (1999) and Bertou, Billoir & Dagoret-Campagne (2000).
Different experiments (Volcano Ranch, Haverah Park, Yakutsk, Fly’s Eye, AGASA) have reported several showers with the energies eV (Nagano & Watson 2000, Takeda et al. 1999, Hayashida et al. 2000). Best documented are the events observed by the AGASA array111available through AGASA web page: www-akeno.icrr.u-tokyo.ac.jp/AGASA/pub/. This experiment registered 64 events with the energies eV (between them 10 have energies above eV) with zenith angles smaller than 45o. Extending the analysis of the AGASA data to the events coming for the zenith angles up to 60o increased the number of candidate events above eV to 17 (Sakaki et al. 2001). Unfortunately, the information which allow us to determine of the azimuth and zenith angles of these events, has only been published for 47 events with the energies eV, 8 of them have the energies eV (Hayashida 2000). The parameters of two additional recent events with the energies above eV are reported on the AGASA web page.
In this paper we analyse the features of cascades initiated by photons assuming that they arrive in the Earth’s magnetosphere with the arrival directions of the AGASA events and energies eV. Our purpose is to find out if specific photons with the parameters of the AGASA events may interact with the Earth’s magnetic field.
2 Cascades initiated by photons in the Earth’s magnetic field
The EHE photon with the energy can convert into an pair in the magnetic field if the value of the parameter (where G and is the electron rest mass) is high enough (Erber 1966). The secondary pairs can in turn produce synchrotron photons in the magnetic field. The efficiency of this process is determined by the parameter . The energies of synchrotron photons can be high enough to produce the next generation of pairs, sustaining, in this way, the development of a cascade in the magnetic field. The simulations of the primary photons with energies of the highest energy cosmic ray events entering the Earth’s magnetosphere show that up to a few generations of secondary pairs can be produced.
We simulate the development of such a photon initiated cascade in the Earth’s magnetic field by applying the spectra in the relativistic quantum domain for the pair production by photons and for the emission of synchrotron photons by secondary pairs given by Baring (1988). The spectra of pairs and synchroton photons computed using these formulae start to differ significantly in their high energy end in respect to the spectra without quantum corrections (e.g. Erber 1966) if the parameters and are much higher than one. In order to show the quantitative differences between the spectra with and without quantum corrections, Fig. 1 presents the probabilities of production of pairs by photons and the probabilities of emission of synchrotron photons by electrons (positrons) for selected values of and . These probabilities have been calculated from
| (1) |
where is the random number. is the ratio of a simulated energy of the electron (positron) normalized to the energy of the parent photon for the process of photon conversion into an pair, or the ratio of simulated energy of synchrotron photon normalized to the energy of the parent electron (positron) for the process of synchrotron emission of photon by an electron (positron). and are the spectra for production of pairs by the photon or for production of synchrotron photons by the electron (positron) (see Baring 1988). The mean free paths, , for these processes are obtained from
| (2) |
From Fig. 1, it is evident that if the values of , the energies of produced secondary particles are significantly higher when the quantum corrections are included. Therefore, the more precise formulae given by Baring should be used if the parameters and are of the order of a few. This is the case of photons with the parameters of some highest energy AGASA events ( eV). With these exact formulae the cascade initiated by photons becomes more penetrating.
To find out which specific photons can initiate cascades in the Earth’s magnetic field, we have computed the mean free path for a conversion of photons with energies into pairs in a perpendicular magnetic field and for the production of synchrotron photons by electrons (positrons) with energies in this same magnetic field. In Fig. 2 we show the results as a function of photon and electron energies in a perpendicular magnetic field with the strength of 0.3 G (typical of the Earth’s surface on the equator). The mean free paths for other magnetic fields can be obtained from Fig. 2 by simple linear scaling of the present computations (shift to the left and down for a stronger magnetic field). From Fig. 2 it becomes clear that photons with the energies above eV may convert into pairs (the mean free path comparable to the Earth’s radius). The shortest mean free paths ( km) have photons with the energies of a few eV. The mean free path for the production of synchrotron photon by an electron (positron) is equal to km for eV. Our computations of the mean free paths for these two processes are consistent with the results obtained by Kasahara (1997).
To analyse the cascade initiated by a specific photon with the parameters of the AGASA event we apply the Monte Carlo method. We start to follow the propagation of a photon from the distance of 5 Earth radii. The distance, , at which the photon converts into an pair is obtained from:
| (3) |
where is the random number. Note that depends on the propagation distance . The energies of secondary electrons (positrons) are obtained from Eq. 1. The distance, , of the emission of a synchroton photon by an electron (positron) is obtained from Eq. 3 in which is replaced by the mean free path for emission of synchrotron photon (see Eq. 2). The energy of synchrotron photon produced by secondary electron (positron) is obtained from Eq. 1.
Our simulations show that in the case of cascades initiated by photons with the energies of eV in the magnetic field with a typical value of 0.3 G, up to 4 pairs of secondary pairs can be produced. These 8 leptons produce on their path through the magnetosphere up to a few hundred synchrotron photons which arrive in the Earth’s atmosphere with the energies above 10 GeV. Since leptons produced in the Earth’s magnetosphere seperate from each other (different charge) and their number is relatively low, the collective effects on emission of synchrotron radiation such as backreaction (Nelson & Wasserman 1991, Aloisio & Blasi 2002a) or coherent emission (Aloisio & Blasi 2002b) are neglected.
We conclude that the photons with the parameters of the highest energy events observed in cosmic rays can convert into pairs in the Earth’s magnetic field. However, due to the dipole structure of the Earth’s magnetic field, the probability of conversion should strongly depend on the location of the cosmic ray observatory and on the arrival direction of the primary photon.
3 Photons arriving to the location of the AGASA array.
In order to have an idea which photons with the highest energy AGASA events can interact with the Earth’s magnetosphere, we compute the profiles for the perpendicular components of the magnetic field for different photon arrival directions in respect to the location of the AGASA observatory (N, E), using the World Magnetic Model222available through: www.ngdc.noaa.gov. The results of the calculations for different zenith and azimuth angles (measured clockwise from the North) are shown in Figs. 3. It is evident that photons arriving to the AGASA array from the southern directions (the azimuths ) meet the lowest perpendicular component of the magnetic field along their way of propagation. For these azimuth angles, and at some range of the zenith angles, the perpendicular component of the magnetic field can reach very small values since in these directions of the sky the magnetic field is almost tangent to the path of the photon (see characteristic cusps in Figs. 3). The magnetic field profiles determine the probability of conversion of a primary photon with specific energy into an pair. In Figs. 4 we show the probabilities for interaction of photons with different energies: eV, eV, and eV, coming to the AGASA array from the sky. These probabilities strongly depend on the arrival directions and photon energies. Photons with the energies eV, arriving from the northern sky for zenith angles greater than , should convert into pairs with the probability equal to one. However, for the southern sky, there is a region centered on and (slightly shifted from the South to the East due to the south-east Asian magnetic anomaly), where the probability of interaction is significantly lower than one even for the highest energy AGASA events. The probability of photon interaction drops very fast with photon energy. For example, photons with the energies of eV already have a chance to arrive in the Earth’s atmosphere without interaction even from the northern sky. For such photons the region of low interaction probability expends largely containing in its center the region with the probability of interaction equal to zero.
3.1 Cascading effects of photons with the parameters of the AGASA events.
Let us assume that the highest energy AGASA events are caused by the EHE photons. For photons with the energies of some of these events the parameter can be as high as a few. Therefore these photons should pre-cascade in the Earth’s magnetosphere before developing the cascade in the Earth’s atmosphere. Published parameters of the AGASA events with the energies above eV (Hayashida et al. 2000) allows us to re-calculate their arrival directions, i.e. the zenith and azimuth angles (see Table 1). Using them, we simulate cascades initiated by photons in the Earth’s magnetosphere. The probabilities that photons will cascade with the parameters of these events (averaged over simulations) and the numbers of secondary photons with energies eV (averaged over 200 simulations) arriving at the distance of 20 km from the Earth’s surface are reported in the fifth and the sixth column of Table 1. First photon interaction usually occurs closer to the detector than the one Earth’s radius. The most probable distance of the first interaction is usually closer than km from the AGASA array (the results for some specific events are shown in Fig. 5).
It is interesting to note that most of the AGASA events with the energies eV (eight out of ten) tend to arrive from the southern part of the sky (their directions are marked by crosses in Figs. 4), i.e from the part of the sky where the probabilities of a photon conversion into an pair are the lowest. However, our simulations show that the photons with the parameters of these events cascade efficiently in the Earth’s magnetic field. The probabilities of photon conversion into an pair are very high for most events with energies eV (see Table 1). The photons with the parameters of three AGASA events, which have energies in the range eV, seem to behave similarly to the photons with energies eV. These two lower energy events, which arrive from the southern directions, also have a high probability of cascading.
The situation with lower energy events, i.e. the events with the energies of eV, is different. Their arrival directions are quite isotropic in the azimuth since nine out of twenty events arrive from the southern sky and the rest from the northern sky. Only the events arriving from the northern sky cascade with a high probability (see Table 1). For example, two AGASA events with the same energies eV (91/05/31 and 92/02/01), arriving from the northern and southern directions cascade with a completely different probability (equal to 0.935 and 0.005, respectively). Therefore, basing on the features of the cascades initiated by the photons with parameters of the AGASA events we distinguish two groups of particles. The first one contains events with the energies above eV (13 events) which tend to arrive from the southern directions. The second one contains events with the energies below eV (20 events). Their distribution of arrival directions in the azimuth is more uniform. These two groups are separated by the lack of events with the energies in the range eV.
In Table 1 we also report the number of secondary photons with the energies eV produced in cascades initiated by these events. These secondary photons carring most of the energy of a primary photon, fall into the Earth’s atmosphere within a very small cone with the radius of a few tens of centimeters. They develop electromagnetic showers which in fact cannot be distinguished by cosmic ray detectors from a single shower. The secondary electrons and positrons produced in the cascade (usually not more than eight particles) arrive in the Earth’s atmosphere with typical energies above eV. They carry only a few percent of the primary photon energy so their contribution to the cascade in the atmosphere is negligible.
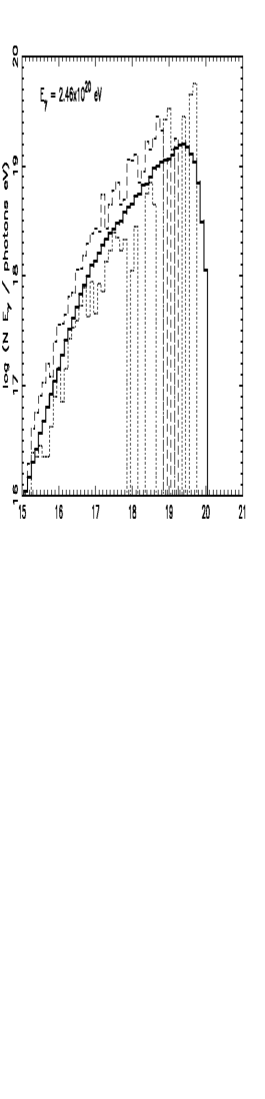
We also investigate the spectra of secondary cascade photons, produced in the magnetic field by primary photons with the parameters of the AGASA events with the energies eV, and fluctuations of these spectra in respect to the spectrum averaged over 200 simulations. In Fig. 6 we show the histograms with the numbers of secondary photons within the specific energy range (, where ), which arrive in the atmosphere (i.e. at the distance of 20 km from the surface). The results of the simulations with the lowest and the largest numbers of secondary photons (selected from these 200 simulations) are marked by the dotted and dashed histograms. In the case of four AGASA events (with energies: eV, eV, eV, and eV) all 200 simulated photons converted into pairs. The fluctuations between different simulations in the number of secondary photons with energies eV may be as high as a factor of 2-3 around the average values. However, these fluctuations mainly concern the lower energy secondary photons and therefore, do not affect the development of cascades in the atmosphere seriously. The fluctuations in the location of the maximum in the spectrum are more important since this maximum is usually located close to or just above eV. Above this energy the Landau-Pomeranchuk-Migdal (LPM) (Landau & Pomeranchuk 1935, Migdal 1956) effect can have a significant influence on their further cascading in the atmosphere. The fluctuations of the location of the maximum in the spectrum of secondary photons strongly depend on the considered AGASA event. They are only of the order of two in the case of events with the energies of eV and eV. However, they can be as high as a factor of four for the event with the energy of eV. In fact, the primary photons with the parameters of some events with the energies eV may not cascade at all in the magnetosphere. This possibility takes place rather rare, since all these events, except the event with the energy of eV, cascade with a probability greater than a half.
A closer inspection of Fig 6 shows that most primary photons with parameters of the AGASA events with the energies eV arrive in the atmosphere as a bunch of lower energy secondary photons with the mean energy just above eV. Therefore, these primary photons should initiate cascades in the Earth’s atmosphere which are not influenced by the LPM effect. The LPM effect is responsible for large fluctuations of showers which are induced by photons with the energies above a few eV, as recently verified in the Monte Carlo simulations based on the Cosmos code (Kasahara 1997) and AIRES program (Bertou, Billoir & Dagoret-Campagne 2000). Also the depth of the maximum of showers simulated with the LPM effect is much deeper in the atmosphere than in the case of showers without the LPM effect. That is why it is generally expected that showers in the atmosphere initiated by the EHE photons with the energies above a few eV should be easily distinguished from the ones induced by hadrons. However, as we noted above, primary photons with parameters of the AGASA events with energies above eV usually pre-cascade in the magnetosphere with a high probability. Their products arrive in the atmosphere in the form of bunches of secondary photons initiating cascades in the atmosphere which are not significantly influenced by the LPM effect. The depth of the shower maximum which is induced by photons with the energies of eV (equal to g cm2) does not differ significantly from the depth of shower maximum induced by the protons with energies of AGASA events (Bertou, Billoir & Dagoret-Campagne 2000).
The photons with parameters of the lower energy AGASA events eV, which arrive from the southern directions, do not cascade in the Earth’s magnetosphere or cascade with a low probability (Table 1). The cascades initiated in the atmosphere by these primary photons, which do not suffer pre-cascading in the magnetosphere, are susceptible to large fluctuations due to the LPM effect. Hence, these showers can have the shower maximum even deeper in the atmosphere than showers initiated by primary photons with significantly higher energies which pre-cascaded in the magnetosphere.
3.2 Cascading effects of photons with reduced energies of the AGASA events
The conclusion mensioned in the previous section suggests that also the photons which have the arrival directions of AGASA events with energies eV, but energies reduced by a factor of two or three in respect to the values estimated by AGASA group, should arrive in the atmosphere without pre-cascading in the magnetosphere. To check this we simulate the cascades initiated by primary photons with the parameters of the highest energy AGASA events but with energies reduced by factors mentioned above. It is found that in most cases the probability of conversion of such photons becomes significantly lower (only two events, 01/05/10 and 94/07/06, have the probability of interaction still greater than a half, see columns seven and eight in Table 1).
As an example, in Fig. 7 we compare the average spectra of secondary photons produced by primary photons with reduced energies with the ones produced by primary photons with the energies reported by the AGASA experiment for two events: 93/12/03 and 96/01/11. In both cases the average energies of secondary photons are higher in the case of primary photons with reduced energies than in the case of the average energies of secondary photons produced by primary photons with energies originally estimated by AGASA group ( eV and eV). Therefore we conclude that the highest energy AGASA events with energies reduced by a factor of two or three are more sensitive to fluctuations during cascading in the atmosphere because of a larger influence of the LPM effect on the development of showers initiated by the secondary photons with higher energies. We suggest that due to these fluctuations, not taken into account in derivation of the initial energies of the AGASA events, the energies of AGASA events arriving from the southern directions may be incorectly estimated.
4 Conclusions
We analyse the AGASA events with energies above eV for which the arrival parameters have been published (Hayashida et al. 2000 and AGASA web page). It seems that two groups of events can be distinguished. The first group contains 13 events with energies eV. These events tend to arrive in the AGASA array mainly from the southern directions (10 out of 13). The second group contains 20 events with energies eV. Their arrival distribution in the azimuth angle is uniform (9 from the southern part of the sky and 11 from the northern sky). These two groups are separated by the lack of events with energies between eV.
We have shown that primary photons with the parameters of the highest energy AGASA events ( eV) usually efficiently pre-cascade in the Earth’s magnetosphere in spite of the fact that most of them arrive from the southern directions where the perpendicular component of the magnetic field is the lowest. Photons with parameters of the lower energy AGASA events, eV, can cascade efficiently when arriving from the northern directions. They usually do not cascade (or cascade with a low probability) when arriving from the southern directions.
As we have mentioned the primary photons with the energies of eV arriving from the southern direction should not cascade (or cascade with a low probability). They fall onto the atmosphere with average energies higher than the average energy of the secondary photons produced in cascades initiated in the Earth’s magnetosphere by the primary photons with the energies eV. Therefore, the lower energy primary photons, ( eV, should initiate showers in the atmosphere which fluctuate stronger due to the LPM effect than the showers initiated by the primary photons with the higher energies ( eV). We suggest that these effects may influence the estimation of energies of photonic events arriving from the southern direction. This suggestion is consistent with the tendency that the higher energy AGASA events ( eV) more likely arrive from the southern directions which is not the case in the lower energy events ( eV). Their arrival distribution in the azimuth angle is consistent with the uniformity.
Acknowledgment.
I would like to thank the anonymous referee for useful comments. This work is supported by the KBN grant No. 5P03D 025 21.
References
- [1] Aharonian, F.A., Kanevsky, B.L., Sahakian, V.A., 1991, J.Phys.G, 17, 1909.
- [2] Aloisio, R., Blasi, P., 2002a, Astropart.Phys., accepted, astro-ph/0201310
- [3] Aloisio, R., Blasi, P., 2002b, Astropart.Phys., accepted, astro-ph/0201312
- [4] Anguelov, V., Vankov, H., 2000, J.Phys. G, 25, 1755
- [5] Ave, M. et al. 2000, Phys.Rev.Lett., 85, 2244
- [6] Ave, M. et al. 2002, Phys.Rev. D, 65, 063007
- [7] Baring, M.G., 1989, A&A, 225, 260.
- [8] Bednarek, W., 1999, astro-ph/9911266.
- [9] Bertou, X., Billoir, P., Dagoret-Campagne, S., 2000, Astropart.Phys., 14, 121.
- [10] Bhattacharjee, P., Sigl, G., 2000, Phys.Rep., 327, 109.
- [11] Erber, T., 1966, Rev.Mod.Phys., 38, 626.
- [12] Halzen, F. et al., 1990, Phys.Rev. D, 41, 342.
- [13] Hayashida, N., et al., 2000, astro-ph/0008102.
- [14] Karakuła, S., 1997, Proc. Vulcano Workshop 1996, ed. F. Giovannelli & G. Mannocchi (Italian Physical Society, Bologna, Italy), 57, 355.
- [15] Kasahara, K., 1997, Proc. Int. Symposium on Extremely High Energy Cosmic Rays: Astrophysics and Future Observatories, ed. M. Nagano (Univ. of Tokyo), p.221.
- [16] Landau, L.D., Pomeranchuk, I.J., 1935, Dokl. Akad. Nauk SSSR, 92, 535.
- [17] McBreen, B., Lambert, C.J., 1981, Phys.Rev. D, 24, 2536.
- [18] Migdal, A.B., 1956, Phys.Rev., 103, 1811.
- [19] Nagano, N., Watson, A.A., 2000, Rev.Mod.Phys., 72, 689.
- [20] Nelson, R.W., Wasserman, I., 1991, ApJ, 371, 265
- [21] Takeda, M., et al., 1999, ApJ, 522, 225.
- [22] Takeda, M., et al., 2001, Proc. ICRC 2001 (Hamburg), p. 341
- [23] Sakaki, N. et al., 2001, Proc. ICRC 2001 (Hamburg), p. 333
- [24] Shinozaki, S. et al., 2002, ApJ, 571, L117.
- [25] Stanev, T., Vankov, H.P., 1997, Phys.Rev. D, 55, 1365.
- [26] Tinyakov, P.G., Tkachev, I.I., 2001, Phys.Rev.Lett., 85, 1154
- [27] Wdowczyk, J., Wolfendale, A.W. 1990, ApJ, 349, 35.
| shower | Z | P() | eV) | P() | P() | ||
| 01/05/10 | 2.46 | 1.00 | 133.2 | 1.00 | 0.975 | ||
| 93/12/03 | 2.13 | 1.00 | 99.0 | 0.80 | 0.27 | ||
| 94/07/06 | 1.34 | 1.00 | 89.8 | 0.975 | 0.68 | ||
| 99/09/22 | 1.04 | 1.00 | 76.6 | 0.715 | 0.30 | ||
| 96/01/11 | 1.44 | 0.98 | 71.2 | 0.29 | 0.06 | ||
| 96/10/22 | 1.05 | 0.97 | 69.5 | 0.185 | 0.035 | ||
| 93/01/12 | 1.01 | 0.96 | 65.7 | 0.165 | 0.02 | ||
| 01/04/30 | 1.22 | 0.945 | 42.0 | 0.265 | 0.025 | ||
| 97/03/30 | 1.50 | 0.705 | 50.1 | 0.02 | 0.0 | ||
| 98/06/12 | 1.20 | 0.465 | 28.9 | 0.01 | 0.0 | ||
| 84/12/17 | 0.98 | 1.00 | 73.4 | ||||
| 92/09/13 | 0.93 | 0.65 | 33.0 | ||||
| 91/11/29 | 0.91 | 0.05 | 1.4 | ||||
| 95/01/26 | 0.776 | 1.00 | 65.5 | ||||
| 99/07/28 | 0.716 | 0.995 | 61.6 | ||||
| 99/01/22 | 0.753 | 0.51 | 25.0 | ||||
| 96/11/12 | 0.746 | 0.065 | 3.8 | ||||
| 98/03/30 | 0.693 | 1.00 | 62.3 | ||||
| 84/12/12 | 0.681 | 0.93 | 49.5 | ||||
| 93/06/12 | 0.649 | 0.915 | 47.0 | ||||
| 98/10/27 | 0.611 | 0.795 | 40.1 | ||||
| 86/10/23 | 0.622 | 0.48 | 20.8 | ||||
| 99/10/20 | 0.619 | 0.00 | 1.0 | ||||
| 91/05/31 | 0.553 | 0.935 | 50.2 | ||||
| 92/08/01 | 0.550 | 0.925 | 46.1 | ||||
| 98/04/04 | 0.535 | 0.855 | 41.7 | ||||
| 96/10/06 | 0.568 | 0.85 | 43.2 | ||||
| 91/04/03 | 0.509 | 0.725 | 32.9 | ||||
| 86/01/05 | 0.547 | 0.375 | 14.9 | ||||
| 95/10/29 | 0.507 | 0.295 | 12.8 | ||||
| 95/04/04 | 0.579 | 0.265 | 9.7 | ||||
| 89/03/14 | 0.527 | 0.245 | 10.4 | ||||
| 92/02/01 | 0.553 | 0.005 | 2.8 |