Chandra Observation of MS 1455.0+2232 : cold fronts in a massive cooling flow cluster?
Abstract
We present the Chandra observation of the cluster of galaxies MS 1455.0+2232. From previous ASCA and ROSAT observations, this cluster was identified as a “relaxed” cluster that hosts one of the most massive cooling flows detected. We observe a sharp brightness peak and a temperature decrease toward the center. With higher angular resolution, the Chandra X-ray image shows the presence of two surface brightness edges on opposite sides of the X-ray peak: the first, with a surface brightness jump of a factor , at kpc to the north and the second, with a jump factor of , at kpc to the south. Even though the low exposure of this observation limits our ability to constrain the temperature jump across both edges, we show that the northern edge is likely to be a “cold front” similar to others observed recently by Chandra in the clusters A2142, A3667, RX J1720.1+2638, and A2256. The observed cold front is most likely produced by the motion, from south to north, of a group-size dark matter halo. The most natural explanation for the presence of this observed moving subclump is that MS 1455.0+2232 is a merger cluster in the very last stage before it becomes fully relaxed. This scenario, however, appears to be unlikely as the cluster shows no further sign of ongoing merger. Moreover, it is not clear if a massive cooling flow could have survived this kind of merger. We propose an alternative scenario in which, as for RX J1720.1+2638, MS 1455.0+2232 is the result of the hierarchical collapse of two co-located density perturbations, the first a group-scale perturbation collapse followed by a second cluster-scale perturbation collapse that surrounded, but did not destroy, the first. We suggest that a cooling flow may have begun inside the already collapsed group-scale perturbation and may have been later amplified by the gas compression induced by the infall of the overlying main cluster mass.
1 Introduction
With its high angular resolution, Chandra has recently discovered surface brightness edges in several clusters of galaxies. Even though surface brightness edges are theoretically expected in shock fronts, these edges are indeed the result of a new unpredicted phenomenon. In fact, they show a temperature variation across the edge that goes exactly in the opposite direction to what is predicted in a shock front: the temperature in front of the shock (on the less bright side of the edge) is higher than the “post shock” temperature (on the brighter region of the edge). For this reason these newly discovered edges have been called “cold fronts” (Vikhlinin, Markevitch, & Murray 2000a). As the first cold fronts were discovered in two merging clusters A2142 (Markevitch et al. 2000b) and A3667 (Vikhlinin et al. 2000a,b), it has been suggested that they are produced by the relative motion of the gas cloud of the merging subclump with respect to the gas of the main clusters. Successively Chandra revealed the presence of a cold front in the cluster of galaxies RX J1720.1+2638. Unlike the first two, the X-ray image of RX J1720.1+2638 is azimuthally symmetric at large radii, it shows no other signs of an ongoing merger, and the moving gas cloud appears to be centered on the cluster center (Mazzotta et al. 2001). Moreover the gas cloud speed is subsonic, much smaller than that expected for a point mass free-falling from infinity into the cluster center (, where is the speed of sound; see e.g. Sarazin 1988).
To reconcile this apparent “relaxed” appearance of RX J1720.1+2638 with the presence of a moving gas cloud, it has been proposed that either the cluster is in the last stage of a merger before it becomes fully relaxed or it is the result of the collapse of a group of galaxies followed by the collapse of a much larger, cluster-scale perturbation at nearly the same location in space (Mazzotta et al. 2001).
Both scenarios raise a number of questions about the formation history of the cluster and/or the “inefficiency” of tidal disruption forces. To differentiate among the possibilities and to better understand the dynamics of cluster formation, it is important to search for evidence of motion, such as cold fronts, also in other apparently “relaxed” clusters whose characteristics are similar to those of RX J1720.1+2638.
In this paper we present the Chandra observation of the cluster of galaxies MS 1455.0+2232. This cluster was previously observed by ASCA and ROSAT. From these observations it was classified as a “relaxed” cluster hosting one of the most massive cooling flows observed ( yr; Allen et al. 1996).
The Chandra image reveals the presence of two surface brightness edges on opposite sides of the X-ray peak. We show that one edge cannot be produced by a shock front but rather indicates that it is a cold front. We discuss the possible implication of the presence of a cold front in a massive cooling flow cluster.
The structure of the paper is as follows. In 2 we describe the imaging and spectral analysis ( 2.1 and 2.2, respectively). In 3.1 we discuss the nature of the observed surface brightness edges, while in 3.2 and 3.3 we discuss the implications of the presence of a cold front for the cluster dynamics and the X-ray mass determination, respectively. Finally in 4 we give our conclusions.
We use km s-1 kpc-1, , and , which imply a linear scale of 5.0 kpc per arcsec at the distance of MS1455.0+2232 (). Unless specified differently, all the errors are at confidence level for one interesting parameter.
2 Data analysis
MS 1455.0+2232 was observed on May 2000 in ACIS-I with an exposure of ksec. Hot pixels, bad columns, chip node boundaries, and events with grades 1, 5, and 7 were excluded from the analysis. We extracted the light curve from chip S2, and verified that the observation presents no strong background rate variations on time scales of a few hundred seconds.
In our spectral and imaging analysis, we used the public background dataset composed of several observations of relatively empty fields taken from Feb. to Sept. 2000. These observations were screened in exactly the same manner as the cluster data. The total exposure of the background dataset is about 400ks. The background spectra and images were normalized by the ratio of the respective exposures. This procedure yields a background that is accurate to % based on comparison to other fields; this uncertainty is taken into account in our analysis (see Markevitch et al. 2000a for a description of the ACIS background modeling).
2.1 Imaging Analysis
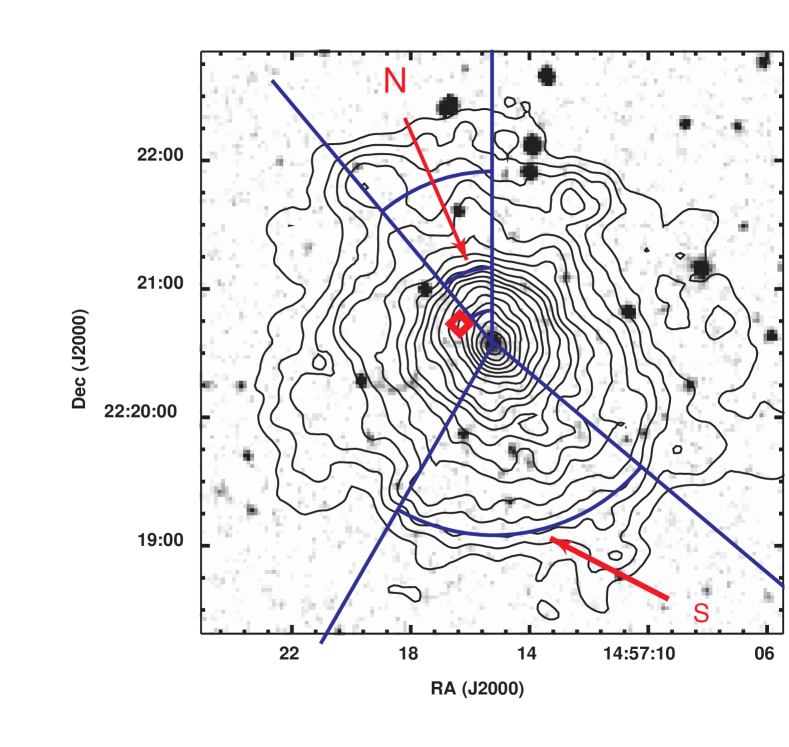
To study the X-ray morphology of the cluster we generated an image with pixels from the events in the chips I0, I1, I2, and I3. We extracted the image in the 0.5-8 keV band and corrected for vignetting. In Fig. 1 we show the ACIS-I, X-ray contours (after an adaptive smoothing of the image with a circular top hat filter with a minimum of 20 counts under the filter) on the DSS optical image. The X-ray brightness peak is located at (). Thus it coincides, within 1 arcsec, with the optical center of the cluster central galaxy ( (Allen et al. 1992).
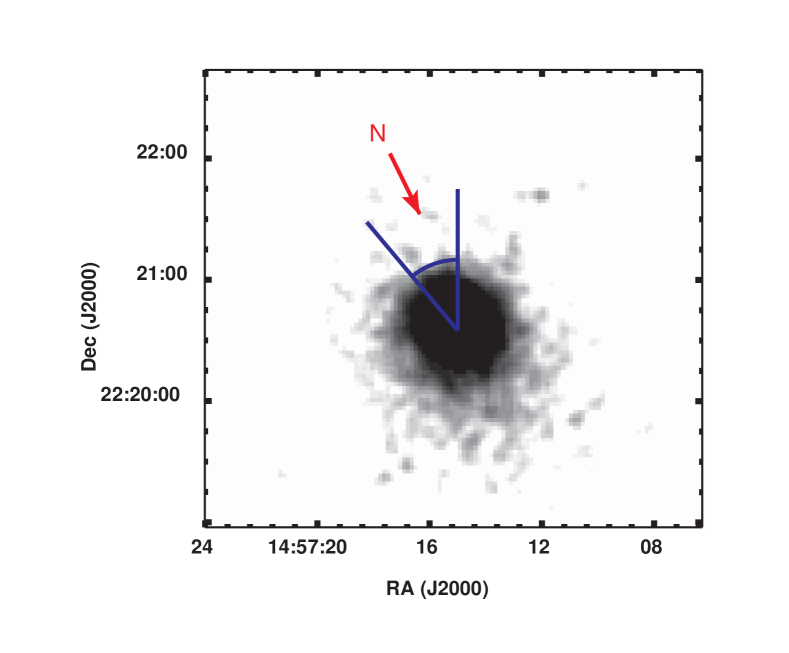
The isointensity contours show that there is a steep gradient (edge) in the surface brightness at a distance of ( kpc) from the center to the north. To better visualize the surface brightness edge, in Fig. 2.1 we show the photon image of the cluster in the keV energy band, binned to , after a Gaussian smoothing with pixel. The image clearly shows that the edge remains sharp in a wide sector whose angles are from to (hereafter northern-sector; the position angles are measured from North toward East) before gradually vanishing. We notice that MS 1455.0+2232 exhibits one lensed arc inside the northern edge, at from the cluster central galaxy (see e.g. Le Fevre et al. 1994; Luppino et al. 1999) (red diamond in Fig. 1). Besides the strong surface brightness edge to the north, the isointensity contours show that the clusters is elongated to the South-West. Moreover, in a sector from to (hereafter southern-sector), the surface brightness shows a smaller surface brightness edge at ( kpc) from the X-ray peak.
2.1.1 Density Profile
To study the gas density distribution across the surface brightness edges, we extracted the surface brightness profiles, in the keV energy band, from the north and south sectors defined above and shown in Fig. 1. From each sector we extracted the surface brightness profile using annuli centered in the X-ray peak. The surface brightness profiles of the northern and southern sectors are shown in Fig. 2.1.1a and Fig. 2.1.1a, respectively. From these figures it is possible to see that the northern and the southern edges correspond to surface brightness jumps of factor and , respectively. From the same figures, it is clear that the first derivative of the surface brightness profile is discontinuous on angular scales . This particular shape of the brightness profiles may indicate a discontinuity in the gas density profile.

To quantify this discontinuity, we fit both brightness profiles with a simple radial density model composed of two power-laws:
| (1) |
The model is characterized by a density discontinuity (“jump”) by a factor at the radius . For simplicity, we projected the density model under the assumption of spherical symmetry. We ignore any gas temperature variation which represent a small correction () for the energy band we are using. The free parameters are the power law slopes and the position and the amplitude of the jump. To perform the fit we used the Sherpa package (A. Siemiginowska, in preparation). The best fit values with their errors are reported in Table 1. The best fit density models are shown in Fig. 2.1.1b and Fig. 2.1.1b while the corresponding brightness profiles are overlaid as histograms on the data points on Fig. 2.1.1a and Fig. 2.1.1a. We find that the best fit density jump factors are and for the northern and the southern density profiles, respectively.
TABLE 1
Density Model Fit
| Sector | |||||
|---|---|---|---|---|---|
| (arcsec) | |||||
| N | 17.5/19 | ||||
| S | 3.5/5 |

2.2 Spectral Analysis
Spectra were extracted in the 0.8-9.0 keV band in PI channels that correct for the gain difference between the different regions of the CCDs. The spectra were then grouped to have a minimum of 50 net counts per bin and fitted using the XSPEC package (Arnaud 1996). To extract spectra we used the CIAO 2.1.1 package (M. Elvis, in preparation). Both the redistribution matrix (RMF) and the effective area file (ARF) for all the CCDs are position dependent. In our spectral analysis we computed position dependent RMFs and ARFs and weighted them by the X-ray brightness over the corresponding image region using “calcrmf” and “calcarf” software 111A. Vikhlinin 2000, (http://asc.harvard.edu/ “Software Exchange”, “Contributed Software”)..
TABLE 2
Comparison of Spectral Fits for the innermost 200′′region
| Model | (keV) | ( cm-2) | (Solar) | ( yr-2) | d.o.f. |
|---|---|---|---|---|---|
| WABSMEKAL | – | 105/103 | |||
| WABSMEKAL | – | 105/102 | |||
| WABS(MEKAL | 105/102 | ||||
| +MKCFLOW) |
To account for the flux discrepancy between the back-illuminated and front-illuminated chips that characterize the current (as of June 2001) combination of spectral response matrices and quantum efficiency curves (see Vikhlinin 2000) we multiplied all the ARFs by a position independent fudge factor of 0.93 for keV.

2.2.1 Average Temperature
To check for consistency with previous observations, we extracted an overall spectrum for MS 1455.0+2232 in a circular region with centered on the X-ray peak and fitted it using different models as listed in Table 2. First, we used an absorbed single temperature thermal Mekal model (see e.g. Kaastra, 1992; Liedahl, Osterheld, & Goldstein, 1995; and references therein) fixing the equivalent hydrogen column to the Galactic value ( cm-2). We find that the resulting temperature keV is within the error of the temperature obtained from ASCA (, see Allen et al. 1996). Freeing does not improve significantly the spectral fit; the best fit is consistent with the galactic value and is significantly lower than the ASCA result cm-2 (Allen et al. 1996). Finally, we added a cooling flow component. In this case the abundance of heavy elements is linked between the two components and the lowest gas temperature is fixed at 0.02 keV. We find no significant improvement for with respect to the single temperature model. Because we restricted our spectral analysis to keV, our data do not allow us to constrain very well the cooling flow mass deposition rate, but we can place a upper limit of yr-1, significantly lower than the cooling rate inferred from the ASCA data ( yr-1; Allen et al. 1996). We notice that this result appears to be consistent with the finding of other authors who show that the cooling rates derived from Chandra data using the standard cooling flow model are 5-10 times lower than earlier estimates (see e.g. McNamara et al. 2000; David et al. 2000; but see Allen et al. 2000).
The total absorbed cluster flux in the 2-10 keV energy band, measured with ACIS, is erg cm-2 s-1, which is 8% higher than the ASCA value (Allen et al. 1996). Conversely the flux in the 0.1-2.4 keV energy band is erg cm-2 s-1 consistent with the ROSAT value (Ebeling et al. 1998). The flux corresponds to a luminosity at 0.1-2.4 keV in the source rest frame of erg s-1.
2.2.2 Temperature Profile
To measure the temperature profile we divided the cluster into five circular annuli centered in the X-ray peak. We extracted the spectra from each annulus and we fitted them with an absorbed single temperature Mekal model. We fixed the equivalent hydrogen column to the Galactic value and the metallicity to the cluster mean . The resulting temperature profile is shown in Fig. 2.2. The cluster appears to be non-isothermal as it shows a temperature decrement both in the cluster core ( kpc) and perhaps at kpc.
To understand the nature of the observed surface brightness edges we need to measure the temperature variation across the edges. Because of the short exposure of this observation, the statistics are rather poor. To measure the temperature profile in the northern sector we extracted spectra in a slightly larger sector whose angles are from -15 to 60. In Fig. 2.1.1 we report the result of our fits. The profile suggests a temperature rise as one moves outward across the northern brightness edge, although with marginal significance. The present observation yields no statistically significant temperature difference across the southern edge.
3 Discussion
3.1 Nature of the surface brightness edges
In 2.1 we noted that the X-ray image of MS 1455.0+2232 presents two surface brightness sharp edges one to the north and another to the south of the X-ray peak. These edges correspond to surface brightness jumps of a factor and for the northern and southern edges, respectively. In 2.1.1 we argue that these edges are consistent with jumps in the cluster density profile of factors and , respectively. Such density discontinuities can either indicate the presence of shock fronts in a gas flow (see Landau & Lifshitz 1959) or the presence of cold fronts like those observed in A2142, A3667, RX J1720.1+2638, and A2256 (Markevitch et al. 2000; Vikhlinin et al. 2000a, Mazzotta et al. 2001, Sun et al. 2001).
To distinguish among the two phenomena it would be sufficient to measure the gas temperature on opposite sides of the gas discontinuities. In a shock front the temperature on the external side of the edge is lower than the temperature on the internal side, in a cold front the temperature variation goes in the opposite direction.
From the present data it is not possible to identify the nature of the southern edge, due to the short exposure.
In 2.2.2 we argued that, even though the statistics are rather poor, the temperature profile of the northern sector indicates a temperature rise as one moves outward across the edge. By using the temperature and density measurements across the edge, it appears unlikely that the observed northern edge may be a shock front. In fact, if we apply the Rankine-Hugoniot shock jump condition (see Landau & Lifshitz 1959,§§82-85), to the factor of density jump with the post shock temperature of keV (the inner region of the SE edge), we would expect to find a keV gas in front of the shock. This temperature is lower than that observed at confidence level (see Fig. 2.1.1c). We conclude that the northern edge is most likely a cold front as has been observed in other clusters by Chandra.
3.2 Cold front and cluster dynamic
The presence of a cold front to the north of the cluster may indicate that MS 1455.0+2232 hosts a moving group size ( kpc) gas cloud. Because the observed edge is particularly sharp, we may expect that the gas cloud direction of motion is close to the plane of sky (Mazzotta et al. 2001). Vikhlinin et al. (2000a) showed that the gas cloud speed depends only on the pressure variation across the edge. Unfortunately, the errors on the temperature estimates are too large to obtain a statistically interesting velocity measurement. However, in 2.1 we noted that the cluster is quite azimuthally symmetric and that the X-ray peak is coincident with the central cD galaxy. These properties are similar to those found in RX J1720+2638 (Mazzotta et al. 2001). Thus, because the gas cloud is moving in a plane close to the plane of the sky, it is likely that, as for RX J1720+2638, it is slowly oscillating around the minimum of the potential well. If the gas in the cloud is associated with a similar-sized dark matter subclump, then we may assume that the gas approximately traces the underlying dark-matter halo. This means that the cluster may host a moving group sized subclump in its center.
One possible explanation for the presence of this central moving subclump is that the cluster experienced a recent merger. In this scenario the moving subclump is the remaining part of the merging object that already has passed through the cluster center several times. This may indicate that the subclump has a quite compact structure otherwise it would be easily destroyed by the tidal forces during multiple core crossings. From the deprojection analysis of Allen et al. (1996) we see that the integrated gravitational mass at kpc is of the gravitational mass at kpc. If we assume that most of the gravitational mass inside kpc belongs to the merger subclump, than we can estimate that the ratio between the masses of the merging objects was something between 3 to 5. Moreover, as the moving subclump shows no offset with respect to the cluster centroid, we may also assume that it was a head-on merger. In 2.2.1 we show that, even though the inferred mass deposition rate obtained from the Chandra data is significantly lower than that obtained from ASCA, we cannot exclude that this cluster hosts a massive (or moderate) cooling flow. Regardless of the presence of a cooling flow, it contains a distinct cool gas cloud. If MS 1455.0+2232 is a merger, then it is not clear if that a massive cooling flow (or cool central gas) would have survived the merger (see e.g. Roettiger, Loken, & Burns 1997, but see also Fabian & Daines 1991).
An alternative scenario to explain the presence of the moving subclump is that, as proposed for RX J1720+2638, MS 1455.0+2232 is the result of the collapse of two different perturbations in the primordial density field on two different linear scales at nearly the same location in space. As the density field evolves, both perturbations start to collapse. The small scale perturbation collapses first and forms a central group of galaxies while the larger perturbation continues to evolve to form a more extended cluster potential. The central group of galaxies could have formed slightly offset from the center of the cluster and is now falling into or oscillating around the minimum of the cluster potential well. This motion is responsible for the observed surface brightness discontinuity. As the initial position of the subclump lies well within the main cluster, we may also expect the velocity of the infalling subclump to be subsonic. In the hierarchical cosmological model for structure formation, density perturbations on different linear scales evolve independently and on different time scales. So, at the time when the group had already formed, the larger scale perturbation was still expanding with the Hubble flow. In this scenario, any cooling flow may have started to develop in the collapsed group of galaxies much before the the cluster virialized. Because of the low speed of the central group, the cooling flow would not have been destroyed by infall into the cluster center but rather might have been amplified by the gas compression induced by the infall of the surrounding mass of the main cluster.
Regardless of the cluster formation history it appears clear that the surface brightness edge strongly indicate a dual gravitational potential structure for this system. This would be consistent with a recent finding by Williams & Navarro (1999) who claim that the giant arc observed in MS 1455.0+2232 (and in other clusters too) can be explained in terms of cold dark matter halos only if the mass at the center is significantly increased by the presence of a massive central galaxy (or small group).
3.3 Cold fronts and X-ray mass estimates
While there is good agreement between the X-ray and the weak lensing mass estimates, for some systems the X-ray mass estimate is a factor lower than that obtained from strong lensing (see e.g. Miralda-Escudé, & Babul 1995, but see Allen 1998; and reference therein). MS 1455.0+2232 is one of these peculiar systems. The mass estimate based on the arc in the northern sector (see Fig. 1) is a factor of 1.8 times larger than the X-ray estimate obtained from ASCA and ROSAT observations (Wu & Fang 1997; Wu 2000).
The arc on which the strong lensing measure is based is just inside the northern edge. This is particularly interesting as Mazzotta et al. (2001) pointed out that, if a cold front is present in a cluster of galaxies, the X-ray mass profile could be underestimated at radii smaller than the position of the density discontinuity. The X-ray mass underestimate depends strongly on the temperature variation along the edge. Unfortunately our temperature measurements are not accurate enough to estimate this effect. A longer exposure observation is needed to verify if this effect may account for the observed mass discrepancy.
4 Conclusion
We have presented the results of a short Chandra observation of the cluster of galaxies MS 1455.0+2232. The data show two surface brightness edges on opposite side of the X-ray peak consistent with discontinuities in the density profile. The structure of the edges is similar to the “cold fronts” observed by Chandra in the clusters A2142, A3667, RX J1720.1+2638, and A2256. Even though the low exposure of this observation limits our ability to constrain the temperature jumps across the edges, we show that the northern edge is likely to be a cold front produced by the subsonic motion from the south to the north of the central group-size cloud of gas within the cluster.
We discussed the possibility that MS 1455.0+2232 is an ongoing merger with merging object mass ratio of 3-5. Moreover, the merger is most likely head-on.
We also discussed the possibility that, as proposed for RX J1720.1+2638, MS 1455.0+2232 is the result of the collapse of a group of galaxies followed by the collapse of a much larger, cluster-scale perturbation at nearly the same location in space.
We also mentioned that, because of the motion of the central gas cloud, the hydrostatic equilibrium equation may underestimate the true cluster mass in the cluster core. Thus, such motion may be responsible for the discrepancy between the X-ray and the strong lensing mass determinations found for this system.
References
- (1)
- (2) Allen, S. W. et al. 1992, MNRAS, 259, 67
- (3)
- (4) Allen, S. W., 1998, MNRAS, 296, 392
- (5)
- (6) Allen, S. W., Fabian, A. C., Edge, A. C., Bautz, M. W., Furuzawa, A., & Tawara, Y. 1996, MNRAS, 283, 263
- (7)
- (8) Allen, S. W., Taylor, G.B., Nulsen, P.E.J., Johnstone, R.M., David, L.P., Ettori, S., Fabian, A.C., Forman, W., Jones, C., McNamara, B. 2000, MNRAS, in press (astro-ph/0101162)
- (9)
- (10) Arnaud, K. A. 1996, ASP Conf Ser. 101, Astronomical Data Analysis Software and Systems V, 5, 17
- (11)
- (12) David, L.P., Nulsen, P.E.J., McNamara, B.R., Forman, W., Jones, C., Ponman, T., Robertson, B., Wise, M. 2000, ApJ, in press (astro-ph/0010224)
- (13)
- (14) Ebeling, H., Edge, A. C., Bohringer, H., Allen, S. W., Crawford, C. S., Fabian, A. C., Voges, W., & Huchra, J. P. 1998, MNRAS, 301, 881
- (15)
- (16) Fabian, A.C, & Daines, S.J. 1991, MNRAS, 252, 17
- (17)
- (18) Kaastra, J.S. 1992, An X-Ray Spectral Code for Optically Thin Plasmas (Internal SRON-Leiden Report, updated version 2.0)
- (19)
- (20) Landau, L.D., & Lifshitz, E. M. 1959, Fluid Mechanics (London: Pergamon)
- (21)
- (22) Le Fevre, O., Hammer, F., Angonin, M. C., Gioia, I. M., & Luppino, G. A. 1994, ApJ, 422, L5
- (23)
- (24) Liedahl, D.A., Osterheld, A.L., and Goldstein, W.H. 1995, ApJL, 438, 115
- (25)
- (26) Luppino, G. A., Gioia, I. M., Hammer, F., Le Fèvre, O., & Annis, J. A. 1999, A&AS, 136, 117
- (27)
- (28) Markevich, M. et al. 2000a, CXC memo (http://asc.harvard.edu/cal “ACIS”, “ACIS Background”)
- (29)
- (30) Markevitch, M., Ponman, T. J., Nulsen, P. E. J., Bautz, M. W., Burke, D. J., David, L. P., Davis, D., Donnelly, R. H., Forman, W. R., Jones, C., Kaastra, J., Kellogg, E., Kim, D.-W., Kolodziejczak, J., Mazzotta, P., Pagliaro, A., Patel, S., VanSpeybroeck, L., Vikhlinin, A., Vrtilek, J., Wise, M., Zhao, P. 2000b, ApJ, 541, 542
- (31)
- (32) Mazzotta, P., Markevitch, M., Vikhlinin, A., Forman, W. R., David, L. P., & VanSpeybroeck, L., 2001a, ApJ, 555, 205
- (33)
- (34) McNamara, B. R. et al. 2000, ApJ, 534, L135
- (35)
- (36) Miralda-Escudé, J. & Babul, A. 1995, ApJ, 449, 18
- (37)
- (38) Roettiger, K., Loken, C. & Burns J.O. 1997, ApJ, 109, 307
- (39)
- (40) Sarazin, C. L. 1988, X-Ray Emission in Cluster of Galaxies (Cambridge: Cambridge Univ. Press)
- (41)
- (42) Sun, M., Murray, S.S., Markevitch, M., Vikhlinin, A., 2001, ApJ, submitted (astro-ph/0103103)
- (43)
- (44) Vikhlinin, A., Markevitch, M., Murray, S.S. 2000a, ApJ, 551, 160
- (45)
- (46) Vikhlinin, A., Markevitch, M., Murray, S.S. 2000b, ApJ, 549, L47
- (47)
- (48) Williams, L. L. R., Navarro, J. F., & Bartelmann, M. 1999, ApJ, 527, 535
- (49)
- (50) Wu, X. & Fang, L. 1997, ApJ, 483, 62
- (51)
- (52) Wu, X. 2000, MNRAS, 316, 299
- (53)