The Location of the Nucleus and the Morphology of Emission Line Regions in NGC 1068
Abstract
This paper presents new NICMOS data on the location of the nucleus and the morphology of hydrogen and [SiVI] emission in NGC 1068. The peak of the emission at 2.2 is a strong point source which marks the location of the nucleus. The [SiVI] line emission region consists of two main components, a diffuse region of coronal emission to the north-northeast of the nucleus and a bright emission spot from the nucleus along the direction of the radio jet. A similar but less intense emission spot also occurs in the hydrogen Paschen and WFPC2 H images. The accurate determination of the nuclear position and its relation to the emission line morphology produces a clearer picture of the nature of the interaction between the radio jet and its surroundings.
1 INTRODUCTION
As the nearest Seyfert 2 galaxy, NGC 1068 is the subject of many morphological studies. Since the central engine is hidden from direct optical view by surrounding dust, the exact location of the nucleus has been the subject of some debate. Previous optical studies with the Hubble Space Telescope (HST) (Capetti, Macchetto, & Lattanzi, 1997; Capetti et al., 1995) inferred the nuclear position from polarization and astrometry studies. Ground based studies at wavelengths longer than 2 directly image the nucleus (Bock et al., 2000, 1998; Thatte et al., 1997) but are limited by atmospheric seeing or the accuracy of the astrometry relative to galactic features. The NICMOS camera 2 observations directly observe the nucleus at 2.2 and image known emission line features in the Paschen line, firmly establishing the location of the nucleus relative to those features.
The existence of coronal [SiVI], [SiVII] and [SiX] emission in NGC 1068 is well established by ground based spectroscopic studies (Oliva & Moorwood, 1990; Moorwood & Oliva, 1993; Thompson, 1996). The relative strengths of the silicon emission lines pointed to a hard spectrum photoionizing source as the primary excitation for the majority of the emission. It was assumed that this source was the nuclear central engine. The [SiVI] image presented in this work shows that the [SiVI] emission is spatially separated into at least two components with the possibility of different excitation sources for each component as discussed in Section 6. A similar separation of excitation components has been suggested by Kraemer & Crenshaw (2000a).
2 OBSERVATIONS
The observations utilized in this work are part of an extensive imaging campaign with the HST infrared instrument, NICMOS, on two classic Seyfert galaxies, NGC 1068 and NGC 4151. This study utilizes the line and continuum filters for the [Fe II] 1.64 line, (F164N, F166N), Paschen 1.875 line, (F187N, F190N) and [SiVI] 1.96 line, (F196N, F200N). The camera 2 molecular hydrogen and continuum filter images were also inspected to insure that the [SiVI] images were not contaminated with molecular hydrogen emission from the H2 S5 (1-0) line emission at 1.97 . The small redshift of NGC 1068 (z = 0.0038) shifts part of the line emission out of the bandpass of the narrow band line filters so quantitative measurements are difficult. From ground based infrared spectra and the width of the filters we estimate that about 1/3 of the flux falls outside of the bandpass, depending on the intrinsic width of the line. All of the images were taken in an eight point spiral dither pattern. The dither step sizes are for camera 1 and 2 and for camera 3 observations. The WFPC2 F658N filter minus continuum H image is from the HST archive (proposal 5754) and has been processed to remove cosmic ray hits and other features. It is discussed in Capetti, Axon, & Macchetto (1997).
3 DATA REDUCTION
The NICMOS images were reduced utilizing IDL based procedures developed for image production in the Hubble Deep Field (Thompson et al., 1999). The strong point-like emission from the nucleus was used to accurately align the dithered images. Emission line images were produced by subtraction of the associated continuum filter images from the line filter images. Although the line and continuum filter wavelengths are very close together, there is still a contiuum level difference between the line and continuum filters in very red objects such as the nucleus of NGC 1068. To compensate, the intensity of the continuum image was scaled to produce the best subtraction measured by the strength of the residuals in the nuclear region. Even with this adjustment the high contrast between the nucleus and the surrounding line emission produces significant residuals within the nuclear region. The area contained within the first two Airy rings does not accurately reflect the true emission levels and is not used in this analysis. High residuals are not unexpected since the ratio of nuclear continuum emission to line emission is 125 to 1 for Paschen and 4000 to 1 for [SiVI].
4 POSITION OF THE NUCLEUS
In all NICMOS images at wavelengths of 1.6 or longer there is a strong, unresolved, extremely red, source that displays Airy rings and a diffraction pattern. We assume that this source is either the nucleus or the emission from hot dust centered on the nucleus. Thompson & Corbin (1999) put a limit on the width of the point source as which corresponds to a diameter of 2 pc in NGC 1068 based on the distance of 14 Mpc for a Hubble constant of 75 km sec-1 Mpc-1. This is consistent with the limit of Weinberger, Neugebauer, & Matthews (1999) utilizing ground based speckle observations. The point source accurately marks the position of the nucleus relative to the emission features observed in the line images. Recent radio observations, Roy et al. (1998) e.g., have accurately mapped the radio emission in the region and identified the source designated S1 as the position of the nucleus. VLBA observations by Gallimore, Baum and O’Dea (1997) of a disk with H2O and OH maser emission from the S1 source leaves little doubt that this is the nuclear position. We assume that S1 and our observed nuclear point source are coincident in the following analysis. The very similar features between the NICMOS Paschen and the WFPC H image then register the nuclear position and the radio emission to both the optical and infrared emission line features. Within the error bars, the nuclear position determined from the NICMOS images is consistent with the position given by Kishimoto (1999) in his reanalysis of the FOC data used by Capetti et al. (1995). It is also coincident with the optical feature designated cloud B by Evans et al. (1991). The coincidence is accurate to 0.04 arc seconds, the half width of a NICMOS camera 2 pixel.
5 MORPHOLOGY OF THE EMISSION REGION
As is the case with the optical emission, each stretch of the image emphasizes a particular aspect of the emission morphology. No single stretch reveals all of the features so we will describe some of the features in the text.
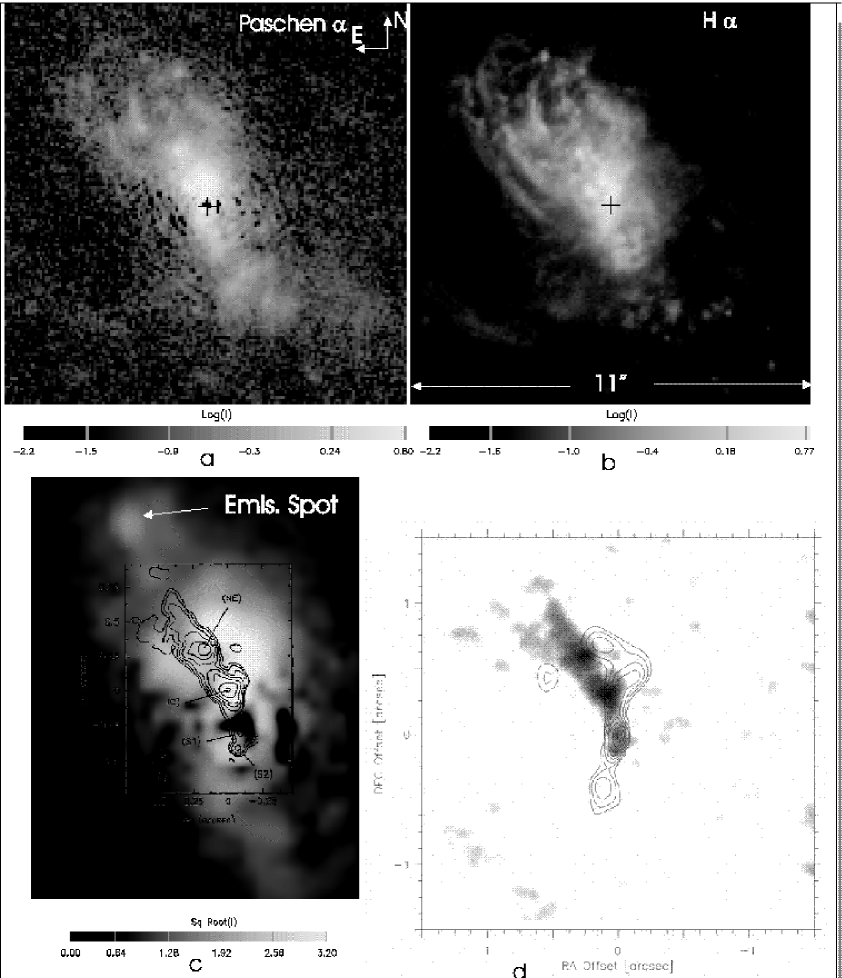
5.1 Hydrogen Emission Region
The black crosses in Fig. 1a and b indicates the location of the nucleus in the Paschen and H emission images. Fig. 1c shows the Paschen image at a different intensity stretch and spatial scale with the radio contours from Gallimore, Baum and O’Dea (1996) superimposed. The units on the radio contour are in arc seconds. The radio source S1 has been placed at the location of the infrared point source as discussed in section 4. Fig. 1d shows the radio emission image along with the 12.5 mid IR emission contours from Bock et al. (2000). The emission region near the nucleus is best observed in H (Fig. 1 b) which is not affected by strong nuclear emission.
After the bend in the radio jet the most intense hydrogen emission is mainly to the north of the radio jet. It is generally believed that the bend in the jet is due to an interaction with a dense cloud. The emission region to the north may be the dense cloud which is being ionized on its front face by the nuclear source. Note that the jet points directly at an emission spot to the northeast that is seen both in the H and the Paschen images. The spot appears faintly just above the upper left corner of the radio contours bounding box in Fig. 1c. The wispy arms of emission further to the northeast have a similar appearance in both the H and Paschen images.
5.2 H Emission and Mid IR Emission
Comparison of the morphology of the Paschen emission and the mid IR 12.5 emission (Fig. 1c and d) shows remarkable similarity. Bock et al. (2000) also placed their peak emission at the location of S1. They find the mid IR emission region falls north of the bend in the radio jet in a feature they term the tongue. Their mid IR emission continues further south than the Paschen emission, probably because the southern ionization cone penetrates into the plane of the sky and the higher extinction attenuates the Paschen emission more than the mid IR emission. A logical explanation for the coincidence of emission is dust entrained into the HII region ionized by the central source. This is similar to Galactic HII regions where the strengths of the mid IR emission and the hydrogen emission lines are well correlated. The lack of a true point source at the nucleus in the mid IR observations is probably due to warm dust extending further from the source than the extremely hot dust emission that dominates the 2 emission.
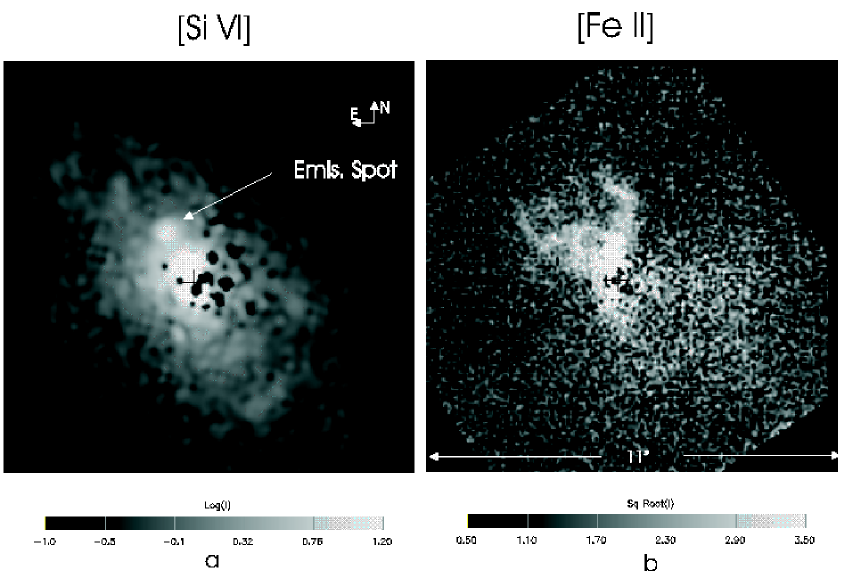
5.3 [SiVI] and [FeII] Emission Region
Fig. 2a and b show the forbidden [SiVI] coronal emission and [FeII] emission images at the same spatial scale and location. The [SiVI] image was taken by NICMOS camera 3 with pixels as opposed to the pixel camera 2 Paschen image. Within the differences of resolution, the [SiVI] and hydrogen images are the same with strong emission near the nucleus and an emission spot, cloud G of Evans et al. (1991), along the direction of the radio jet. The emission spot in the Si image, however, is much stronger relative to the total Si emission than its counterpart in Paschen emission. The wispy extended hydrogen emission arms are only faintly seen in the Si image even at a very high stretch. The [SiVI] emission line strength is much less than the Paschen line and the pixels are larger, hence the residuals near the nucleus are much stronger. It should be emphasized that the Paschen and [SiVI] emission spot discussed here is not at the location of the ”hot spot” discussed by Kraemer & Crenshaw (2000a) which is located near the nucleus.
The [FeII] emission image is bright in the wispy arms but does not show the emission spot seen in the Si and hydrogen images. The [FeII] image was taken with the pixel NICMOS camera 1 and has poorer signal to noise than the other images.
6 INTERPRETATION
The radio emission is generally interpreted as synchrotron and thermal bremsstrahlung emission from a jet bent by an encounter with material outside of the nucleus. The excess mid-IR, Paschen and [SiVI] emission to the north and west of the radio jet may represent the material that is producing the bend. If the geometry discussed below is correct this material has a direct view of the nucleus and is ionized by its radiation field. The H and [SiVI] emission regions monitor the material that can see the central engine and hence are photoionized. The analysis of the coronal [Si] emission by Thompson (1996) showed that the [Si] line ratios were not consistent with a shock heated emission region but were consistent with ionization by a hard radiation field with a spectral index between and .
The location of the secondary peak of emission, or emission spot, in both H and [SiVI] along the direction of the radio jet, but beyond the region of strong radio emission, suggests that the jet has impacted material outside of the nucleus at this point. Further evidence for material blocking the jet is the reduction of H emission beyond the emission spot except in thin wispy arms on either side of the emission spot. A similar mechanism was proposed earlier by Axon et al. (1998) for the emission region 0.1 arc seconds south of the emission spot.
The [SiVI] emission spot contains only 1/8 of the flux of the total [SiVI] emission. The results of Thompson (1996), which could not resolve the two regions is, therefore, still consistent with photoionization for the majority of the emission. The analysis by Alexander et al. (2000) of low spatial resolution NGC 1068 spectra from several sources favors a two component ionizing mechanism. Kraemer & Crenshaw (2000a) also find another source of ionizing radiation for emission at distances greater than 100 pc from the nucleus in the northeast direction, which is the location of the emission spot. Kraemer & Crenshaw (2000b) attribute the blue shifted emission at this location as due to fast shocks resulting from the interaction of the emission line knots with the interstellar medium. This may be true for some of the other emission knots but the geometry of this particular emission spot seems to point to the jet as the most likely source of the interaction. The lack of [Fe II] emission at the spot is most likely due to Fe being predominantly in higher ionization states at that location. This is supported by the observation of Pécontal et al. (1997) that cloud G is a maximum in the [FeVIII]/[OIII] intensity ratio.
7 CONCLUSIONS
The NICMOS high resolution infrared images of NGC 1068 are consistent with the general picture of a black hole nucleus, surrounded by an obscuring torus, with ejection of material via jets perpendicular to the plane of the torus. Interaction of the jet with material 0.5 arc seconds north of the nucleus deviates the jet as seen in the radio emission maps. This material is illuminated by the nucleus and can be seen in both hydrogen and Si emission. The jet eventually impacts other circumnuclear material creating an emission spot in both H and Si. The coincidence of the Paschen emission and the mid IR features is probably due to dust entrained in the HII region in a manner similar to that observed in Galactic HII regions.
References
- Alexander et al. (2000) Alexander, T., Lutz, D., Sturm, E. Genzel, R., Sternberg, A. & Netzer, H. 2000, ApJ, 536, 710
- Axon et al. (1998) Axon, D. J., Marconi, A., Capetti, A., Macchetto, F. D., Schreier, E. & Robinson, A. 1998, ApJ, 496, L75
- Bock et al. (2000) Bock, J. J. et al. 2000, AJ, 120, 2904
- Bock et al. (1998) Bock, J. J., Marsh, K. A., Ressler, M.E., & Werner, M .W. 1998, ApJ, 504, L5
- Capetti et al. (1995) Capetti, A., Axon, C. J., Macchetto, F. D., Sparks, W. E. & Boksenberg, A. 1995, ApJ, 452, L87
- Capetti, Macchetto, & Lattanzi (1997) Capetti, A., Macchetto, F. D., & Lattanzi, M. G. 1997, ApJ, 476, L67
- Capetti, Axon, & Macchetto (1997) Capetti, A., Axon, D. J., & Macchetto, F. D. 1997, ApJ, 487, 560
- Evans et al. (1991) Evans, I. N., Ford, H. C., Kinney, A. L., Antonucci, R. R. J., Armus, L. & Caganoff, S. 1991, ApJ, 369, L27
- Gallimore, Baum and O’Dea (1996) Gallimore, J. F., Baum, S. A., & O’Dea, C. P. 1996, ApJ, 494, 198
- Gallimore, Baum and O’Dea (1997) Gallimore, J. F., Baum, S. A., & O’Dea, C. P. 1997, Nature, 388, 852
- Kishimoto (1999) Kishimoto, M. 1999, ApJ, 518, 676
- Kraemer & Crenshaw (2000a) Kraemer, S. B. & Crenshaw, D. M. 2000a, ApJ, 532, 256
- Kraemer & Crenshaw (2000b) Kraemer, S. B., Crenshaw, D. M. 2000b, ApJ, 544, 763
- Moorwood & Oliva (1993) Moorwood, A. F. M. & Oliva, E. 1993, in ASP Conf. Proc. 41, Astronomical Infrared Spectroscopy: Future Observational Directions, ed. S. Kwok (San Francisco: ASP), 305
- Oliva & Moorwood (1990) Oliva, E. & Moorwood, A. F. M. 1990, ApJ, 348. L5
- Pécontal et al. (1997) Pécontal, E., Ferruit, P., Binette, L.,& Wilson, A. S. 1997, Ap&SS, 248, 167
- Roy et al. (1998) Roy, A. L., Colbert, E. J. M., Wilson, A. S., & Ulvestad, J. S. 1998, ApJ, 504, 147
- Thatte et al. (1997) Thatte, N., Quirrenbach, A., Genzel, R., Maiolino, R., & Tecza, M. 1997, ApJ, 490, 238
- Thompson (1996) Thompson, R. I. 1996, ApJ, 459, L61
- Thompson et al. (1999) Thompson, R. I., Storrie-Lombardi, L. J., Weymann, R. J., Rieke, M. J.,Schneider, G., Stobie, E., & Lytle, D. 1999, AJ, 117, 17
- Thompson & Corbin (1999) Thompson, R. I. & Corbin, M. 1999,Ap&SS, 266, 79
- Weinberger, Neugebauer, & Matthews (1999) Weinberger, A. J. , Neugebauer, G., & Matthews, K. 1999, AJ, 117, 2748