Evidence for Reionization at : Detection of a Gunn-Peterson Trough in a Quasar11affiliation: Based on observations obtained at the W.M. Keck Observatory, which is operated as a scientific partnership among the California Institute of Technology, the University of California and the National Aeronautics and Space Administration, made possible by the generous financial support of the W.M. Keck Foundation, and with the Sloan Digital Sky Survey, which is owned and operated by the Astrophysical Research Consortium. 22affiliation: This paper is dedicated to the memory of Arthur F. Davidsen (1944–2001), a pioneer in the study of the intergalactic medium and a leader in the development of the Sloan Digital Sky Survey.
Abstract
We present moderate resolution Keck spectroscopy of quasars at , 5.99 and 6.28, discovered by the Sloan Digital Sky Survey (SDSS). We find that the Ly absorption in the spectra of these quasars evolves strongly with redshift. To , the Ly absorption evolves as expected from an extrapolation from lower redshifts. However, in the highest redshift object, SDSSp J103027.10+052455.0 (), the average transmitted flux is times that of the continuum level over 8450 Å 8710Å (), consistent with zero flux. Thus the flux level drops by a factor of , and is consistent with zero flux in the Ly forest region immediately blueward of the Ly emission line, compared with a drop by a factor of at . A similar break is seen at Ly; because of the decreased oscillator strength of this transition, this allows us to put a considerably stronger limit, , on the optical depth to Ly absorption at .
This is a clear detection of a complete Gunn-Peterson trough, caused by neutral hydrogen in the intergalactic medium. Even a small neutral hydrogen fraction in the intergalactic medium would result in an undetectable flux in the Ly forest region. Therefore, the existence of the Gunn-Peterson trough by itself does not indicate that the quasar is observed prior to the reionization epoch. However, the fast evolution of the mean absorption in these high-redshift quasars suggests that the mean ionizing background along the line of sight to this quasar has declined significantly from to 6, and the universe is approaching the reionization epoch at .
1 Introduction
Recent discoveries of quasars at redshifts of 5.8 and greater (Fan et al. 2000, Fan et al. 2001a, hereafter Paper I) are finally allowing quantitative studies of the status of the intergalactic medium (IGM) and the history of reionization at redshifts near 6. The absence of a Gunn-Peterson trough (Shklovsky 1964, Scheuer 1965, Gunn & Peterson 1965) in the spectrum of the quasar SDSSp J104433.4–012502.2 (SDSS 1044–0125 for brevity, Fan et al. 2000; see Goodrich et al. 2001 for an updated redshift based on the CIV line in the near-infrared) indicates that the intergalactic medium (IGM) is already highly ionized at , presumably by the UV ionizing photons from quasars and star-forming galaxies at high redshift. In Paper I, we used the low resolution discovery spectra of the three new quasars at , taken with the ARC 3.5m telescope at Apache Point Observatory, to show that Ly absorption increases significantly from a redshift of 5.5 to a redshift of 6.0. In particular, the spectrum of the quasar SDSSpJ 103027.10+052455.0 shows that in a Å region of the Ly forest immediately blueward of the Ly emission line, the flux level is consistent with zero, indicating a flux decrement of , and suggesting a possible detection of the complete Gunn-Peterson trough. To more accurately quantify this effect, and to constrain the properties of the IGM, we have obtained higher resolution spectra of the three new quasars using the Echelle Spectrograph and Imager (ESI; Epps & Miller 1998) on the Keck II telescope.
In section 2 we describe the observations and present the spectra of all four quasars in the sample of Fan et al. (2001a). We measure the emission line redshifts of the three new quasars using these spectra. In section 3, we discuss the properties of the Ly forest in the four spectra from the point of view of the overall opacity of the IGM as a function of redshift. In section 4 we discuss the cosmological implications of the results.
2 Spectroscopic Observations
SDSSp J083643.85+005453.3 (), SDSSp J130608.26+035626.3 () and SDSSp J103027.10+052455.0 (, referred to as SDSS 0836+0054, SDSS 1306+0356 and SDSS 1030+0524 throughout this paper for brevity) were selected as -dropout objects from the Sloan Digital Sky Survey (SDSS, York et al. 2000) multicolor imaging data. They were further separated from cool dwarfs using follow-up -band photometry, and discovery spectra were obtained using the Double Imaging Spectrograph (DIS), a low-resolution spectrograph () on the ARC 3.5m telescope at the Apache Point Observatory (Paper I).
In March and May, 2001, we obtained moderate resolution spectra of these three high redshift quasars, using ESI on the Keck II telescope. The spectra were taken in the echellette mode of ESI. In this mode, the spectral range from 4000 to 10000 Å is covered in ten spectral orders with a constant dispersion of 11.4 km s-1 pixel-1. With a plate scale ranging from 0.142′′ to 0.128′′ per pixel in the three reddest orders, the slit has a footprint of 81–90 km s-1 and the typical seeing has a footprint of 57–63 km s-1. Using the sky lines in the spectrum, we estimate that the Full Width at Half Maximum of the instrument profile is Å at Å, indicating a spectral resolution of 66 km s-1, or , almost 10 times higher than that of the discovery spectra. Wavelength calibration is based on observations of Hg-Ne-Xe lamps and Cu-Ar lamps. The ESI has active flexure control that minimizes any drift in the wavelength calibration or fringing pattern. This is especially important for accurate sky subtraction – a crucial step in detecting the faint flux in the quasar Ly forest region in the presence of strong sky emission lines. The spectrophotometric standard G191-B2B (Massey 1988, Massey & Gronwall 1990) was observed for flux calibration. The standard star, observed at similar airmass as the quasars, was also used for tracing the spectra in the spectral region where little flux is detected from the quasar due to strong Ly absorption. All the observations were made at the parallactic angle. Data reduction made use of standard IRAF routines along with a suite of custom analysis routines that handle the large curvature, highly non-linear photometric response, and slight tilt of the sky lines in the ESI instrument. The dates and durations of the exposures are given in Table 1.
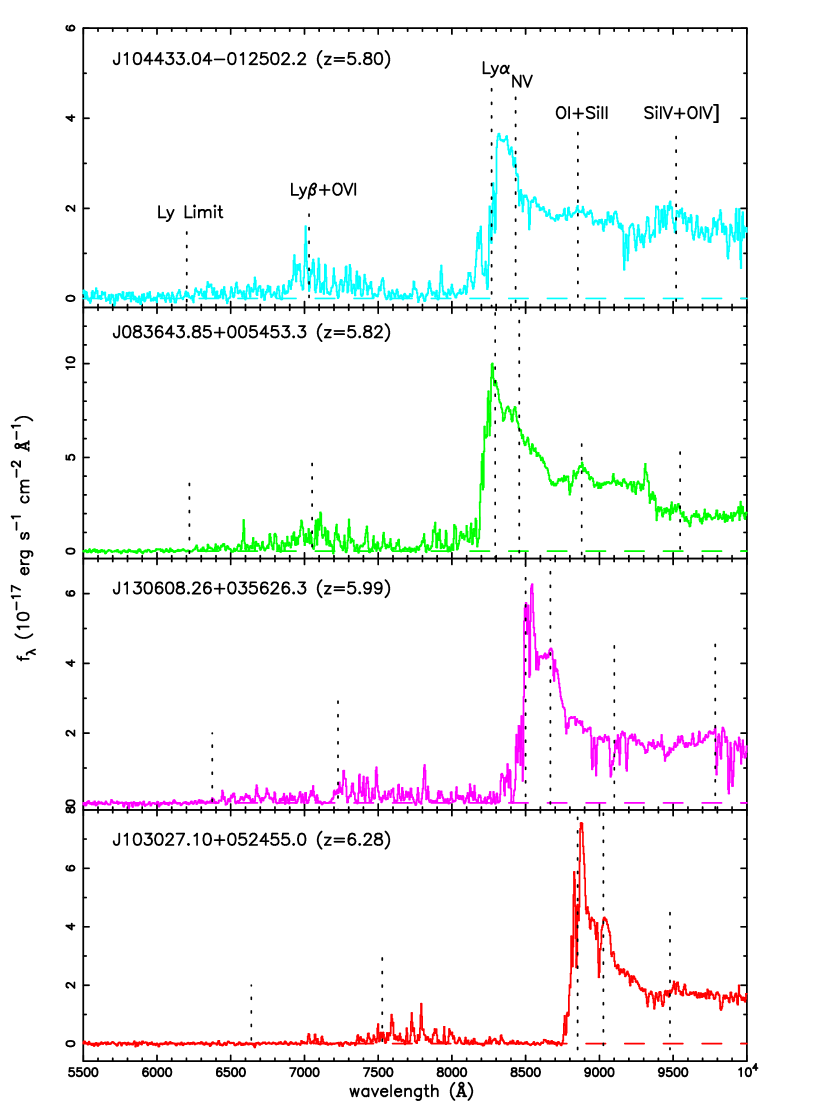
The three spectra are displayed in Figure 1, along with the spectrum of SDSS 1044–0125, which was observed an year earlier with the same instrument setting (Fig. 2 of Fan et al. 2000). The spectra are binned to 4Å pixel-1 to improve the signal-to-noise ratio, and the flux levels are adjusted to match the band photometry presented in Paper I. Each pixel is weighted by the inverse square of the estimated noise on that pixel when the high resolution spectrum is binned to low resolution. It is clear from a visual inspection of the four spectra that the flux level blueward of Ly decreases with increasing redshift, and is consistent with zero flux in SDSS 1030+0524.
Using these spectra, we first determine accurate redshifts from the emission lines. As discussed in Fan et al. (2000) and in Paper I, redshift determination of quasars using optical spectra is difficult, due to the weakness of the accessible metal emission lines and the effect of Ly forest absorption on the Ly emission line. The presence of associated metal absorption lines would also bias the result (Goodrich et al. 2001). The strong CIV emission line, now at Å, would provide a more reliable redshift measurement, but it lies beyond our spectral coverage for all our objects.
SDSS 1044–0125. As mentioned above, the displayed spectrum is from Fan et al. (2000). Djorgovski et al. (2001) present a higher signal-to-noise spectrum of SDSS 1044–0125, which shows the increasing optical depth of the Ly alpha forest with redshift particularly well.
SDSS 0836+0054. A strong OI+SiII1302 emission line is detected at Å, with a rest-frame equivalent width (EW) of 4.2Å. The Ly+NV emission line is very broad, with the peak wavelength of the Ly component at Å, and EW = Å. We adopt a redshift of 5.82, using the central wavelength of OI line, and a redshift error of 0.02, considering the uncertainty using a single line for redshift. The peak of the Ly emission line is consistent with this redshift. The EW of OI+SiII is comparable to that of the average of quasars (3.2Å, Schneider, Schmidt & Gunn 1991).
SDSS 1306+0356. The strong Ly+NV emission line shows a separate NV1240 component. We determine the central wavelengths and EWs of Ly and NV by fitting two Gaussian profiles to the wavelength range redward of the peak of Ly emission, i.e., the region not affected by the Ly forest absorption. The wavelength ratio of the two components is fixed in the fitting procedure. We find , EW(Ly) = 38.1 14.9Å, and EW(NV) = 17.9 6.3 Å. No obvious OI+SiII emission line is detected; any emission line there is probably affected by the CIV absorption feature at the same wavelength (see below). A possible SiIV1402 feature is detected at Å, but it is difficult to fit its profile due to the weakness of the line and possible absorption lines nearby. We therefore adopt a redshift of for SDSS 1306+0356.
In the spectrum of SDSS 1306+0356, we notice a strong absorption feature at Å, where over Å, there is no detectable flux. The rest-frame equivalent width is Å, typical for a damped Ly system, at a redshift of . A strong absorption feature is detected at Å, corresponding to CIV absorption at the same redshift. This feature is double peaked in absorption, consistent with the 1548, 1551 components of the CIV doublet, although the signal-to-noise ratio is low at that wavelength. This system, if confirmed by high signal-to-noise ratio spectroscopy, is the highest-redshift damped Ly system known (the previous record holder was at ; Péroux et al. 2001; Dessauges-Zavadsky et al. 2001). The two other doublet absorption features at Å and Å, are identified as MgII absorptions at and 2.20, respectively. Note that other spectra in this paper also show various absorption features redward of Ly emission. The detailed identifications of these metal lines are beyond the scope of this paper.
SDSS 1030+0524. In Paper I, we presented the Keck/NIRSPEC -band spectrum of this object, in which a strong CIV feature (EW = Å) is detected, at . The optical spectrum shows a separate NV emission line, and possible detection of OI+SiII and SiIV lines at the same redshift. We measure EW(Ly) = 40.9 7.4Å, and EW(NV) = 16.9 4.0 Å, by fitting Gaussian profiles to the blended Ly+NV emission line.
Paper I discusses the implication of the detection of metal emission lines, in particular, that of NV emission, to the metallicity of the quasar environment. Assuming a power law continuum of , the flux ratio NV/CIV is , consistent with a super-solar metallicity , according to the calculations of Hamann & Ferland (1993). Note, however, these calculations assume a single-zone photo-ionization model, and might be affected by the uncertainties in heavy element ratios, as well as possible enhancement of NV flux by resonant scattering from the red wing of the Ly emission line (Krolik & Voit 1998).
3 Neutral Hydrogen Absorption
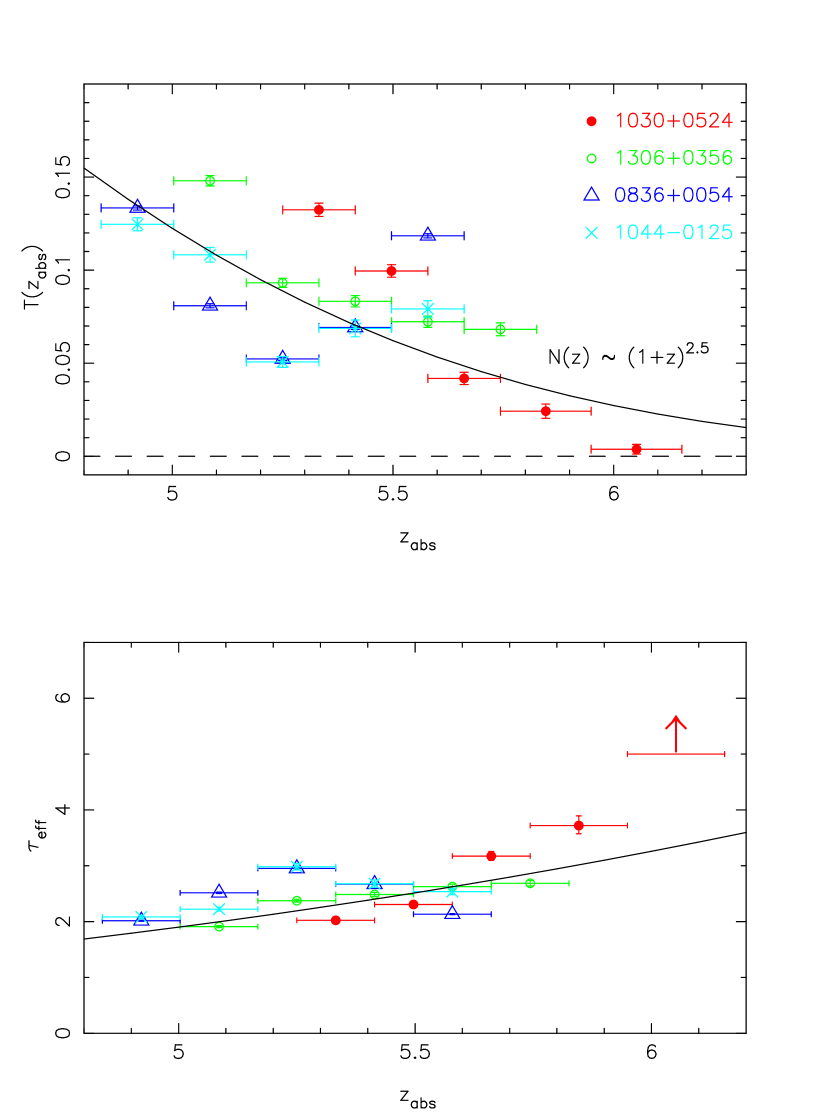
In Paper I, we calculated the average absorption in the Ly forest region based on the ARC 3.5m discovery spectra. Here we carry out these calculations with the Keck spectra. The results are summarized in Table 2. The table includes the measurement of the and parameters following Oke & Korycansky (1982), the average flux decrement in the Ly and Ly forest regions, respectively, as well as the transmitted flux ratio defined in Paper I, measured in the highest redshift window in each quasar that is not affected by the Ly emission line and the proximity effect. The definitions of these quantities are given in Paper I. The transmitted flux ratio is measured in the redshift range for all objects except SDSS 1030+0524, for which the range is . Additional measurements of this quantity along the line of sight to each quasar at lower redshift are illustrated in Figure 2. All the measurements here and below assume an intrinsic quasar continuum (), with the continuum normalized at rest frame wavelength of Å, a region free of major emission lines. The unknown continuum shape is a source of systematic error. However, for a wavelength window close to the Ly emission, and in the regime in which , this error is much smaller than the cosmic variance of (see below). As in Paper I, the error bars on the and measurements reflect the uncertainties of the continuum shape in the Ly forest region, while the error bars on include only the photon noise. In calculating the average flux and the photon noise, the signal in each pixel is weighted by the inverse square of the estimated noise level in that pixel. The values in Table 2 are consistent with the measurements in Paper I, albeit with errors lower by a factor of .
In Table 2, we also include the measurement of the redshift of the Lyman Limit System (), following the method described in Fan et al. (2000, §4.1). Note, however, at , the flux level at the rest-frame 912Å is so low due to the presence of numerous Ly forest lines from lower redshift, that this measurement is rather uncertain. The quasar spectra are consistent with no flux almost immediately blueward of rest-frame 912Å.
Figure 2 presents the evolution of the transmitted flux ratio and effective optical depth as a function of redshift . The average absorption evolves strongly with redshift. At , (e.g. Rauch et al. 1997). It decreases to at (Songaila et al. 1999). At , from Figure 2, and at , . The scatter of at the same redshift is larger than implied by photon noise or uncertainty of the continuum shape, suggesting that the error in is dominated by cosmic variance. Zuo (1993) calculated the scatter of the transmitted flux given the number density and column density distribution of Ly clouds. Using Eq. (9) in that paper, we find that at , for , , comparable to the scatter seen in Figure 2. For , is comparable to itself, and decreases rapidly toward higher redshift.
The only measurements of at come from the highest redshift object SDSS 1030+0524. It shows that . The most dramatic change in , however, comes from the measurement at ; over the redshift range , the average transmitted flux . This “detection” is in fact consistent with zero in our estimation; indeed, slight changes in the way we did our sky subtraction caused the value to change by of order . Thus there is no detectable flux over the wavelength range of Å, corresponding to a flux decrement of from the continuum level, or equivalently, to a lower limit (1-) on the Gunn-Peterson optical depth due to neutral hydrogen in the IGM of . At Å, the flux is detectable again, presumably due to the effect of the ionizing photons from the luminous quasar itself (§4). This result confirms the measurement based on the discovery spectrum (Paper I), in which we found . This is the first detection of a complete Gunn-Peterson trough, in the sense that no flux is detected over a large wavelength range in the Ly forest region, indicating that the effective Gunn-Peterson optical depth caused by neutral hydrogen in the IGM, , is much larger than one.
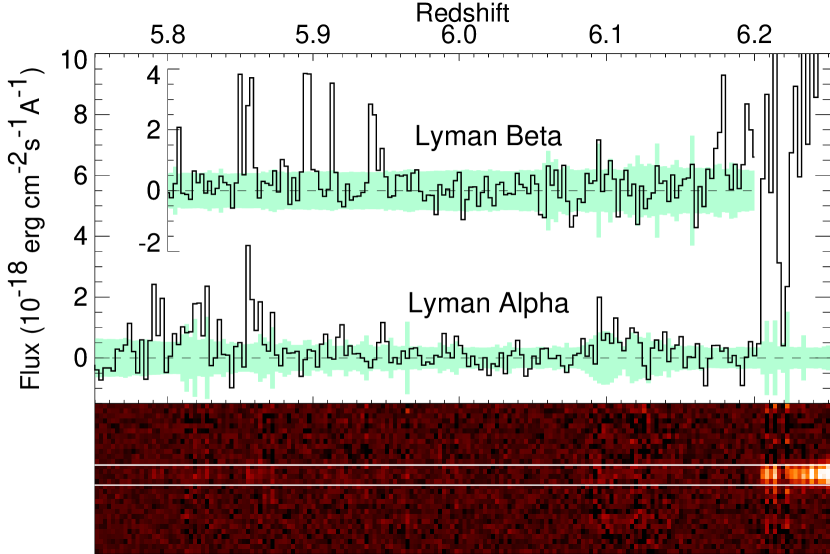
Figure 3 shows the sky-subtracted two-dimensional spectrogram from the ninth order of the ESI data; note the complete absence of detected flux blueward of the Ly emission line. Figure 3 also shows the one-dimensional spectrum and the corresponding estimated error per pixel (shaded) of SDSS 1030+0524 over the redshift range for both Ly and Ly. As evident from the figure, the average flux level is consistent with zero for at both lines (8450 – 8710 Å for Ly, and 7130 – 7350 Å for Ly).
The effective continuum at Ly is affected by the Ly forest. The effective Ly redshift at 7240 Å, the center of the Ly trough, is . Figure 2 shows that at that redshift, the transmission of the Ly forest is roughly 12%, albeit with large scatter (see also Songaila et al. 1999). Taking this into account, and again extrapolating the quasar continuum from redward of Ly emission assuming gives a measured transmitted flux ratio in the Ly trough of , a clear non-detection. The error does not include the uncertainty in the transmission of Ly at , which we estimate to be approximately 20% in based on the scatter seen in Fig. 2.
The ratio of oscillator strengths of the Ly and Ly lines is 5.27 (Verner, Verner, & Ferland 1996). Thus we can convert the transmitted flux ratio in the Ly forest region to an equivalent lower limit to the optical depth in the Ly forest region of (albeit with an uncertainty due to the limits of our model for the intrinsic spectrum). This limit is, in fact, considerably stronger than the limit obtained directly from the Ly forest itself.
At Å, there appears to be another break (Figure 1); this is the start of the corresponding Ly Gunn-Peterson trough. We have not attempted to obtain a quantitative optical depth for this line, due to the extreme overlapping absorption from both the Ly and Ly forests.
Our ability to constrain the upper limit of the flux in the Ly and Ly forest regions, and the corresponding lower limit to the Gunn-Peterson optical depth, depends on the reliability of sky subtraction. In this case, the expression “black as night” has special significance because invariably, upper limits to brightness come down to the accuracy with which one can subtract the sky. Unfortunately, the night sky is not very black, especially in the near IR region, where the sky emission is concentrated in a series of very bright OH lines that nearly blanket the spectrum. At the ESI resolution, the peak of the strongest sky lines at 8000 – 9000Å can be a factor of stronger than that of the darker region between lines. The high spectral resolution of ESI enables us to resolve the much darker regions between strong sky lines and limits the number of pixels affected by the sky lines. The pixels affected by strong sky lines are assigned much smaller weights when we calculate the average flux and effective optical depth. It is our considered opinion that in this instance, the data reduction posed no unusual difficulties and that the faint to nonexistent flux levels seen blueward of Ly are reliable. These problems are less severe in the spectral region of the Ly trough, and as we’ve seen, the two troughs give consistent limits on the mean optical depth.
4 Discussion
The Gunn-Peterson (1965) optical depth in a uniformly distributed IGM is given by
| (1) |
Only a small fraction of neutral hydrogen component in the IGM is needed to have and give rise to a complete Gunn-Peterson trough. Therefore, the existence of a Gunn-Peterson trough by itself does not prove that the object is observed prior to the reionization epoch. Even if the neutral fraction were independent of redshift, one still expects the transparency of the Ly forest to decrease with increasing redshift. In reality, the expansion of the universe and the increase in the ionizing background cause the neutral hydrogen fraction to decrease towards low redshift (see below). The observed redshift evolution of the Gunn-Peterson optical depth in the spectrum of SDSS 1030+0524 allows us to answer an important question: Is the amount of Ly forest absorption at consistent with a simple extrapolation from the observations at lower redshifts? Or does it indicate a more dramatic change in the state of the IGM?
Assuming that the number density of Ly forest lines evolves with redshift as , where at , the effective optical depth evolves as (Zuo & Phinney 1993, Zuo 1993). The solid line in Figure 2 shows an extrapolation of the optical depths to higher redshifts using this simple model. It is evident that the value from SDSS 1030+0524 deviates from this extrapolation; the observed absorption at is stronger than that predicted by this model assuming an ionization fraction that remains constant with redshift. A natural explanation for this difference is that the ionization fraction increases with time, i.e., the IGM was more neutral at earlier times.
Assuming that the hydrogen gas in the IGM responsible for the Ly forest absorption is in photoionization equilibrium, wherein photoionization of the neutral hydrogen by the UV background is balanced by recombination, one can express in equation (1) in terms of the ionizing background. Doing so, the Gunn-Peterson optical depth of a uniform IGM can be expressed as (Weinberg et al. 1997),
| (2) |
Here, is the Hubble constant at redshift , is the temperature of the IGM gas in units of 104K, and , the photo-ionization rate of hydrogen in units of s-1, depends on the shape and amplitude of the ionizing background. Thus, in a given background cosmology, the observed evolution of the Gunn-Peterson optical depth can be used to measure the redshift evolution of the ionizing background (e.g., McDonald et al. 2000). A more accurate determination of the ionizing background should also model the gravitational evolution of the Ly forest with redshift. Recently, McDonald & Miralda-Escudé (2001) used the transmitted flux measurement to calculate the evolution of ionizing background at . In a separate paper (Fan et al. 2001b), we use both semi-analytic models and cosmological simulations to investigate the evolution of the ionizing background at higher redshifts, using the measured transmitted flux ratios and effective optical depths at .
As discussed by Miralda-Escudé (1998), the spectra of sources observed prior to complete reionization should show the red damped wing of the Gunn-Peterson trough in the red side of Ly, due to the very large optical depth. This damped wing would, in principle, suppress the Ly emission line. However, as shown in Madau & Rees (2000) and Cen & Haiman (2000), luminous quasars such as those discussed in this paper would ionize the surrounding regions and create HII regions of radius several Mpc (the “proximity” effect; Carswell et al. 1982). The presence of these quasar HII regions results in a much higher transmission redward of Ly; thus the emission line profile is less affected by the red damped wing (see also Fan et al. 2001b). Therefore, the presence of the Ly emission line, and the absence of the red damped wing, are not by themselves indicators that the IGM was already ionized at this redshift. The true extent of the proximity effect in SDSS 1030+0524 is probably best defined by the transmission of Ly emission at a redshift of 6.18 (see Fig. 3).
The size of the HII region associated with the quasar depends on the luminosity and lifetime of the quasar and the clumpiness of the IGM. In principle, we could use the proximity effect to constrain the amplitude of the ionizing background (Bajtlik, Duncan & Ostriker 1988), by determining the distance from the quasar at which the optical depth of the Ly forest is half that in the Gunn-Peterson trough. However, we only have a lower limit on the latter, and so at best, we can only put a lower limit on the distance, and thus an upper limit on the ionizing background. We have calculated this upper limit, and find that it gives a much weaker constraint than comparing the data with detailed simulations (Fan et al. 2001b). Further, clumpiness of the gas distribution near the quasar on these length scales will also increase the absorption blueward of Ly, and hence lead to an artifically higher estimate of the ionizing background.
Could any local effect produce the apparent Gunn-Peterson trough in the spectrum of SDSS 1030+0524? A 300Å region at corresponds to a comoving distance of Mpc (, ), much larger than any large scale structure at that redshift. It is also unlikely to be a very strong damped Ly absorption system, as we do not see any corresponding metal lines (such as SiIV1402). We are not aware of any known damped Ly absorption line at lower redshifts with an EW of Å. At , it would have a rest frame EW of Å, and cm-2. Using the statistics of Storrie-Lombardi, Irwin & McMahon (1996), we expect to find only 0.02 such systems per unit redshift at . Moreover, one would expect to see associated metal lines from such a strong absorber, which are clearly not present.
However, we emphasize that the complete Gunn-Peterson trough is observed in only one (the highest-redshift) object, and if the reionization is non-uniform, one may not see exactly the same dependence of the Gunn-Peterson trough with redshift along other lines of sight. In order to gain a more complete understanding of the IGM at , more lines of sight are clearly needed. The SDSS is expected to find quasars at over the course of the survey (Paper I), so we can look forward to opportunities to study this question in detail over the next few years.
References
- Bajtlik, Duncan & Ostriker (1988) Bajtlik, S., Duncan, R.C., & Ostriker, J.P. 1988, ApJ, 327, 570
- Carswell et al. (1982) Carswell, R.F., Whelan, J.A.J., Smith, M.G., Boksenberg, A., & Tytler, D. 1982, MNRAS, 198, 91
- Cen & Haiman (2000) Cen, R., & Haiman, Z., 2000, ApJ, 542, L75
- Dessauges-Zavadsky et al. (2001) Dessauges-Zavadsky, M., D’Odorico, S., McMahon, R. G., Molaro, P., Ledoux, C., Péroux, C., & Storrie-Lombardi, L. J. 2001, A&A, 370, 426
- Djorgovski et al. (2001) Djorgovski, S. G., Castro, S. M., Stern, D., & Mahabal, A. A. 2001, ApJ, submitted
- Epps & Miller (1998) Epps, H.W., & Miller, J.S. 1998, Proc. SPIE, 3355, 48
- Fan et al. (2000) Fan, X., et al. 2000, AJ, 120, 1167
- Fan et al. (2001a) ——, 2001a, AJ, accepted, astro-ph/0108063 (Paper I)
- Fan et al. (2001b) ——, 2001b, in preparation
- Goodrich et al. (2001) Goodrich, R., et al. 2001, ApJ, submitted
- Gunn & Peterson (1965) Gunn, J. E., & Peterson, B. A. 1965, ApJ, 142, 1633
- Hamann & Ferland (1993) Hamann, F., & Ferland, G., 1993, ApJ, 418, 11
- Krolik & Voit (1998) Krolik, J., & Voit, M., 1998, ApJ, 497, L5
- Madau & Rees (2000) Madau, P., & Rees, M. J., 2000, ApJ, 542, L69
- Massey (1988) Massey, P. 1988, ApJ, 328, 315
- Massey & Gronwall (1990) Massey, P., & Gronwall, C. 1990, ApJ, 358, 344
- McDonald et al. (2000) McDonald, P.,Miralda-Escudé, J., Rauch, M., Sargent, W. L. W., Barlow, T. A., Cen, R., & Ostriker, J. P., 2000, ApJ, 543, 1
- McDonald & Miralda-Escudé (2001) McDonald, P., & Miralda-Escudé, J., 2001, ApJ, 549, L11
- Miralda-Escudé (1998) Miralda-Escudé, J., 1998, ApJ, 501, 15
- Oke & Korycansky (1982) Oke, J. B. & Korycansky, D. G. 1982, ApJ, 255, 11
- Péroux et al. (2001) Péroux, C., Storrie-Lombardi, L. J., McMahon, R. G., Irwin, M., & Hook, I. M. 2001, AJ, 121, 1799
- Rauch et al. (1997) Rauch, M., Miralda-Escudé, J., Sargent, W. L., Barlow, T. A., Weinberg, D. H., Hernquist, L., Katz, N., Cen, R., & Ostriker, J. P, 1997, ApJ, 489, 7
- Scheuer (1965) Scheuer, P. A. G., 1965, Nature, 207, 963
- Schneider, Schmidt & Gunn (1991) Schneider, D.P, Schmidt, M., & Gunn, J.E. 1991, AJ, 101, 2004
- Shklovsky (1964) Shklovsky, I.S., 1964, Astron. Zh. 41, 408
- Songaila et al. (1999) Songaila, A., Hu, E. M., Cowie, L., L., & McMahon, R. G. 1999, ApJ, 525, L5
- Storrie-Lombardi, Irwin & McMahon (1996) Storrie-Lombardi, L., Irwin, M., & McMahon, R., 1996, MNRAS, 282, 1330
- Verner, Verner, & Ferland (1996) Verner, D.A., Verner, E.M. & Ferland, G.J, 1996, Atomic Data Nuclear Data Tables, (San Diego: Academic Press), 64, 1
- Weinberg et al. (1997) Weinberg, D. H., Miralda-Escudé, J., Hernquist, L., & Katz, N., 1997, ApJ, 490, 564
- York et al. (2000) York, D. G., et al. 2000, AJ, 120, 1579
- Zuo (1993) Zuo, L. 1993, A&A, 278, 343
- Zuo & Phinney (1993) Zuo, L., & Phinney, E. S., 1993, ApJ, 418, 28
| Object | redshift( | Date | Exposure Time (seconds) |
|---|---|---|---|
| J104433.04–012502.2 | 5.80 | 2000 Mar 04 | 2 1200 |
| J083643.85+005453.3 | 5.82 | 2001 Mar 19 | 1200 |
| J130608.26+035626.3 | 5.99 | 2001 May 26 | 900 |
| J103027.10+052455.0 | 6.28 | 2001 May 26 | 2 900 |
| object | Transmitted flux ratio | |||||
|---|---|---|---|---|---|---|
| at | ||||||
| J104433.04–012502.2 | 5.80 | 5.72 | 0.90 0.02 | 0.95 0.02 | 5.5 | 0.088 0.004 |
| J083643.85+005453.3 | 5.82 | 5.80 | 0.92 0.02 | 0.95 0.02 | 5.5 | 0.106 0.001 |
| J130608.26+035626.3 | 5.99 | 5.98 | 0.91 0.02 | 0.95 0.02 | 5.7 | 0.070 0.003 |
| J103027.10+052455.0 | 6.28 | 6.28 | 0.93 0.02 | 0.99 0.01 | 6.05 | 0.004 0.003aaThe Ly trough gives a lower limit to the equivalent Ly optical depth of , which corresponds to an equivalent . |