1]Facultad de Ciencias Físicas, Universidad Complutense,
E-28040 Madrid, Spain
2]CIEMAT-Departamento Energías Renovables,
Plataforma Solar
de Almería, E-04080 Almería, Spain
3]Departamento de Lenguajes y Computación,
Universidad de Almería, 04120 Almería, Spain
4]Escuela Superior de Ingenieros, Universidad de Sevilla,
E-41012 Sevilla, Spain
5]Max-Planck-Institut für Physik, 80805 München, Germany
Very high-energy -ray observations of the Crab nebula with the GRAAL experiment
Abstract
The “Gamma Ray Astronomy at ALmería” (GRAAL) experiment
uses 63 heliostat-mirrors with a total mirror area
of 2500 m2
from the CESA-1 field to collect
Cherenkov light from airshowers.
The detector is located in a central solar tower and
detects photon-induced showers
with an energy threshold of 250 110 GeV and an
asymptotic effective
detection area
of about 15000 m2.
Data sets taken
in the period September 1999 - September 2000 in the direction of
the Crab pulsar were analysed
for high energy -ray emission.
Evidence for -ray flux from the Crab pulsar with an integral flux of
2.2 0.4 (stat) (syst)
10-9 cm-2 s-1 above threshold
and a significance of 4.5
in a total (usable) observing time of 7 hours and 10 minutes on source
was found. No evidence for emission from the other sources was seen.
The effect of field-of-view restricted to the central part
of a detected airshower on the lateral distribution and timing
properties of Cherenkov light and their effect on an efficient -hadron
separation are discussed.
1 Introduction
Measuring atmospheric Cherenkov radiation is presently the most effective way to detect cosmic -rays with primary energies between about 100 GeV and 1 TeV ([F.Krennrich]). In order to reach low energy thresholds with techniques based on Cherenkov light, large mirror collection areas are needed. GRAAL is an experiment that employs the large mirror area of an existing tower solar-power plant for this purpose.
2 The GRAAL detector
CESA-1 is a heliostat field comprising of 225
steerable mirrors to the north
of a central tower located within the
“Plataforma Solar de Almería”(PSA), a solar thermal-energy
research centre located in the desert of Tabernas
(37∘.095 N, 2∘.360 W) at a
height a.s.l. of 505 m.
The 63 heliostats used for GRAAL
have a mirror area of 39.7 m2 each and have a roughly spherical shape.
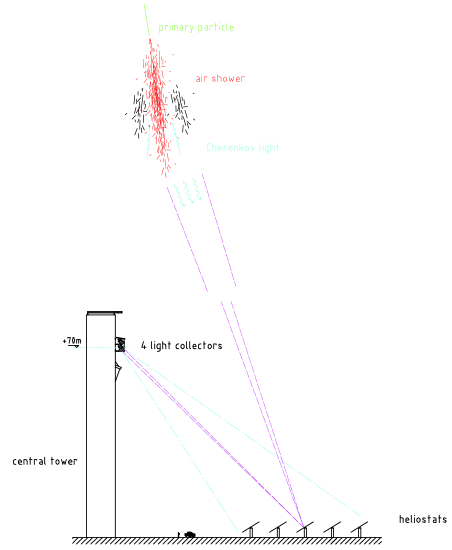
The heliostats focus the Cherenkov light of airshowers from
the direction of potential gamma-ray sources to
software adjustable “aiming points” in the central tower
(see fig.1).
Cherenkov light from four groups of heliostats
(with 13,14,18,18 members, respectively)
is directed onto four single non-imaging “cone concentrators” (truncated
Winston cones with an opening angle of 10∘)
each containing a single large-area PMT.
They are housed in a special enclosure that is fastened to the
outside of the central tower at a height of 70 m.
The incoming light from an air shower consists of a train of
pulses from the different heliostats,
usually fully separated
by pathlength differences. The arrival time and amplitude
of each heliostat can thus be determined with a flash-ADC in
a sequential mode.
Compared to the three other heliostat field experiments
(“CELESTE”([M. de Naurois et al.,2000]),“STACEE”([M.C. Chantell et al.,1998]) and
“Solar 2” ([A.Zweerink et al.,1999])) which focus the light of single
heliostats onto related single PMT’s, the night sky background (NSB) per
channel is about a factor 10 higher in GRAAL (8-10 p.e./ns). This leads to a
higher energy threshold.
The advantage of the non-imaging approach is its greater simplicity
leading to cost savings by about a factor 5-10 in hardware costs.
The presence of only four data-acquisition
channels makes automatization and
remote control more feasible, leading to comparable
savings in operation costs.
In the non-imaging approach it is impossible to avoid a temporal
overlap of the signal from certain heliostats depending on the
pointing direction. This reduces the number of times/amplitudes
usable in the reconstruction by about 20 .
On the positive side, calibration is easier when signals from several
heliostats are measured in the same PMT.
We register all four pulse trains
in only one Digital Oscilloscope
with a bandwidth of 1 GHz and a time bin of 500 psec.
This ensures that the FWHM of individual pulses of about 3.6 nsec
is negligibly increased by electronics effects.
The time and amplitude calibration
of our setup is performed using blue LEDs with a calibrator
module that is fastened at the window of the Winston cones.
All operations (like opening of the door, high-voltage
control etc.) at the central receiver and the tracking
of the heliostat field are under remote control via the internet. Under conditions
that indicate some malfunction, a physicist on shift is phoned by the PC
and can check all parameters and images of web cameras, remotely.
For the operation of the heliostat field and emergencies only the regular
night-operator of the PSA is on-site in all observation nights.
GRAAL is taking data continously since August 1999 (since March 2000 in the
final hardware configuration). Here we present data for the observation year
1999/2000 of the Crab nebula.
3 Event reconstruction
The different arrival times of the signals from the individual heliostats were
used to reconstruct the timing shower front of the individual events.
The expected arrival times for all heliostats in each of the
four cones were calculated and stored in a “library”
for a 5 5 degree grid
centered to a direction about 1 degree offset from the current
pointing direction of the heliostats. The offset was chosen to
avoid a bias towards “correct pointing”.
This calculation was performed assuming a point-like
shower-maximum at a penetration depth of 230 g/cm2
(the mean penetration of showers induced by a photon of 100 GeV)
in the pointing direction. A spherical timing-front was assumed
to be emitted by this maximum. The shower core was fixed at the
geometrical centre of the field as defined by the used heliostats (it was
verified that this assumption introduces no bias).
The measured arrival
times were compared to the “library”. We define the time difference
TIMEDIFF
| (1) |
The direction yielding the smallest with
| (2) |
was chosen as the final
reconstructed direction of the shower.
Fig.2 shows projections of reconstructed directions
in zenith and azimuth angle both for ON and OFF source directions
for a large data sample. The origin corresponds to the
pointing direction determined by the heliostat tracking.
The directions of events in the “smooth
background” extending to large off-axis angles were found to be systematically
misreconstructed. This effect was used in the later analysis to normalise ON
and OFF rates.

If the “misreconstructed” directions are excluded, the angular resolution (the opening angle within which 63 of all events are contained) is 0.7∘.
4 Data reduction
From a total measuring time of 32 hours, only nights in which all four detector channels and the heliostats in the field were functioning normally according to the recorded monitor files were chosen for further analysis. Furthermore, only data taken in “good nights”, i.e., with no clouds, low humidity, no dust, remained after our cuts. These “meteorological cuts” are severe under the weather conditions at the PSA. In the data sample on Crab in February/March 2000 only 22 of all data taken on the Crab pulsar passed all cuts.
| current [A] | q-rate[kHz] | mean q | raw events | rec. events | centr. events | |
|---|---|---|---|---|---|---|
| ON | 19.0 0.4 | 1.35 | 2.883 0.004 | 68702 | 33384 | 9415 |
| OFF | 19.3 0.3 | 1.49 | 2.876 0.004 | 75198 | 33056 | 8678 |
| EXCESS | -0.3 | -0.14 | 0.007 0.006 | -6496 | 328 258 | 737 165 |
The fundamental problem of all Cherenkov experiments - especially
for those attempting to detect an excess due to gamma-rays in the
total rate - is the fact that the night-sky background ON- resp. OFF-source
differs in general. This can influence the counting rate and
analysis efficiency in various ways.
Whereas random events can be removed (see section 6), the change of the
effective trigger threshold due to different noise levels in ON and OFF is a
more serious problem. Here, it was solved by applying a variable offline threshold,
calculated from the measured noise level in the related traces.
One can attempt to find an ON-source excess in the total number of events (see
section 6 below). A more sensitive method is to look for an excess in
the central angular region. The normalised excess EXCESSn was calculated according to the following equation:
| (3) |
Here stands for the number of events within 0.7∘ from the source, resp. off-source direction, stands for the number of events with directions deviating more than 2∘ from the source direction.
5 Results
Several parameters of the data set taken on Crab pulsar are presented in table 1. Fig. 3 shows the number of events as function of angular distance from the source direction, both for ON- and OFF-source direction and the normalised difference ON-OFF. An excess of events in the angular region expected from Monte Carlo (MC) simulations (fig.3) is seen, we find EXCESSn = 737 165 calculated according to eqn (3). The error is statistical. This corresponds to a 4.5 excess and a mean excess rate EXCESSnr = 1.7/min. An integral flux is calculated from this excess according to:
| (4) |
Here = 3.3 10-7 E-2.4 m-2s-1 TeV-1 dE is the integral gamma-ray flux from the Crab above a threshold energy Ethresh as observed by the Whipple collaboration ([A.M.Hillas et al.,1998]). rγ is the gamma-ray rate expected in GRAAL from the MC simulated effective area for gammas based on this flux (0.011 Hz). Note that the absolute Whipple flux cancels in eq. (4), and we only adopt the spectral index from ref. ([A.M.Hillas et al.,1998]).

rp is the proton rate expected in GRAAL
on the basis of the known absolute differential flux of cosmic-ray protons
and the effective
area for protons (4.0 Hz).
robs is
the observed cosmic-ray rate in the final reconstructed sample, corrected
for dead time (1.6 Hz)
.
The factor (robs/rp) is an
empirical correction for the fact that
our MC calculated
proton effective area
predicts a somewhat higher proton rate
than observed.
tc is a correction factor for the fact that some photons are
expected in the “outer angular region” and was determined as
2.2 from MC data.
The final integral flux above threshold
assuming a differential spectral source index of -2.4 is:
= 2.2 0.4 (stat) (syst)
10-9 cm-2 s-1 above threshold
\balance
6 Excess in total rate
If the detected excess (discussed in section 5) is real, one can
estimate that there
should be an excess of 2270 events within our measuring
time. On the other hand, extrapolating the Whipple flux for
Crab nebula ([A.M.Hillas et al.,1998]) at our energy threshold, only 355 excess events
are expected.
Due to
our trigger setup it can happen that the NSB triggers events if the NSB is
high. The rate of accidental events can be calculated from the single rates and subtracted from the
total rate.
Other corrections are related to the dead time of the setup.
Table 2 right column shows the results of a careful correction for these effects for the data of the
analyzed sample of Crab (see section 4). In the last column all the effects have
been corrected and the total time of measurement is 430 min in ON position and
the same time for OFF position. There is an excess in the OFF position
of 7234 events in the hardware-triggered events. After subtraction of
accidental events and corrections for dead time, the excess in the OFF position
is only 443 events, which is within the statistical fluctuations. For
orientation, a difference in the energy threshold of cosmic-ray protons
between ON and OFF of only
5GeV at an energy threshold of 2TeV already produces a difference of 550 events
for the same time of measurement and using the known cosmic-ray proton flux and a constant effective area of 8000 m2.
| Total events | Tot. correct. evs | |
|---|---|---|
| ON | 79194 | 58107 |
| OFF | 86428 | 58550 |
| EXCESS | -7234 575 | -443 483 |
In an alternative approach the software analysis rejects accidental events due to the low number of peaks and uncorrelated times of the peaks of such events. Less than 0.6 of the accidental events pass the analysis for a very similar NSB to the one of Crab sample. In our analysis, a higher NSB rejects more accidental events. As seen in the column 5 of table 1 also here there is no significant excess in the total rate. This lack of an excess in the total rate seems to cast a doubt on the reality of the signal discussed in section 5.
7 Conclusion
The results of the present measurements do not prove that the use
of an heliostat array in gamma-ray astronomy is a feasible alternative
to the use of dedicated Cherenkov telescopes.
The principle drawbacks of this approach were found
to be the restricted field of view and the weather conditions
at the relatively low elevation of the heliostat field.
The field-of view restriction leads to a very
similar time structure of the shower front in proton and gamma induced
showers and biases the direction reconstruction based in timing
towards to the pointing direction. Both effects together prevent any efficient
separation of proton and gamma induced showers.
This makes a flux determination independent of total rates difficult
(though not impossible) and severely limits the sensitivity of the experiment.
The fraction of time (total duty cycle)
with weather and moon-light conditions sufficient
for the detection of gamma radiation was about 3-4 at the PSA, about
a factor of 5 lower than at astronomical sites.
Both drawbacks seem to be unavoidable for the heliostat-field based approach also in the future.
Acknowledgements.
The GRAAL project is supported by funds from the DFG, CICYT and the IHP “Access to large scale facilities” program of the EU. We thank the PSA - in particular A.Valverde - for excellent working conditions at the CESA-1 heliostat field.References
- [F.Arqueros et al.,2001] F.Arqueros, J.Ballestrín, M.Berenguel, D.M.Borque, E.F.Camacho, M.Díaz, R.Enríquez, H-J.Gebauer, R.Plaga, Very high-energy -ray observations of the Crab nebula and other potential sources with the GRAAL experiment, submitted to Astroparticle Physics.
- [F.Krennrich] F.Krennrich, TeV Gamma-Ray Astronomy in the new Millennium, Proc. 7th Taipei Astrophysics Workshop, ASP Conference Series, Vol. XX, 2001, de. C.M. Ko,astro-ph/0101120.
- [M.C. Chantell et al.,1998] M.C. Chantell et al.(STACEE coll.) Prototype Test Results of the Solar Tower Atmospheric Cherenkov Effect Experiment (STACEE), astro-ph/9704037, Nucl.Inst.Meth. A408 (1998) 468.
- [A.Zweerink et al.,1999] J.A.Zweerink et al.,Proc. 26th ICRC 5 (1999) 223.
- [M. de Naurois et al.,2000] M. de Naurois et al. (CELESTE coll.), Status and current sensitivity of the CELESTE Experiment, astro-ph/0010265 (2000); J.Holder, Observation of Mkn 421 with the CELESTE Experiment, astro-ph/0010264 (2000).
- [A.M.Hillas et al.,1998] A.M.Hillas et al.,Astrophys.J. 503 (1998) 744.