The
star cluster system of the 3 Gyr old merger remnant NGC 1316:
Clues from optical and near-infrared photometry
Abstract
The giant merger remnant galaxy NGC 1316 (Fornax A) is an ideal probe for studying the long-term effects of a past major merger on star cluster systems, given its spectroscopically derived merger age of 3 Gyr which we reported in a recent paper (Goudfrooij et al. 2001). Here we present new ground-based, large-area optical and near-IR imaging of star clusters in NGC 1316. The ground-based photometry is complemented with deep Hubble Space Telescope WFPC2 imaging, constituting an excellent combination for studying globular cluster systems. We find that the optical-near-IR colours and luminosities of the brightest 10 clusters in NGC 1316 are consistent with those of intermediate-age (2 – 3 Gyr) populations. In particular, the near-IR data preclude ages 1.5 Gyr and 4 Gyr for those clusters. Unlike ‘normal’ giant ellipticals, the colour distribution of clusters in NGC 1316 is not clearly bimodal. However, the luminosity functions (LFs) of the blue and red parts of the cluster colour distribution are different: The red cluster LF is well represented by a power law, , extending to about 1.5 mag brighter (in ) than those of typical giant ellipticals. In contrast, the shape of the blue cluster LF is consistent with that of ‘normal’ spiral and elliptical galaxies. We conclude that the star cluster system of NGC 1316 is a combination of a population of age 3 Gyr having roughly solar metallicity and a population of old, metal-poor clusters which probably belonged to the pre-merger galaxies. After the 3 Gyr old, metal-rich clusters fade to an age of 10 Gyr, they will form a red ‘peak’ in a bimodal cluster colour distribution. This ‘red peak’ will have a colour consistent with that found in ‘normal, old’ giant ellipticals of the same galaxy luminosity (taking age dimming into account). The surface density profile of clusters in the innermost regions is lower than that of the integrated light of the galaxy, presumably due to the collective effect of extended star formation in the inner regions of NGC 1316 and tidal shocking of the inner clusters. Outside the core, the surface density profile of clusters is consistent with that of the underlying starlight, suggesting that the cluster system originally experienced the same violent relaxation as did the main body of the merger remnant. The specific cluster frequency is presently = 1.7 0.4 down to the 50 per cent completeness limit of the WFPC2 photometry, and will increase to 2.0 as the merger-induced stellar (and star cluster) population fades to an age of 10 Gyr (barring further merger events), consistent with specific frequencies of typical giant ellipticals in the field and in poor groups. These features of the star cluster system of NGC 1316 are fully consistent with scenarios for forming ‘normal’ giant elliptical galaxies through gas-rich mergers at look-back times 10 Gyr.
keywords:
galaxies: individual: NGC 1316 – galaxies: elliptical – galaxies: radio – galaxies: interactions – globular clusters: general1 introduction
Globular clusters (hereafter GCs) are among the few observable fossil records of the formation and evolution of galaxies. Their nature as simple stellar population (hereafter SSP) significantly simplifies the determination of their ages and metallicities relative to that of the stellar populations that constitute the integrated light of their parent galaxies. In our Galaxy, they have yielded crucial information on early chemical enrichment, the formation time scale of the galactic halo, the presence of a ‘thick disk’, and an estimate for the age of the universe. While the relative faintness of extragalactic GCs has long prevented one from obtaining high-quality photometry and (especially) spectroscopy, the Hubble Space Telescope (HST) and large ground-based telescopes now allow this goal to be achieved.
One important, well-known aspect of GC systems among galaxies is that the number of clusters per unit galaxy luminosity (named the specific frequency ) increases systematically from late-type to early-type galaxies, being 2–3 times higher in elliptical (E) than in spiral galaxies of type Sb and later (Harris & van den Bergh 1981; Harris 1991). This fact has been used as an argument against the scenario for forming ellipticals through mergers: van den Bergh (1995) argued that if ellipticals form through gas-rich mergers during which star (and GC) formation occurs with a normal (e.g., Salpeter (1955)) initial mass function (IMF), the of the resulting merger remnant galaxies should not be significantly different from the progenitor galaxies since both GCs and stars would have been formed during the merger. On the other hand, recent observations with the HST have led to a wealth of discoveries of young GCs in merging and starburst galaxies (e.g., Holtzman et al. 1992; Whitmore et al. 1993, 1999; Meurer et al. 1995; Schweizer et al. 1996; Miller et al. 1997). Indeed, the formation of young stars in high-density regions of starbursts seems to occur preferentially within star clusters rather than unbound associations (Meurer et al. 1995; Schweizer et al. 1996), most probably from giant molecular clouds whose collapse is being triggered by a 100– to 1000-fold increase in gas pressure due to supernova and shock heating during starbursts (e.g., Jog & Solomon 1992; Elmegreen & Efremov 1997). As gas-rich galactic mergers produce the most energetic starbursts known (e.g., Sanders & Mirabel 1996), the higher specific frequency of GCs in ellipticals relative to that in spirals may be (partly) accounted for by secondary populations of GCs created during gas-rich mergers.
In this respect, a particularly interesting feature of the GC systems of many giant ellipticals is the presence of bimodal colour distributions, providing clear evidence for the occurrence of a ‘second event’ in the formation of these systems (see, e.g., the review by Ashman & Zepf 1998 and references therein). While such a bimodal colour distribution was actually predicted from the merger scenario of galaxy formation (e.g., Ashman & Zepf 1992), opinions about the general nature of the ‘second event’ differ among authors, as detailed upon below. One important constraint to any scenario to explain the bimodality is set by the colour of the ‘red’ peak in the colour distribution of GCs among giant ellipticals, which (if interpreted in terms of metallicity) correlates well with the metallicity and luminosity of the parent galaxy. In contrast, the mean metallicity of the ‘blue’ peak is more or less constant among galaxies as reported by several groups (Forbes, Brodie & Grillmair 1997; Forbes & Forte 2001; Kundu & Whitmore 2001; but see Larsen et al. 2001 for a somewhat different view). There are three competing scenarios that attempt to explain the bimodality of GC colours in giant ellipticals. The ‘merger model’ (Schweizer 1987; Ashman & Zepf 1992) and the ‘multi-phase collapse model’ (Forbes et al. 1997) both suggest that it is the consequence of GCs forming during two distinct epochs in the star formation history of these galaxies, whereas the ’accretion scenario’ (Forte, Martinez & Muzzio 1982; Côté, Marzke & West 1998) proposes that every galaxy is born with a GC system that has a median colour (metallicity) according to the colour-magnitude relation among galaxies (e.g., Terlevich et al. 1999), and that the bimodality is due to accretion of small galaxies (with their associated metal-poor GCs) by a larger galaxy (with its pre-existing metal-rich GCs). The first two models differ in the formation mechanism of the metal-rich clusters: the ‘merger model’ suggests that they are formed during a major, gas-rich galaxy merger, while the ‘multi-phase collapse model’ proposes that they are formed during a secondary collapse phase of the galaxy, which does not involve a merger.
Given these different points of view, it is important to obtain any additional evidence for (or against) the scenario in which the second-generation GCs are formed during gas-rich galaxy mergers. In this context it is of great interest to find out what the ages and metallicities of the luminous GCs in merger remnants actually are, and whether or not the photometric properties of the GC populations found in merger remnants will evolve into those typically found in ‘normal’ giant ellipticals. The currently most dependable age determinations stem from Hydrogen Balmer lines observed in spectra of one bright GC in the peculiar elliptical galaxy NGC 1275 (Zepf et al. 1995a; Brodie et al. 1998) and of two such GCs in NGC 7252 [1998]. The luminous GCs in these merger remnants were found to be 0.5 Gyr old (cf. also Hibbard & Mihos 1995; Schweizer 1998). Unfortunately however, the metallicities of these clusters were hard to measure accurately, since metallic lines are intrinsically weak at this age (the spectrum being dominated by A-type stars). Thus, it still remained to be seen whether or not those luminous clusters could evolve into the ‘red’ clusters seen in ‘normal’ giant ellipticals. Another important test of the ‘merger scenario’ is to find out whether or not these clusters survive the merger era, i.e., whether or not they can be found in merger remnants at different times after a (major) merger. This issue has been brought up for the case of the 0.5 Gyr old clusters in NGC 1275: Brodie et al. (1998) found H and H equivalent widths that are somewhat larger (and colours that are bluer) than those of the Bruzual & Charlot models that they used, both for Salpeter or Scalo (1986) IMFs. They showed that the large Balmer line equivalent widths could be brought into agreement with those models by assuming a truncated IMF involving a mass range of 2–3 M⊙. For such a high low-mass cutoff, they argue that these clusters should fade away in only 1 109 yr. On the other hand, the 0.5 Gyr old clusters in NGC 7252 show Balmer line strengths that are well reproduced by the Bruzual & Charlot (1996) models (hereafter the BC96 models) that use the Salpeter or Scalo IMF (Schweizer & Seitzer 1998). Also, Gallagher & Smith (1999) found no need to invoke a truncated IMF to explain the Balmer line strengths in young clusters in the starburst galaxy M 82. But then again, a detailed study of the very luminous star cluster M 82–F (Smith & Gallagher 2001) revealed that a lower mass cutoff of 2–3 M⊙ is required to match their observations for a Salpeter IMF. Obviously, the IMF among luminous young star clusters may not be universal.
We (Goudfrooij et al. 2001, hereafter Paper I) recently obtained multi-slit spectra of GC candidates in NGC 1316 (Fornax A), an early-type merger remnant galaxy (see, e.g., Schweizer 1980). We discovered the presence of 10 GCs associated with NGC 1316 that have luminosities up to an order of magnitude higher than that of Cen, the most massive cluster in our Galaxy. Our measurements of H and the Ca ii triplet in the spectra of the brightest GCs showed them to have solar metallicity (to within 0.15 dex) and to have an age of 3.0 0.5 Gyr. This reinforces the view that luminous GCs such as those found before in younger merger remnants do not necessarily have high low-mass cutoffs to their IMFs, and it means that they can actually survive disruption processes taking place during a galactic merger.
In the present paper we study the photometric properties of NGC 1316’s GC system. We use a combination of HST WFPC2 photometry and ground-based, large-field optical and near-IR imagery of NGC 1316. The uniquely high spatial resolution of the WFPC2 data provides accurate magnitudes and colours of the GCs, with negligible contamination by foreground stars or background galaxies. The large-field optical data are used to determine accurate values for the cluster specific frequency, while the near-IR data allow us to significantly improve age dating and to search for intermediate-age, Magellanic-type GCs which feature very red optical-IR colours, such as found in NGC 5128 [1996] and NGC 7252 (Maraston et al. 2001).
This paper is built up as follows. Section 2 summarizes main properties of NGC 1316. The different observations and data reduction methods are described in section 3. The various results on the photometric properties of the GC system are presented in Section 4. Section 5 summarizes the main conclusions of this study. Finally, Section 6 briefly discusses important outstanding issues.
2 NGC 1316
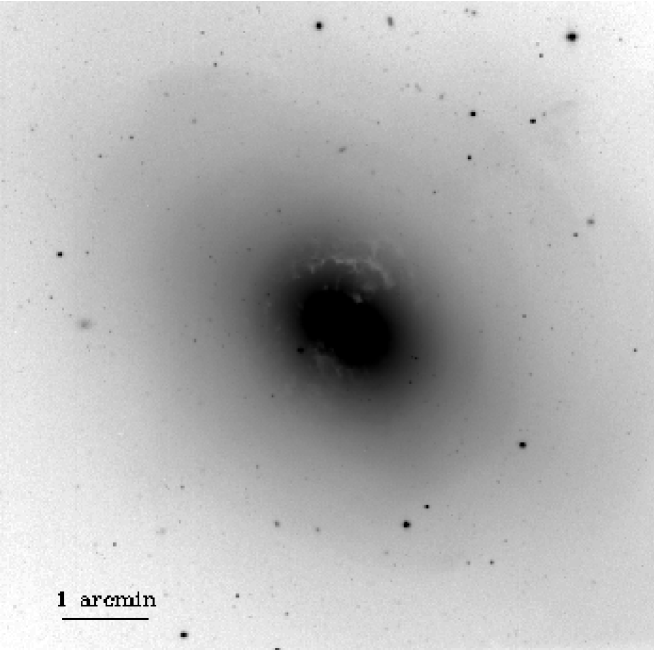
The giant early-type galaxy NGC 1316 (= Fornax A = PKS 0320 37 = ESO 357 G022 = ARP 154) is one of the brightest ( = 9.42 mag, de Vaucouleurs et al. 1991, hereafter RC3) and closest radio galaxies in the sky. It is located in the outskirts of the Fornax cluster, at a projected distance of 37 from NGC 1399, the central giant elliptical galaxy. Several features of NGC 1316 establish firmly that it is a merger remnant. The outer envelope includes several non-concentric arcs, tails and loops that are most likely remnants of tidal perturbations, while the inner part of the spheroid is characterized by non-concentric ripples of 0.1–0.2 mag amplitude above a best-fitting law, a surprisingly high central surface brightness and small core radius (and effective radius) for its galaxy luminosity (Schweizer 1980, 1981; Caon, Capaccioli & D’Onofrio 1994). These characteristics, together with a velocity dispersion which is significantly lower than that of other elliptical galaxies of similar luminosity, cause NGC 1316 to lie far off the fundamental plane of early-type galaxies or the Faber-Jackson relation (e.g., D’Onofrio et al. 1997). Figure 1 shows a -band image of the inner 75 75 of NGC 1316 in which some of the features mentioned above can be found. All of these features are consistent with NGC 1316 having undergone a galactic merger after which dynamical relaxation has not yet had time to complete fully.
As to the adopted distance of NGC 1316, we take advantage of the fact that two well-observed type Ia supernovae (SNe Ia) have occurred in NGC 1316 (SN1980N and SN1981D). Using the precise distance indicator for SNe Ia that utilizes the tight relation between their light curve shape, luminosity, and colour (Riess et al. 1998 and private communication), we arrive at a distance of 22.9 ( 0.5) Mpc for NGC 1316, equivalent to = (31.80 0.05). At this distance, 1′′ corresponds to 111 pc. Note that this sets NGC 1316 slightly behind the core of the Fornax cluster (for which = 31.54 0.14; Ferrarese et al. 2000). In fact, several pieces of evidence suggest that NGC 1316 and a group of smaller galaxies around it form a dynamical entity that is separate from the main Fornax cluster: (i) its location in the periphery of the Fornax cluster, (ii) its luminosity that is 1.1 mag brighter than that of NGC 1399, the brightest giant elliptical in the Fornax cluster core, and (iii) the clustering of the radial velocities of galaxies near NGC 1316, with a median radial velocity that is 300 km s-1 higher than that of the central regions of the Fornax cluster (e.g., Ferguson 1989; RC3). The dynamical study of the Fornax cluster by Drinkwater, Gregg & Colless (2001) indeed shows that the Fornax system has two components: the main Fornax Cluster centered on NGC 1399 and a small subcluster centered on NGC 1316. Drinkwater et al. show that this partition is preferred over a single cluster at the 99% confidence level. We therefore assume in the following that the environment of NGC 1316 is a poor group rather than a rich cluster. Other global properties of NGC 1316 are listed in Table 1 of Paper I.
3 Observations, data reduction and cluster photometry
3.1 HST WFPC2 imaging
3.1.1 Observations and data reduction
We retrieved archival images of NGC 1316 taken with the Wide Field and Planetary Camera 2 (WFPC2) aboard HST in order to study the star clusters in the inner regions of this galaxy. The data consist of multiple images through the F450W and F814W filters. The total exposure times were 5000s in F450W and 1860s in F814W. A subset of the images were spatially offset by 05 from the others, which corresponds to an approximately integer pixel shift in both PC and WF CCDs. After standard pipeline processing and alignment of the images, we combined the images using the STSDAS task crrej, which effectively removed both cosmic rays and hot pixels. We also trimmed each image to exclude the obscured regions near the pyramid edges of WFPC2, yielding 751 751 usable pixels per CCD. Results from the authors of the HST program (proposal ID 5990) have been published in Forbes et al. [1998], Elson et al. [1998] and Grillmair et al. [1999].
One of the main sources of uncertainty in WFPC2 photometry is due to charge-transfer efficiency (CTE) problems of the CCDs for which correction recipes are available (Holtzman et al. 1995; Whitmore, Heyer & Casertano 1999a). In the present case however, compact-source photometry on a high and strongly varying background from NGC 1316, we ignored any such correction. The lowest background surface brightness was encountered in the F450W WF images, but even there all photometered objects lie in regions where the background was in excess of 10 counts per pixel. The lack of CTE correction is therefore expected to affect the magnitudes by less than 0.02 mag and the colours by less than 0.01 mag, negligible for the purposes of this paper.
Prior to performing source photometry, the strongly varying galaxy background was fitted. The main reason for this is to minimize errors in the photometry due to any particular choice of object aperture and sky annulus (see below). For the WF images, the smooth background gradient was fitted by a bi-cubic spline fit and subtracted. Care was taken not to include any point-like source or dust filament in the fit. For the PC image, any fit to the galaxy background is hampered by the presence of very prominent dust features reaching into the nucleus (cf. Fig. 1). After extensive experimentation, we found the following procedure to give the best results. We first built an isophotal model composed of pure ellipses (separately for each filter) using the iraf/stsdas task ellipse in the isophote package. Care was taken to mask out all pixels covered by the dust features prior to the fitting procedure, as well as bright sources, using judgement by eye. Subtraction of the isophotal model revealed a ‘residual’ image on which compact objects as well as the dust features stand out. The galaxy background in the parts of the PC image that were not covered by the elliptical model fit was fit by applying a median filter with a 11 11 pixel kernel to the PC image. After setting the intensity of the median-filtered image to zero in the locations where the isophotal model was non-zero, the final ‘model image’ for the PC was created by summing the isophotal model and the median-filtered image together.
3.1.2 Cluster candidate selection and photometry
The selection and photometry of star cluster candidates was carried out using the iraf version of daophot-ii [1987]. The objects were selected by applying the daofind task to an image prepared by dividing the F450W image by the square root of the model image (thus having uniform shot noise characteristics over the whole image). We adopted fairly tight shape constraints [0.6 roundness 0.6; 0.2 sharpness 0.9] in order to exclude extended background galaxies and faint objects distorted by noise or any residual bad pixels. The detection threshold was set at 4 sigma above the residual background. Although daofind returned with apparent point-like detections located within – or on the edge of – the dust features, we decided to exclude those from further analysis due to the difficulty in judging the location of those sources relative to the dust features along the line of sight, which is bound to yield spurious results.
In order to convert the STMAG magnitudes F450W and F814W into ground-based Johnson and Cousins magnitudes, we used the synphot package within STSDAS. Synthetic spectra of stellar types ranging from B0V to K3III from the Bruzual & Charlot [1993] library were convolved with Johnson and Cousins filters to yield magnitudes relative to Vega, and with F450W and F814W filters to yield magnitudes in the STMAG system. Polynomial fits between the two different magnitude systems (to second order in (F450W F814W)) resulted in the following conversions:
Aperture photometry was carried out through small apertures in order to reduce the noise from the residual background. The background level was determined in an annulus surrounding each object aperture. After extensive experimentation with different object aperture sizes, we adopted apertures of 2 pixel radius () for both the PC and WF CCDs. This choice was made after considering (i) that larger-aperture radii yielded significantly larger errors for derived colours, and (ii) that smaller aperture radii for the WF CCDs (i.e., 1 pixel) would be expected to cause systematic biases in the final photometry such as centering errors and any variation of aperture corrections with position on the CCD. On the other hand however, small aperture radii would yield superior photometric accuracy in the presence of significant variations in the background. This is why we tested whether a smaller aperture radius (1 WF pixel) for the WF CCDs would improve the photometric accuracy, as follows. We compared the colours of the point-like sources on the PC with that of the same sources after having binned the PC CCD by 2 2 pixels, to simulate the pixel size of the WF CCDs. We performed this comparison with (a) = 2 pix for the unbinned PC and = 1 pix for the binned PC, and (b) = 2 pix for the unbinned PC and = 2 pix for the binned PC. Aperture corrections were performed according to Holtzman et al. [1995]. We depict the results of this comparison in Fig. 2. It can be seen that the accuracy of the photometry is not very sensitive to the choice of aperture radius. The standard deviation of , the difference of the colours from the binned and unbinned PC, was 0.14 for case (a) described above, and 0.11 for case (b). This encouraging result is mainly due to the successful removal of the galaxy background as described in the previous subsection.

Galactic foreground extinction towards NGC 1316 is [1984].
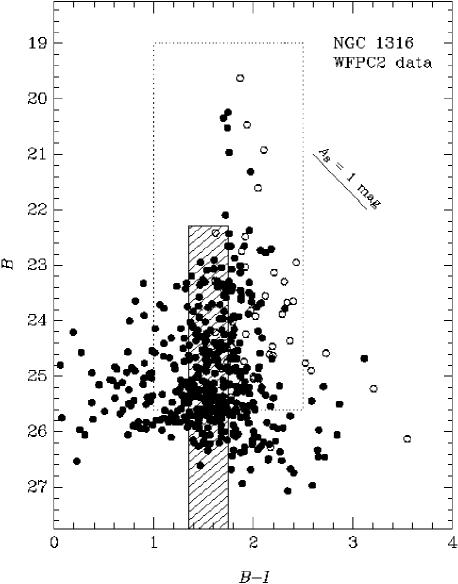
A vs. colour-magnitude diagram (hereafter CMD) for the 492 detected objects is shown in Fig. 3, in which the objects in the PC frame are assigned a symbol different from those in the WF frames. The direction of the reddening vector is also shown. Note that the objects in the PC frame are typically somewhat redder than those in the WF frames, as could be expected due to the extensive dust filaments in the PC frame. From this list of detections, a strict cluster candidate list was made by applying a colour selection cut of 1.0 2.5, which is the full range expected for clusters older than 1 Gyr and 2.5 0.5 (BC96; Maraston 1998; see also Section 4.1 below). The quoted lower limit to the age of the clusters can be considered realistic since we found previously from spectroscopy that even the brightest GCs in NGC 1316 have an age of 3 Gyr (Paper I). For objects in the PC frame, the upper limit to was chosen to be 3.0, allowing for mag of extinction. The CMD shown in Fig. 3 is further discussed in Section 4.1. Photometry and astrometry for the 50 brightest cluster candidates in the WFPC2 frames is shown in Table 3 in the Appendix. A similar table for the full list of cluster candidates in the WFPC2 frames can be obtained in electronic form from CDS.
Completeness tests were done by adding artificial GCs to the images and re-applying the aperture photometry programs in a way identical to those used for the original images. Artificial GCs were generated from a composite Point Spread Function (PSF) derived from real GC candidates in each frame, and added in batches of 100 at different magnitude intervals, at random positions within the frames, with colours equal to the median colour of GC candidates. The resulting completeness function for the WF frames is shown in Fig. 4. The 50 per cent completeness level is at for the WF frames, and for the PC frame.

3.2 Ground-based optical imaging
3.2.1 Observations and data reduction
Ground-based CCD images of NGC 1316 were retrieved from the ESO archive database. The data were originally obtained in November 1992 at the ESO 3.5-m New Technology Telescope (NTT) with the red arm of the ESO Multi-Mode Instrument (EMMI). The detector was a thick, front-illuminated CCD of type Thomson 31156 Grade A, having 10241024 sensitive pixels. The pixel size was m, yielding a scale of 0.44 arcsec per pixel and a total field of view of 75 75 (see Fig. 1). NGC 1316 was observed through , and (Cousins) filters, with total exposure times of 4200 s, 2100 s and 900 s, respectively, split up into several exposures.
After retrieving several bias, dark, and twilight flat field frames taken during the observing runs in which the images of NGC 1316 were taken, basic data reduction was carried out in the standard way using the iraf ccdred package. Cosmic radiation events in the individual images were removed by an appropriate averaging program. First, the images taken through the same filter were aligned to a common coordinate system, using the centroids of stars in the field of view. This alignment procedure was accurate to within 0.03 pixel. The images were subsequently averaged together by comparing all individual pixel values (per unit exposure time) with the median value over all frames (taken using the same filter). Individual pixels are rejected during the combining process if their value exceeds the range expected from the (sky + read-out) noise. The effective seeing values of the combined images are 128 in , 123 in , and 117 in . Fig. 1 shows the final combined -band image.
Photometric calibrations were derived using images of the Rubin 149 standard star field for which the photometry in the Johnson–Kron–Cousins system is given in Landolt [1992]. The resulting colour equations were:
where upper case denote calibrated Johnson–Kron–Cousins magnitudes, and lower case denote instrumental magnitudes (normalized to an exposure time of 1 s). We used the standard atmospheric extinction coefficients for the ESO site (ESO User Manual, 1993). This calibration was double checked with WFPC2 photometry of stars in the area covered by the WFPC2 images and with published aperture photometry of Wegner [1979]. The differences were minor (less than 0.02 mag in any band).
3.2.2 Cluster candidate selection and photometry
As described above for the case of the HST WFPC2 images, we attempted to remove the galaxy background from the images. First we used the STSDAS task ellipse to perform isophotal model fits to the surface brightness distribution of the galaxy (after masking out all pixels covered by dust features and bright sources). Subtraction of that model revealed a rich system of extensive shells and ripples (cf. also Schweizer 1980), as well as the dust features, small galaxies and compact sources. To also remove the shells and ripples, we first subtracted all compact sources using the daophot-ii PSF fitting task. Then we applied a median filter (kernel = 9 9 pixels) to the image. Finally, the sum of the isophotal model and the median-filtered image constituted the final model image.
The sky background levels and their uncertainties were determined by fitting power laws to the outer parts of the intensity profiles of the isophotal model as described in Goudfrooij et al. [1994a]. The selection and photometry of star cluster candidates was carried out using daophot-ii. After aligning the , and images on the same coordinate system, the daofind task was run on the image (again, divided by the square root of the model image) which had the highest signal-to-noise. The detection threshold was set at 4 sigma above the (residual) background. Due to the very complex dusty structure of the central regions of NGC 1316, especially at ground-based resolution, we decided to exclude the compact sources found within the central 50′′ from the nucleus from further analysis. The great majority of those compact sources was measured on the WFPC2 images anyway.
Aperture photometry of the cluster candidates was performed using an aperture radius of 4 pixels. Aperture corrections were derived for each filter from a curve-of-growth analysis of 10 well-exposed, isolated stars in the field.

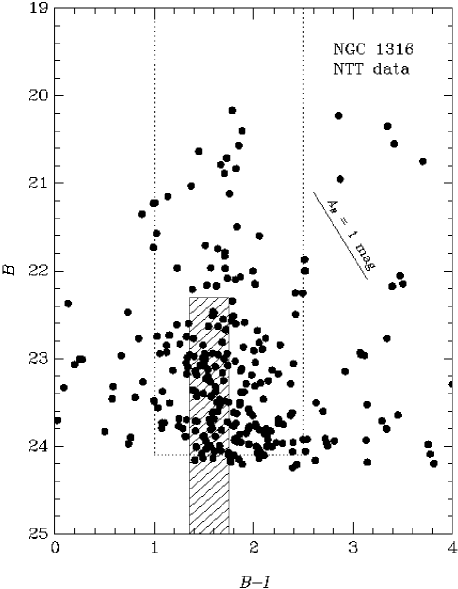
A vs. CMD for the 350 detected objects is shown in Fig. 5. The direction of the reddening vector is also shown. From this list of detections, a strict cluster candidate list was made by applying a colour selection criterion of , i.e., the same as for the WF frames of the HST data. Fig. 5 is further discussed in Section 4.1. Photometry and astrometry for the 50 brightest cluster candidates in the NTT frames is shown in Table 4 in the Appendix. A similar table for the full list of cluster candidates in the NTT frames can be obtained in electronic form from CDS.
Completeness tests were done the same way as for the HST/WFPC2 images (cf. Section 3.1). The resulting completeness functions for the and images are shown in Fig. 6. The 50 per cent completeness levels are at and . These represent our faint magnitude cut-offs for the cluster candidates. Even using these selection criteria we do expect some contamination by foreground stars and background galaxies in the cluster candidate sample, due to the lower spatial resolution with respect to the HST data. This issue will be discussed below in Section 4.4.1.
3.3 Ground-based near-infrared imaging
3.3.1 Observations and data reduction
Near-infrared images of NGC 1316 were obtained during the nights of 1996 November 22–25 using the IRAC2 camera mounted on the ESO/MPI 2.2-m telescope. The detector was a Rockwell NICMOS3 array (HgCdTe, 256 256 pixels). We used lens C, having an image scale of 0509 per pixel. The read-out noise was 22.5 e- per pixel. We mapped a region of 19 arcmin2 around the centre of NGC 1316 with the , and filters. The field covering the central region of NGC 1316 was exposed for a longer time than the other fields in order to get the highest possible signal-to-noise ratio in the region overlapping the WFPC2 field. The sky was photometric during the whole observing run, and the seeing varied between 08 and 10. Separate sky frames located at from the galaxy centre were also taken, interleaved with the individual galaxy frames to enable proper sky subtraction. The exposure times for each individual frame were chosen to be as long as possible, but care was taken to have the intensity at the galaxy centre stay within the 1 per cent linearity regime.
The reduction procedure was as follows. First, all dark frames with identical integration time were combined and subtracted from the raw images (i.e., dome flats, standard star frames, sky frames, and galaxy frames). For each filter, the dome flats taken with identical lamp voltages were combined, and the combined zero-voltage dome flat was subtracted from all other dome flats. We used a combined dome flat with an intensity level similar to that of the object frames for final flat fielding, after having normalized it to a mean value of unity. The dome flats were also used to create a bad pixel mask which allowed the replacement of bad pixels by the median of the values of the surrounding pixels. A final correction to the low-frequency flat field correction (‘illumination correction’) was made by mapping a standard star on a grid of 16 positions across the surface of the array, and fitting a third-order polynomial to the total intensities of the star at the different positions.
The photometric calibration was derived from observations of several standard stars from Carter & Meadows [1995]. Each standard star was observed on 2 regions of the array that are free of bad pixels. Aperture photometry was then performed on an image that is the difference of the two flat-fielded standard star images, ensuring a proper sky subtraction. The resulting colour equations were:
where upper case denote calibrated magnitudes, lower case denote instrumental magnitudes normalized to an exposure time of 1 s, and is the airmass. These zeropoints were double checked by comparing the aperture photometry of NGC 1316 by Glass [1984] with our data. They turned out to be consistent with one another to within 0.03 mag in any passband.
3.3.2 Cluster candidate selection and photometry
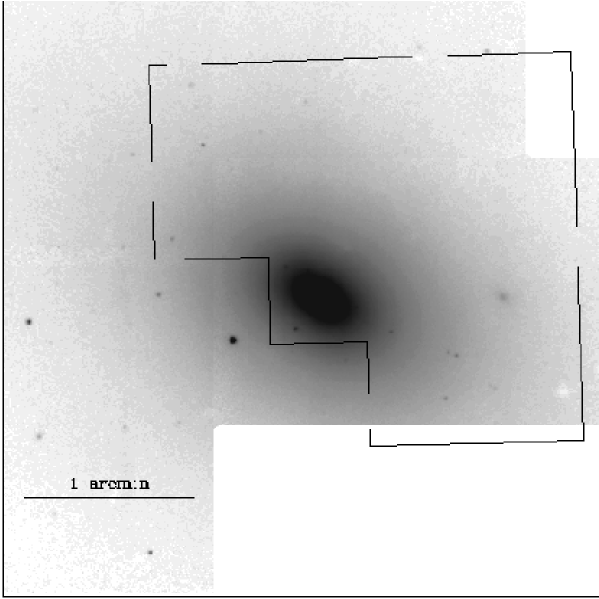
In order to put the optical and near-IR images on a common coordinate system, we measured the centroids of several point sources in common between the near-IR images and the NTT -band image, using the iraf task xyxymatch. The alignment error was always (and, mostly, far) below 0.1 pixel. All near-IR images were subsequently individually transformed to the NTT coordinate system. Finally, all transformed near-IR images were mosaiced together per filter. Fig. 7 shows the final -band mosaiced image, with the location of the WFPC2 field superposed onto it. The galaxy background subtraction, point-source photometry and the derivation of aperture corrections were performed in the same way as for the optical NTT images. The near-IR photometry of the cluster candidates are listed in Tables 3 and 4 in Appendix A.
4 Properties of the star cluster system of NGC 1316
4.1 Optical properties of stellar populations
4.1.1 Interpretation of optical photometry
The vs. CMD for cluster candidates in the WFPC2 and NTT frames was shown in Figs. 3 and 5, respectively. The area which the GC system of the halo of the Milky Way would occupy if placed at the distance of NGC 1316 is also indicated, using the database of Harris (1996). These diagrams suggest some interesting results.
First, the colours of the clusters that are brighter than the brightest GC in our Galaxy are quite uniform and on the red end of the range covered by the Galactic GCs (and beyond). Spectra of three of these bright clusters were analyzed in Paper I, where we found all three to be coeval with an age of 3.0 0.5 Gyr and a solar metallicity (to within 0.15 dex). The colours of these bright clusters are consistent with their spectroscopically derived age and metallicity range (Paper I; see also below).
Second, the clusters fainter than tend to be somewhat bluer on average than the brighter clusters (excluding some inner clusters in the PC frame which are likely reddened by dust, cf. Fig. 3). This trend is more obvious from the WFPC2 diagram (Fig. 3) than from the NTT diagram (Fig. 5), which is most likely due to the higher photometric accuracy of the WFPC2 data relative to that of the NTT data. The range of colours encompassed by the clusters with is roughly consistent with that encompassed by the Galactic GCs, considering the photometric errors (e.g., at ). The main cause of the bluer mean colours at fainter brightness levels would seem to be a lower metallicity rather than a younger age, as younger populations are brighter than older ones. These fainter clusters may be expected to be a mixture of (i) old, metal-poor clusters associated with the pre-merger galaxies (given their overlapping colours and luminosities) and (ii) the lower-luminosity end of the system of second-generation clusters formed during the merger.
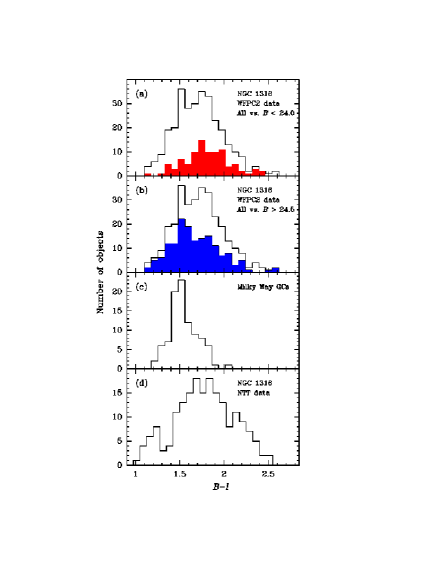
These results are illustrated further in Fig. 8 which shows colour distributions of cluster candidates on the WFPC2 frames (in the form of histograms), and compares them with that of the GC system of the Milky Way. The colour distribution of the full cluster sample (depicted as open histogram on panels (a) and (b) of Fig. 8) exhibits two peaks: one at [coinciding with the peak of the Milky Way GC system, cf. panel (c)] and one at . Panel (a) shows clearly that the bright end of the cluster luminosity function (hereafter LF; shown as filled histogram; many of these objects were proven to be genuine clusters in Paper I) primarily makes up the red peak of the overall colour distribution, while the panel (b) shows that at the faint end of the cluster LF, the blue peak of the colour distribution becomes about as highly populated as the red peak. The reddest ‘wing’ to the colour distribution in Fig. 8 is mostly populated by cluster candidates in the innermost regions (i.e., the PC frame, cf. Fig. 3). This suggests that the most likely main cause of the red wing is dust extinction rather than high metallicity. To decide unambiguously between these possibilities, spectroscopy and/or near-IR photometry with 8 – 10 m-class telescopes will be needed. Finally, the colour distribution of the cluster candidates on the NTT frames (outside a radius of 50′′, like in Fig. 5) is shown in panel (d) of Fig. 8. It is similar to that of the clusters on the WFPC2 frames, except that the blue peak is less populated in the former. This is entirely consistent with our interpretation involving two cluster populations mentioned above, given the fact that the NTT photometry doesn’t reach deep enough to detect the bulk of the fainter, bluer clusters that are supposedly the ‘old’ clusters from the pre-merger galaxies.
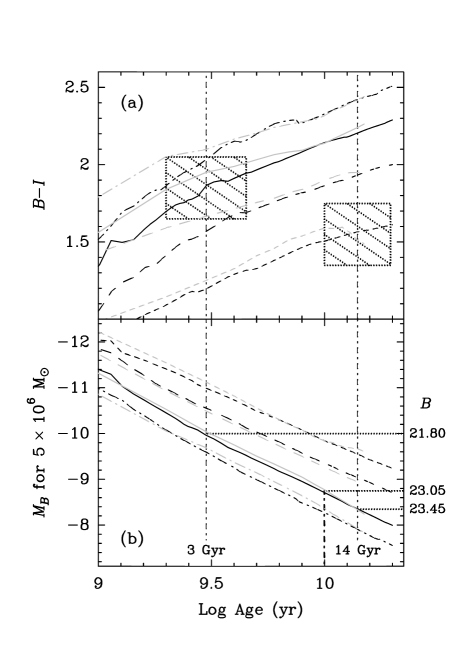
Panel (b): Evolution of -band magnitudes (labels are absolute magnitudes on the left-hand side, apparent magnitudes at the distance of NGC 1316 on the right-hand side) for a globular cluster having the mass of Cen (5 106 M⊙, Meylan et al. 1995). Curves as in Panel (a). Ages of 3 Gyr, 10 Gyr, and 14 Gyr are indicated. The horizontal dotted lines indicate magnitudes for specific cases, as discussed in Section 4.1.2.
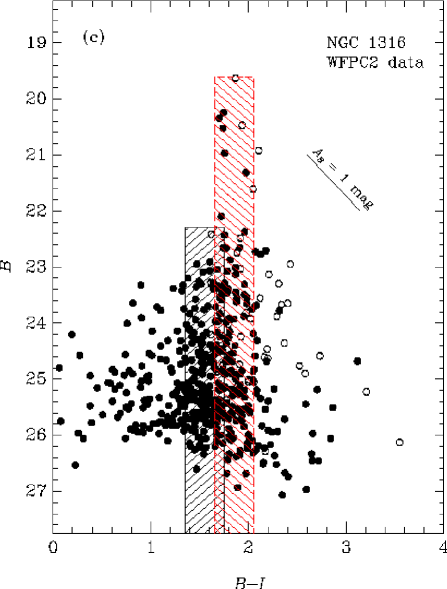
Panel (c): Same vs. colour-magnitude diagram as in Fig. 3. The hatched region on the left (i.e., 1.35 1.75) delineates the apparent magnitude and colour range for GCs in the halo of our Galaxy (placed at the distance of NGC 1316), while the hatched region on the right (i.e., 1.65 2.05) does so for a 3 Gyr old population of star clusters in NGC 1316 with a metallicity of [] = 0.00 0.15 dex. See discussion in Section 4.1.1.
Summarizing the optical photometry results presented above, the blue peak of the overall histogram, which coincides with the modus of the colour distribution of the Galactic GC system, is primarily populated by the faint end of the cluster LF, while the red peak in the histogram is solely populated by the bright end of the cluster LF. Since we also know from spectroscopy that the brightest clusters in NGC 1316 are 3 0.5 Gyr old and have a solar metallicity to within 0.15 dex (Paper I), an obvious interpretation of these results is that we are dealing with the presence of two distinct cluster populations: (i) a second-generation population clusters of roughly solar metallicity that were formed 3 Gyr ago during a major spiral-spiral merger (as determined from spectra in Paper I), and (ii) a population of old, primarily metal-poor clusters that were associated with the progenitor galaxies. From the colour histograms of the WFPC2 data shown in panels (a) and (b) of Fig. 8, we estimate that of order 50 per cent of the total number of clusters is of the second generation.
Is this interpretation consistent with stellar population model predictions ? We considered the following to address this question. The metallicity range encompassed by the brightest clusters at an age of 3 0.5 Gyr (derived from spectra in Paper I: ) corresponds to according to the BC96 models. Considering the typical photometric errors of the WFPC2 photometry as well (e.g., for ), we assigned a interval of to the putative second-generation population of clusters. This is indicated as the hatched region on the left side of panel (a) of Fig. 9, which depicts the predicted time evolution of the colour for single-burst populations older than 1 Gyr [using the BC96 models as well as the Maraston (2001; see Sect. 4.2) models for comparison]. The hatched region on the right side of panel (a) indicates the interval occupied by the Galactic GC system which corresponds to a metallicity range of (Harris 1996; Minniti 1995) which is consistent with the model predictions at an age of 14 Gyr. These two intervals are also indicated on panel (c) of Fig. 9, which is the vs. CMD from the WFPC2 photometry (i.e., the same as Fig. 3). It can be seen that these two intervals provide a very good fit to the positions of the cluster candidates on the CMD. The upper brightness limit to the hatched region for the second-generation population of clusters on panel (c) was chosen to encompass the brightest cluster candidates, since the spectra in Paper I showed them to be genuine clusters associated with NGC 1316. Note that this brightness limit is several magnitudes brighter than that of the Galactic cluster system, rendering the brightest second-generation clusters in NGC 1316 to be much more massive than Cen, the brightest cluster in our Galaxy (this was discussed in detail in Paper I).

4.1.2 Evolution of colour distribution
Will the colour distribution of the NGC 1316 cluster system evolve into a bimodal one, as typically found in giant ellipticals of similar luminosity? This is a key question in the context of finding evidence for or against the ‘merger scenario’ (Ashman & Zepf 1992) on the nature of bimodal colour distributions of GC systems of giant elliptical galaxies. NGC 1316 constitutes an important probe in this context as well, since (i) the age and the metallicity of the brightest second-generation GCs are known to relatively high accuracy (Paper I), and (ii) the first signs of colour bimodality have already become apparent, with properties that are entirely consistent with the predictions of the merger scenario.
So what will the colour distribution look like at a time when the signs of merger activity have faded away, e.g., after 10 Gyr? This issue is addressed by panel (b) of Fig. 9 which depicts the time evolution of the absolute magnitude (as well as at the distance of NGC 1316) for a globular cluster with the mass of Cen ( = M⊙, cf. Meylan et al. 1995). One can see that at solar metallicity and an age of 3 Gyr, such a cluster is predicted to have = 21.80, whereas it will fade to = 23.05 at an age of 10 Gyr, a fading of 1.25 mag. In that time span, its colour will have reddened from 1.85 to 2.15 [cf. panel (a)]. The peaks in the colour distribution at an age of 10 Gyr are thus expected to be at = 1.55 and = 2.15. This is remarkably similar to the peaks observed in bimodal distributions of cluster colours in well-studied giant ellipticals with luminosities similar to that of NGC 1316 (e.g., NGC 1399 and NGC 1404 (Forbes et al. 1998), NGC 3923 (Zepf, Ashman & Geisler 1995b), NGC 4472 (Geisler, Lee & Kim 1996), NGC 4486 (Kundu et al. 1999). Hence, the answer to the question posed as the first sentence of this subsection is affirmative. The cluster system of this merger remnant will evolve into one with a typical bimodal colour distribution (barring further merger events), providing strong support in favour of the ‘merger scenario’.
4.1.3 Radial distribution of the two subpopulations
Another key prediction of the ‘merger scenario’ is that the newly formed, metal-rich clusters will be more centrally concentrated than the pre-existing metal-poor clusters. However, the multi-phase collapse (non-merger) scenario proposed by Forbes et al. [1997] predicts a very similar distribution of the two subpopulations, so that the occurrence of this property in ‘normal’ giant ellipticals featuring bimodal colour distributions does not provide strong evidence in support of either scenario. As discussed in the previous subsection however, GC systems of intermediate-age merger remnants such as NGC 1316 are important probes in this context. We compare the radial distribution of the two subpopulations by using the WFPC2 data, assigning clusters with 1.00 1.55 and 0.1 to represent the ‘metal-poor’ ones and clusters with 1.75 2.5 and 0.1 to represent the second-generation ‘metal-rich’ ones. These criteria ensure that the interval that overlaps with both subpopulations is excluded from this exercise. The radial distribution of both subpopulations is depicted in Fig. 10. A glance at the lower panel (a diagram of vs. radius), already shows clearly that the ‘metal-rich’ clusters are more centrally concentrated than the ‘metal-poor’ ones. This conclusion is endorsed by the upper panel which shows a plot of cluster surface density vs. radius, derived after counting the number of clusters within three radial annuli, logarithmically spaced in galactocentric radius. Note that a similar result was found for NGC 3610, a candidate 4 Gyr old merger remnant featuring a similarly emerging colour bimodality (Whitmore et al. 1997).
4.2 Near-IR properties of stellar populations
In interpreting the photometry of star cluster candidates in NGC 1316, we restrict ourselves to the objects that have optical photometry as well. The near-IR photometry was performed in part because it serves as a very sensitive check for the presence of stellar populations younger than 2 Gyr, which is relevant to the issues at hand in this paper. Near-IR photometry is remarkably sensitive to the presence of thermally pulsing asymptotic giant branch (TP-AGB) stars. TP-AGB stars are known to undergo a rather active phase during which a large amount of fuel in extended hydrogen and helium shells around degenerate carbon-oxygen cores is burned, which results in a sharp increase of the near-IR stellar luminosity, particularly in the -band. This so-called ‘AGB phase transition’ [1986] starts at ages 200–300 Myr and lasts 1 Gyr (cf. Renzini & Voli 1981; Iben & Renzini 1983; Maraston 1998; Lançon 1999).
In contrast to near-IR photometry, the evolution of optical colour indices such as or for a simple stellar population is monotonic with age, since they mainly trace the evolution of the turn-off part of the population. Hence, colour-colour diagrams involving such an optical colour index along with an index that is sensitive to the AGB phase transition (e.g., , , or ) can be expected to provide powerful means of identifying intermediate-age stellar populations.
However, the actual inclusion of the TP-AGB contribution in population synthesis models is complicated by poor knowledge of the physical mechanisms driving AGB evolution. Specifically, the amount of fuel burned during the thermally pulsing phase is largely unknown due to uncertainties in the mass loss rate, mixing, and the efficiency of hydrogen burning at the bottom of the convective layer (Renzini & Buzzoni 1986). Fortunately, intermediate-age star clusters in the Magellanic Clouds cover the relevant age range (see, e.g., the review by Olszewski 1995) and thus offer an opportunity to calibrate these effects. This was done by Maraston [1998] who presented SSP models in which the contribution of TP-AGB stars to the total SSP energy as a function of age is calibrated on observed photometry of star clusters in the Magellanic Clouds. Maraston et al. (2001) computed similar models for various metallicities, adopting the prescriptions by Renzini & Voli [1981] to describe the influence of metallicity on the TP-AGB energy. These models are described in the next subsection (see Maraston et al. 2001 for more details).
4.2.1 SSP modelling of populations including TP-AGB stars
We used the recent sets of SSP models with metallicities of 0.5 , 1.0 , and 2.0 that are described in detail in Maraston et al. [2001] and Maraston (2001, in preparation). In summary, these models were computed with the evolutionary synthesis code of Maraston [1998], which is based upon the fuel consumption theorem (Renzini & Buzzoni 1986). The AGB contribution to the bolometric luminosity as a function of age was calibrated using the observed AGB contributions in Magellanic Cloud clusters from Frogel, Mould & Blanco [1990], grouped into age bins adopting the classification of Searle, Wilkinson & Bagnuolo (1980, hereafter SWB). Model colours were computed by calibrating the partition of the total TP-AGB fuel among stars of spectral type C (Carbon stars) and M. The fractional number of C stars relative to the total number of AGB stars, , is a function of SSP age and metallicity. The age dependence of was evaluated from the data for Magellanic Cloud clusters [1990], while the metallicity dependence of was evaluated using the prescription of Renzini & Voli [1981]. Observed colours for C– and M-type AGB stars were taken from Cohen et al. [1981], Cohen [1982], and Westerlund et al. [1991].
The success of these new models in describing the photometric properties of intermediate-age star clusters was shown in Maraston et al. (2001, especially their Fig. 5). The star clusters in NGC 7252, a merger remnant galaxy of age 300–500 Myr (e.g., Hibbard & Mihos 1995; Schweizer & Seitzer 1998), were found to exhibit very red colours for their , which is exactly what is observed for Magellanic Cloud clusters of SWB types IV–VI. Maraston et al. (2001) showed clearly that this behaviour cannot be understood without the addition of the TP-AGB contribution, while it was readily fit by the new models for 0.5 .
Given the complex and still poorly determined shape of the spectrum of TP-AGB stars, intermediate-age SSP colours must be calibrated against observations in every band. For the Cousins -band, observations of C– and M-type TP-AGB stars are not available, nor are integrated magnitudes of globular clusters in the Magellanic Clouds. For the purpose of the present paper, the model colours have therefore been calibrated on observations of intermediate-age star clusters in NGC 7252 (from Whitmore et al. 1997; see Maraston et al. 2001, Table 2). The dereddened colours of these clusters span a small range: = 0.64 0.04. Their ages have been found to be 300 Myr (Maraston et al. 2001, consistent with the results by Schweizer & Seitzer 1998 based on optical spectroscopy). Therefore the model at age 300 Myr has been calibrated to reproduce = 0.64. Note that this procedure retains the amount of fuel that was calibrated in Maraston (1998). The calibrating variable has been chosen to be the colour of the input TP-AGB stars. Specifically, = 1.1 for TP-AGB M stars and 1.4 2.0 for C-type TP-AGB stars is found to perfectly reproduce an integrated colour = 0.64.
These same input colours for TP-AGB stars have been used to compute the models older than 300 Myr. This is a reasonable assumption because the colours of C stars are not found to change significantly with the age of the parent star cluster (Frogel et al. 1990 and references therein), the evolving parameter being the fuel consumption.
4.2.2 Results
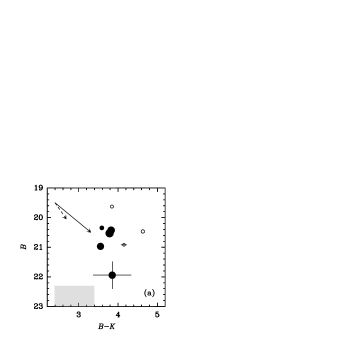
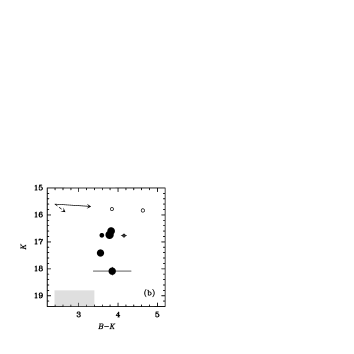
Fig. 11 shows the vs. and vs. CMDs for the detected cluster candidates in NGC 1316. Their location in these diagrams is compared to the area covered by the system of halo GCs in our Galaxy (shown in grey scale). The photometry of the Galactic GCs was taken from Aaronson et al. (1978, and private communication). Only data with photometric errors in smaller than 1 mag are plotted. The detected star clusters are more luminous (as well as redder) than the halo GCs in our Galaxy, and are thus likely belonging to the second-generation cluster system formed during the merger. Comparing the two CMDs in Fig. 11, one can see that the colour of the reddest inner clusters (the open circles; these clusters are located within 20′′ from the nucleus) is most likely due to extinction within the dusty filaments rather than being due to higher metallicity. The present near-IR imaging does not reach deep enough to detect the clusters belonging to the ‘blue peak’ in the histogram (cf. Figs. 8 and 9). 8-m class telescopes are needed for this purpose, which is important to obtain highly increased power (with respect to optical colours) in disentangling different cluster populations in galaxies.
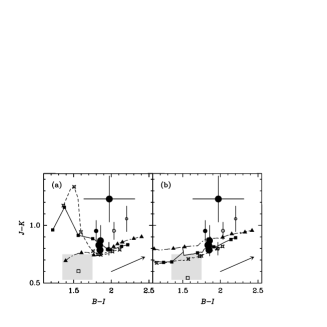
Fig. 12 shows the vs. colour-colour diagram of the cluster candidates in NGC 1316. This diagram is particularly sensitive to the presence of TP-AGB stars, as can be evaluated from the models of Maraston (2001, described above) which are overplotted in the left panel for metallicities of 0.5 , 1.0 , and 2.0 . Symbols along the model curves indicate a number of reference ages. For comparison, the right panel shows the same data along with curves describing the BC96 models (which do not include the calibrated effect of the AGB phase transition). Fig. 12 shows clearly that the colours of the best-observed clusters in NGC 1316 are indeed not well described by an intermediate-age population dominated by TP-AGB stars such as the clusters of NGC 7252. Instead, the NGC 1316 clusters are best described by the solar metallicity model at an age of 2.5–3 Gyr (allowing for reddening of the reddest inner clusters by dust as seen before), again consistent with the spectroscopic results of Paper I and the optical photometry discussed in Section 4.1.
4.3 Star cluster luminosity function
The typical luminosity function (LF) of ‘old’ globular clusters around galaxies such as our Milky Way or ‘normal’ giant elliptical galaxies such as NGC 1399 or M 87 is well represented by a log-normal function (i.e., a Gaussian in magnitude units; see e.g., Ashman & Zepf 1998 and references therein) of which the peak absolute magnitude concides with that of the GC system of our Galaxy (e.g., Whitmore 1997). In contrast, the shape of luminosity functions of clusters in ‘young’ [age 500 Myr] merger remnant or starburst galaxies is a power law with a slope of (see, e.g., Meurer et al. 1995; Schweizer et al. 1996; Miller et al. 1997; Whitmore et al. 1999b; Zepf et al. 1999). This decidedly different behaviour has been used to argue that the nature of young clusters in mergers or starburst galaxies is fundamentally different from clusters in old systems [1995]. On the other hand however, several theoretical investigations have shown that dynamical evolution can significantly alter the mass function of star clusters over time (e.g., Fall & Rees 1977; Aguilar, Hut & Ostriker 1988; Meylan & Heggie 1997; Murali & Weinberg 1997; Gnedin & Ostriker 1997). In fact, dynamical evolution has been crucial in shaping the LFs of old cluster systems as they are today (cf. Gnedin & Ostriker 1997). In order to study the evolution of cluster LFs by observation as well as theory, it is important to find systems with ages that are intermediate between those of the young mergers and the Gyr old systems. NGC 1316 is an interesting probe in this respect, as the bright GCs in NGC 1316 are 3 Gyr old (Paper I). For instance, if the GC system of NGC 1316 indeed is a combination of “old” GCs that belonged to the merger progenitor galaxies and second-generation GCs that were formed in the merger, one would expect to find different LFs for the two subpopulations.
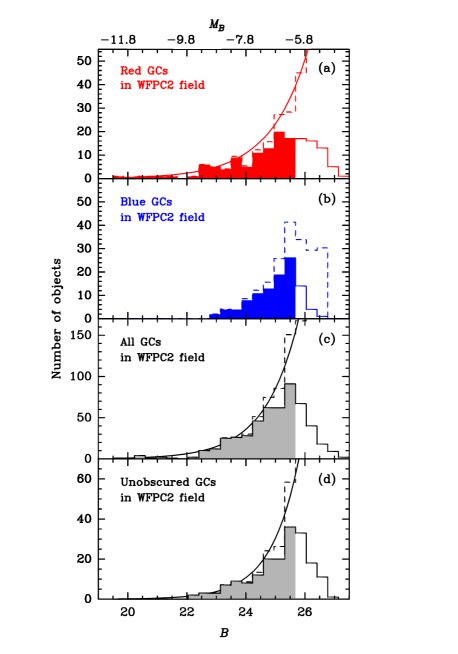
Given the magnitude depth of the HST/WFPC2 data, its superb power in discarding background galaxies as star cluster candidates, and the availability of a background field, we use the HST data for examining the star cluster LF for NGC 1316. While this item was already discussed to some extent by Grillmair et al. [1999], we are interested in the exact functional representation of the shape of the LF for reasons outlined above. The LF for the cluster system of NGC 1316 is plotted in Fig. 13. Four panels are shown: One for all ‘red’ GCs, one for all ‘blue’ GCs (where ‘red’ and ‘blue’ are defined as for Fig. 10 in Sect. 4.1.3), one for the full list of cluster candidates found on all WFPC2 chips, and one for cluster candidates located at radii from the centre (i.e., outside the dusty central filaments; hereafter called the ‘unobscured sample’). The solid histograms depict the observed LFs, while the dashed histograms depict the completeness-corrected and background-subtracted LFs. The completeness-corrected LF of the full sample of GCs in NGC 1316 can be seen to continue to increase out to beyond the 50 per cent completeness limit of the WFPC2 data (cf. also Grillmair et al. 1999), reminiscent of the LFs found in young merger remnant galaxies as mentioned above. However, the two upper panels in Fig. 13 clearly show that this behaviour is mostly due to the ‘red’ GCs, as the LF of the ‘blue’ GCs shows strong evidence for a ‘turnover’, similar to log-normal LFs such as those found for GCs in our Galaxy and in ‘normal’ ellipticals. For reference, the absolute magnitude of the ‘turnover’ of the Galactic GC system is 6.6 [1996], similar to the peak in the LF of the ‘blue’ GCs in NGC 1316. This is consistent with the notion that the ‘blue’ GCs in NGC 1316 stem from the merger progenitor spirals. Given the fact that the turnover is near the 50 per cent completeness level however, this important result should be confirmed with deeper photometry.
Given the well-known power-law nature of LFs of young and mixed-age cluster systems (see, e.g., Elson & Fall 1985 for the LMC; Whitmore et al. 1999b for NGC 4038/4039), we fitted the completeness-corrected, background-subtracted LFs for NGC 1316 by a power law of the form
To limit the impact of uncertainties in the incompleteness factors, the fits were limited to bins containing objects with . Fig. 13 shows the results of these fits (solid curves) performed by least squares with weights proportional to (the number of objects per bin). The best fit for the ‘red’ GC candidate sample yields . For the ‘full’ GC candidate the fit yields , while that for the unobscured sample yields . These LF power-law slopes are significantly flatter than those found in ‘young’ mergers (cf. for NGC 4038/4039 [1999b], for NGC 3921 [1996], for NGC 7252 [1997], and for NGC 3256 [1999]) and starburst galaxies (, cf. Meurer et al. 1995).
4.3.1 Dynamical evolution of star cluster mass function
The above results indicate that the LF (and mass function) of a star cluster system of a 3 Gyr old merger remnant such as NGC 1316 is a power law, with a slope that is significantly flatter than star cluster systems of young merger remnants. We suggest that this flattening of the power-law LF may represent an intermediate stage in the dynamical evolution of star cluster mass functions. We illustrate this below using simple scaling relations between time scales of known long-term cluster disruption processes.
The two dynamical processes that are most relevant in determining cluster mass functions are (i) (internal) evaporation through escaping stars and (ii) tidal shocking. The characteristic time scales for these destructive processes are:
| (1) |
for evaporation (Spitzer & Hart 1971; Gnedin & Ostriker 1997), and
| (2) |
for tidal shocking (Aguilar et al. 1988). In Eqs. (1) and (2), is the total cluster mass, is the cluster half-mass radius, is the gravitational constant, is the average stellar mass in the cluster, ln() = ln (0.4) is the Coulomb logarithm ( being the number of stars in the cluster), is the radial period of the cluster orbit, is the perigalacticon distance, is the cluster velocity at perigalacticon, is the galaxy mass, is a dimensionless factor that takes the mass distribution of the galaxy into account (cf. Aguilar & White 1985), is the mean square cluster radius, is the net shock efficiency, is the ratio of the fractional change of cluster binding energy to cluster mass induced by the shock (Spitzer & Chevalier 1972), and is a dimensionless correction factor proportional to the square of the difference in force at perigalacticon vs. at apogalacticon (cf. Eq. (11) in Aguilar et al. 1988). For the purpose of this comparative exercise, we neglect the dependence of on the cluster orbit and galaxy potential, i.e., we assume that we are comparing cluster systems in (giant) ellipticals covering a relatively small range of galaxy masses (and cluster orbits). This leaves us with and .
Imaging studies of young clusters in merger remnants and starburst galaxies using HST have revealed a very weak dependence of cluster radii on luminosity (e.g., in NGC 3256, Zepf et al. 1999; cf. also Meurer et al. 1995). Using Zepf et al.’s results, the relative scalings of destruction time scales as a function of cluster mass become and . These relations can be used to determine the time evolution of any characteristic cluster mass that is undergoing a particular stage of destruction like e.g., the turnover mass of ‘old’ cluster systems in galaxies such as the Milky Way or nearby ‘normal’ elliptical galaxies. Assuming an age of 14 Gyr for the old cluster systems, the turnover mass at an age of 3 Gyr (i.e., the age of the second-generation clusters in NGC 1316) will be 8 per cent of that in the Milky Way if evaporation is the dominant destruction mechanism, or 15 per cent of that in the Milky Way if tidal shocking is the dominant destruction mechanism. A relevant question to ask in the context of the observed LF of clusters in NGC 1316 is then: Would one be able to detect clusters with masses of 8 – 15 per cent of the turnover mass of the Milky Way GC system in the WFPC2 data? According to recent stellar population models and a Salpeter (1955) IMF, the ratio of a 3 Gyr old stellar population of solar metallicity is a factor 1.61 lower than that of a 14 Gyr old population with 0.05 solar metallicity (Maraston 1999; the factor is 1.44 when using the BC96 models)111The dependence on IMF is negligible in this context: E.g., For a Scalo (1986) IMF, the factor is 1.57 rather than 1.61.. Given the turnover magnitude of 6.6 in the Milky Way, one would then expect to see the turnover for the ‘red’ GCs in NGC 1316 occur within the range 5.1 4.4, where the precise absolute magnitude of the turnover mainly depends on the relative importance of evaporation vs. tidal shocking. Note that this is beyond the 50 per cent completeness limit of the existing WFPC2 photometry (cf. Fig. 13). Further observations of NGC 1316 are necessary to test whether the turnover in the cluster LF indeed appears at the expected luminosity. Resolving this issue should be quite easy with the Advanced Camera for Surveys (ACS) which is currently scheduled to be commissioned in 2002 aboard HST.
4.4 Radial distribution and specific frequency
The specific frequency of GCs,
[1981], i.e., the number of star clusters per galaxy luminosity in units of = 15, is an important parameter of star cluster systems of galaxies. is known to increase systematically along the Hubble sequence, from 0.5 0.2 for Sc spirals to 2.6 0.5 for ellipticals outside galaxy clusters, albeit with considerable galaxy-to-galaxy scatter [1991]. As mentioned in Sect. 1, a sizable (and still steadily growing) number of HST observations of merger and starburst galaxies have led to a wealth of discoveries of young star clusters, consistent with the predictions of the ‘merger scenario’ for giant ellipticals (Schweizer 1987; Ashman & Zepf 1998 and references therein). An interesting question is then: Can the difference in specific frequency between ellipticals and spirals be accounted for by secondary populations of clusters created during (gas-rich) mergers? Again, NGC 1316 is a well-suited probe to test this possibility, in the sense that we know that its body has already settled down to a typical surface brightness law, we know the age of the major merger during which the secondary population of clusters were created, and it occurred long ago for dynamical evolution of the cluster system having already had a significant impact, making estimates for its future evolution less uncertain than for younger mergers. In the remainder of this section, we derive the current value of for NGC 1316 and place limits on its future evolution.
4.4.1 Radial surface density distribution
In order to determine the radial surface density distribution and the total number of clusters in NGC 1316, we use a hybrid method that combines the depth of the WFPC2 imaging with the much larger sky area covered by the NTT imaging. The resulting radial surface density distribution is shown in Fig. 14, and was derived as follows. We use the NTT imaging results for clusters outside the area covered by the dusty filaments (beyond a radius of 50′′), while we use the WFPC2 results inside that radius. Only clusters brighter than the NTT incompleteness limit were used ( 24.0). In both datasets, we calculated the number of clusters in four annuli, logarithmically spaced in galactocentric radius. Next, we divided the number of clusters by the appropriate area coverage to yield a surface density (taking into account the limited azimuthal sky coverage of the WFPC2 data). Finally, we have to subtract the surface density of foreground stars and compact background galaxies. For the WFPC2 data, we used the detected point sources in the field published by Elson et al. (1998; see also Grillmair et al. 1999) who observed a background field in the Fornax galaxy cluster with WFPC2, using the same filters and exposure times as in the NGC 1316 WFPC2 observations. For the NTT data, we considered the surface density of point sources in the WFPC2 background field to be a lower limit to the surface density of foreground stars and background galaxies in the NTT cluster candidate list, since ground-based seeing doesn’t allow one to discriminate point sources from distant compact galaxies. We estimated the level of background galaxy contamination using the Canada-France Redshift Survey (CFRS) data (Lilly et al. 1995), within the appropriate region of the , CMD. Background galaxies at the bright end of our -magnitude range peak at 1.0 and become bluer towards fainter magnitudes. The resulting estimate of the surface density of background galaxies down to = 24.0 is 1.3 0.6 arcmin-2 (cf. also Elson et al. 1998). The background-corrected surface densities of star clusters from the NTT data (hereafter referred to as ‘case A’) are shown as filled circles in Fig. 14; open circles depict the surface densities that are only corrected for the detected targets in the WFPC2 background field (hereafter referred to as ‘case B’). Since some fraction of background galaxies in the NTT field has already been removed by means of our daophot-ii sharpness and roundness selection criteria, the true surface densities will lie somewhere in between the open and filled symbols.

Fig. 14 depicts the surface density distribution of the clusters, as well as that of the integrated light of the galaxy for comparison. The cluster surface density is seen to flatten off (in log-log space) towards the centre, relative to the integrated light profile (note that this excludes the possibility of being due to the presence of dust features in the inner regions). This is a known feature of GC systems of ‘normal, old’ giant ellipticals, in which this flattening is somewhat more pronounced (e.g., Grillmair et al. 1994; Forbes et al. 1998). This feature is most probably due to the accumulative effects of tidal shocking (which is most effective in the central regions, cf. Eq. 2) and dynamical friction during the first few dynamical time-scales after the assembly of the galaxy (see, e.g., Gnedin & Ostriker 1997). The somewhat more moderate flattening of the surface density of the cluster system of NGC 1316 towards the centre relative to that of ‘old’ giant ellipticals is consistent with the notion that NGC 1316 is only a few Gyr old.
Excluding the data points within a galactocentric radius of 40′′, we made least-square fits to the surface density data using a power law of the form
The best fit for the background-corrected data (‘case A’) is parametrized by = (13.0 1.1) arcmin-2 and = 1.61 0.08, and is depicted by a solid line in Fig. 14. The corresponding best-fitted slope for the data that were only corrected for the counts in the WFPC2 background field (‘case B’) is = 1.36 0.10, whereas the slope for the integrated -band light of the galaxy is = 1.41 0.02 in the same radial range. We conclude that the radial surface density of the clusters (down to = 24.0) is consistent with that of the underlying galaxy light. This situation is somewhat different from the case of GC systems of ‘normal’ giant ellipticals, for which the cluster distribution is typically somewhat more extended than that of the underlying starlight (e.g., Fleming et al. 1995; Forbes et al. 1998; Kundu et al. 1999). This is once again consistent with the intermediate-age nature of the NGC 1316 cluster system in view of the dynamical evolution-related issues mentioned above.
4.4.2 Present-day specific frequency
Using the radial surface density profile, we can estimate the total number of clusters and the specific frequency . In view of the observed radial extent of the surface density distribution, we decided to use 10 1 arcmin as the outer radius for the cluster system (the uncertainty in the radial extension of the cluster system was chosen somewhat arbitrarily, but in accordance with numerous previous studies of cluster systems). Given the power-law nature of the LF of the cluster system of NGC 1316, the derivation of is not as straightforward as for systems featuring log-normal LFs. In particular, the derived is a lower limit, as it depends on the applied faint-magnitude limit. Integrating the power-law fit to the surface density between log (radius) = 0.2 and +1.0 0.1 (with radius in units of arcmin), integrating over the completeness-corrected LF (described above in Section 4.3), and adding the number of clusters found in the WFPC2 data interior to log (radius) = 0.2 yields the total number of clusters. Table 1 lists the total number of clusters down to = 25.5 and = 26.0. (beyond which the completeness corrections become too uncertain) both for cases A and B described above. The corresponding specific frequencies are also listed, assuming = 8.53 (RC3), equivalent to = 23.27.
| Magnitude limit | ||||
|---|---|---|---|---|
| (Case A)∗ | (Case B)∗ | |||
| 1910 120 | 1.2 0.2 | 2805 225 | 1.5 0.2 | |
| 2405 210 | 1.5 0.3 | 3535 400 | 1.9 0.3 | |
Note to Table 1: ∗ Case A represents the case in which estimated contamination from both foreground stars and background galaxies (the latter estimate uses data from the CFRS survey) has been corrected for, while Case B is only corrected for the estimated contamination from foreground stars. Reality is likely to lie in between the two cases, as discussed in Sect. 4.4.
As discussed above, the ‘real’ specific frequency is most likely to lie in between the results for cases A and B. Hence, = 1.7 0.4 is our best estimate for the present-day specific frequency of clusters with 26.0. While this value of is on the low side for giant ellipticals, it is by no means extraordinary low: e.g., 6 giant ellipticals in the compilation of Harris (1991) have values lower than 1.7.
4.4.3 Evolution of the specific frequency
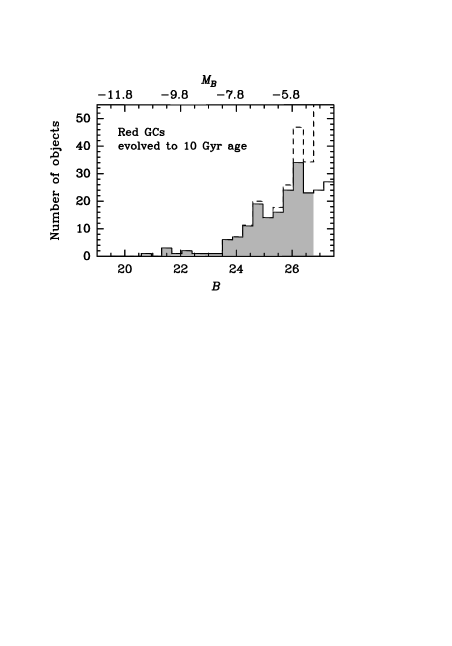
In order to draw a parallel between the in NGC 1316 and that of ‘normal, old’ giant ellipticals (e.g., with a luminosity-weighted population age of 10 Gyr), one has to take into account three main evolutionary effects: (i) Luminosity fading of the integrated -band light of NGC 1316, (ii) luminosity fading of the 3-Gyr-old, second-generation clusters, and (iii) disruption of low-mass clusters in the potential well of NGC 1316. As to effect (i) above, recent studies have shown that the (luminosity-weighted) age of the integrated light of NGC 1316 within 20′′ radius is 2 Gyr, as derived from optical line-strength indices (Kuntschner 2000). The age of the integrated light outside 20′′ radius is not as well constrained. However, the optical and near-IR colours in those regions are similar to those of ‘normal’ giant ellipticals (Schweizer 1980; Caon et al. 1994; Glass 1984), which may indicate that the stellar population there is similarly ‘old’. Table 2 lists the evolution of with time [using the Maraston (1998) SSP models for solar metallicity and a Salpeter IMF; the BC96 models give very similar results] for two simplified situations: (a) assuming that the current age of the integrated light of the whole galaxy is 2 Gyr, and (b) assuming that the age of the integrated light in the inner 20′′ is 2 Gyr, and 14 Gyr outside that. We consider reality to be most likely nearer the latter assumption. As to effect (ii) above, we considered the following. We divided the cluster candidate sample up into ‘blue’ and a ‘red’ subsamples. In this context, the ‘blue’ subsample was defined as the candidates with 1.0 1.65, whereas the ‘red’ subsample was defined by 1.65 2.5. The magnitudes of the ‘red’ clusters were then faded to an age of 10 Gyr according to the Maraston (2001) SSP models for solar metallicity and a Salpeter IMF. A new LF was created for this evolved ‘red’ GC population, which is shown in Fig. 15. To estimate the expected turnover magnitude for this GC population, we considered that for a GC of a given mass, the magnitude for solar metallicity is 1.1 mag fainter than for 0.03 solar (the median metallicity of the GC system of our Galaxy). Hence, the turnover magnitude for a solar metallicity GC system should be at 6.6 + 1.1 = 5.5 mag at 14 Gyr age, or 5.9 mag at 10 Gyr age (cf. Fig. 9b), corresponding to = 25.9 at the distance of NGC 1316. As to disruption of clusters during the evolution of a GC system, we refer to the simulations of Vesperini (2000) who showed that the great majority of the disrupted clusters are those with initial masses 105 M⊙ (cf. Fig. 13 of Vesperini 2000), corresponding to mag for solar-metallicity GCs at an age of 10 Gyr, which is beyond the turnover. Hence, this effect should not alter the LF of the clusters that are brighter than the turnover significantly.
Considering the above, we estimated the of the GC system of NGC 1316 at a merger age of 10 Gyr as follows. For the ‘blue’ population, we counted the GCs up to the absolute magnitude of the turnover of the LF of our Galaxy (6.6, i.e., = 25.2), corrected for incompleteness as a function of magnitude, and multiplied that number by a factor 2 (i.e., assuming a log-normal LF for the evolved GC system). The result is a total of 1950 140 ‘blue’ clusters. For the ‘red’ population, we counted the clusters having a ‘faded’ magnitude up to 25.9 (as discussed above), and multiplied that number by a factor 2 as well, leading to a total of 1450 145 clusters. The corresponding values are listed in Table 2, which shows that even if the currently intermediate-age stellar population in NGC 1316 only inhabits its central part, the specific cluster frequency will evolve to a value consistent with those of typical ellipticals in the field and poor groups (for which = 2.6 0.5, Harris 1991) at an age of 10 Gyr.
| Age | ||||
|---|---|---|---|---|
| Age (N1316) = 2 Gyr∗ | Age (N1316) = 2 Gyr + 14 Gyr∗ | |||
| 2 Gyr | +0.00 | 1.7 0.4 | +0.00 | 1.7 0.4 |
| 10 Gyr | +1.63 | 8.2 1.9 | +0.14 | 2.1 0.5 |
Note to Table 2: ∗ The values listed under the column header ‘Age (N1316) = 2 Gyr’ were calculated under the assumption that all integrated light of NGC 1316 is 2 Gyr old, while the values listed under ‘Age (N1316) = 2 Gyr + 14 Gyr’ were calculated under the assumption that only the integrated light within a galactocentric radius of 20′′ (which is currently 15% of the total light) is 2 Gyr old, while the rest is 14 Gyr old.
5 Summary
Using a combination of HST and large-field ground-based imaging of NGC 1316, a well-known early-type merger remnant galaxy for which we determined an age of 3 Gyr from spectra of its brightest GCs in Paper I, we presented the optical and near-IR photometric properties of its star cluster system in this paper. Our main results are itemized below, followed by a short discussion.
-
•
The colour distribution of the clusters exhibits two peaks: One at 1.5 (coinciding with the peak colour of the Galactic GC system) and one at 1.8. The brightest clusters mainly populate the red peak, while the blue peak gets more populated going towards fainter magnitudes. The clusters in the red peak make up about 50–60 per cent of the total cluster population.
-
•
By comparing the photometric properties of the brightest 8 clusters with the those of the Galactic GC system as well as with current SSP models which include the contribution of the AGB phase of stellar evolution, we find that
-
1.
They are up to an order of magnitude more luminous than Cen, the most massive GC in our Galaxy, and hence are most probably significantly younger than 10–14 Gyr;
-
2.
Their optical-near-IR colours are not as red as intermediate-age (0.3–1.5 Gyr old) GCs such as found in the Magellanic Clouds and in NGC 7252 (which are due to the presence of TP-AGB stars). Instead, their optical and near-IR colours are all best fit by a 2.5–3 Gyr old population of roughly solar metallicity, consistent with the results from our earlier spectral analysis (cf. Paper I).
Together with the optical properties of the cluster system described in the previous item, these results are consistent with a scenario involving the presence of two cluster subpopulations in NGC 1316: (i) A ‘red’ ( 1.8) population of clusters which were created during a major gas-rich merger that occurred 3 Gyr ago, having solar metallicity to within 0.15–0.2 dex (as derived from spectra in Paper I), and (ii) a ‘blue’ ( 1.5) population of ‘old’, metal-poor clusters that were associated with the halos of the pre-merger galaxies. We show that under this assumption, the ‘red’ clusters will evolve to 2.15 in a time span of 10 Gyr, which colour is remarkably similar to those of the red peaks observed in bimodal distributions of cluster colours in well-studied ‘normal, old’ giant ellipticals with galaxy luminosities similar to that of NGC 1316, suggesting that the red clusters in giant ellipticals have a similar origin.
-
1.
-
•
The luminosity function (LF) of the cluster population is best represented by a power law with a slope . The power-law behaviour is dominated by the ‘red’ clusters; the LF of clusters populating the blue end of the colour distribution shows evidence for a ‘turnover’ as found in the GC systems of nearby galaxies like the Milky Way and M 31. The power-law slope of the GC system of NGC 1316 is flatter than those found in ‘young’ mergers with ages 500 Myr. We suggest that this flattening of the power-law LF slope represents a stage in the dynamical evolution of star cluster mass functions that is intermediate between those found in ‘young’ merger remnants and those found in ‘normal’, old giant ellipticals (which show a log-normal LF). Using simple scaling relations between time-scales of long-term cluster disruption processes (tidal shocking and evaporation), we estimate the absolute magnitude of the turnover of the LF of a 3 Gyr old cluster population to be in the range 5.1 4.4, which is beyond the 50% completeness limit of the available WFPC2 data.
-
•
The radial distribution of the surface number density of NGC 1316’s star cluster system is consistent with that of its integrated light in the outer regions, while it flattens off slightly towards the centre relative to the integrated light. The latter flattening towards the centre is significantly less pronounced than in ‘old’ giant ellipticals, in which the outer surface density profile of clusters is typically more extended than that of the underlying starlight. These findings suggest that the cluster system of NGC 1316 (and, by analogy, of giant ellipticals in general), originally experienced the same violent relaxation as did the main body of the merger remnant, after which tidal shocking of (mosty inner) clusters cause the cluster surface density profile to become gradually flatter with time.
-
•
The present-day specific frequency of clusters with is = 1.7 0.4. After taking into account age dimming of the 3-Gyr-old clusters as well as of the integrated light of the galaxy to an age of 10 Gyr [under the conservative assumption that only the inner 20′′ radius of the stellar population of NGC 1316 has a luminosity-weighted age of 2 Gyr (as derived spectroscopically by Kuntschner 2000) and that the rest of the light is from 14 Gyr old stars], the specific frequency will increase to 2.1 0.5, which is consistent with those found in ellipticals in the field and poor groups.
All these features of the star cluster system of NGC 1316 constitute important evidence in support of ‘merger scenarios’ for forming giant elliptical galaxies through major gas-rich mergers. I.e., the system of luminous, metal-rich clusters in NGC 1316 is consistent with being a recently-formed analog of the ‘red’ clusters in ‘normal’ giant elliptical galaxies.
6 Outstanding issues
The presence of very luminous second-generation GCs in NGC 1316 that are of an age at which dynamical evolution is likely to have already had a significant impact is relevant to a number of outstanding issues of interest going beyond the particular case of NGC 1316. One such issue is whether the mass function of clusters created in mergers is biased towards higher masses than that of clusters in ‘normal’ galaxies. E.g., W3, the brightest cluster in NGC 7252 (Whitmore et al. 1993) has a reported absolute magnitude (Miller et al. 1997). At its age of 300 Myr and its metallicity of 0.5 , Maraston et al. [2001] derive a mass of 3.7 107 M⊙ (for a Salpeter IMF), which is 10 times higher than the mass of Cen. Even for a significantly older merger remnant such as NGC 1316, the brightest cluster (designated # 114 in Paper I) has , which translates to a mass of (1.4 0.2) 107 M⊙ at an age of 3.0 0.5 Gyr and solar metallicity (for a Salpeter IMF): still a factor 5 higher than the mass of Cen. The masses of these bright clusters will be checked by high-dispersion dynamical measurements using the ESO VLT in order to enable further study of mass functions of GCs created in mergers. This will be the subject of a forthcoming paper.
Another important outstanding issue is whether or not such second-generation clusters show supersolar [/Fe] element ratios. The stellar populations of many ‘normal, old’ giant ellipticals are known to be -enhanced by 0.2–0.3 dex (Worthey, Faber & González 1992; Davies, Sadler & Peletier 1993; Kuntschner 2000). Recent models of galaxy formation that incorporate the evolution of chemical enrichment of the ISM during bursts (Thomas, Greggio & Bender 1999) show that such -element enhancements can be reached by merging of small sub-galactic entities on a short time scale ( 1 Gyr) so that much of the chemical enrichment of the ISM is performed in situ by type II supernovae, which are the main producers of elements. Hence, if major gas-rich mergers are indeed responsible for forming giant elliptical galaxies (and the second-generation clusters), those mergers most likely occurred up to a few Gyr after the pre-merger galaxies were created. This allowed time for the latter’s ISM to become sufficiently enriched (most probably primarily by SN II ejecta, cf. Thomas et al. 1999). New observations should be conducted to find out whether or not the ‘red’ clusters in ‘normal’ giant ellipticals show supersolar element abundances. If found, this will constitute an important constraint to merger models such as the well-known ‘hierarchical’ merger model for elliptical galaxies (e.g., Kauffmann 1996) in the sense that the building blocks that form giant elliptical galaxies must have already existed 109 yr after the ‘halo’ GCs around galaxies were formed.
However, merging of two sizable gas-rich spirals at late epochs (which is relevant to young and intermediate-age merger remnants such as NGC 1316 and NGC 7252) is not expected to produce supersolar -element abundances, because most of the stars in the merging spiral disks have formed in a long-lasting ( 10 Gyr) star formation process, leading to approximately solar abundances and element ratios in their ISM. If stars form out of such gas with a Salpeter IMF, they are expected to show roughly solar [/Fe] ratios. In such mergers at late epochs, -enhancement only occurs in models featuring a significantly flattened IMF during the major starburst following the merger (Thomas et al. 1999). At an age of 3 Gyr, the spectral features of Magnesium and Iron in the blue-visual region should be easily detectable. Thus, the bright clusters in NGC 1316 are very interesting probes to test such scenarios for chemical enrichment of merging galaxies.
Acknowledgments.
This work is based on observations obtained at the European Southern Observatory, La Silla, Chile (Observing Programme 58.E–0666), and on archival data of the NASA/ESA Hubble Space Telescope, which is operated by AURA, Inc., under NASA contract NAS 5–26555. We are grateful to the European Southern Observatory for allocating observing time to this project, and for having done a great job of archiving observations made with the NTT since its inauguration. We thank Chris Lidman and the technical support staff of the European Southern Observatory for their support during the near-IR observations, Brad Whitmore and Markus Kissler–Patig for very useful discussions, and the referee Jean Brodie for comments that led to an improvement of the paper. MVA was partially supported by grants from CONICET, Agencia Nacional de Promoción Científica y Tecnológica and Secretaría de Ciencia y Técnica de la Universidad Nacional de Córdoba, Argentina. MVA also thanks the Chilean Fondecyt for a visitor grant. CM is supported by the ‘Sonderforschungsbereich 375-95 für Astro-Teilchenphysik’ of the Deutsche Forschungsgemeinschaft. DM’s work was performed in part under the auspices of the Chilean Fondecyt Nos. 01990440 and 07990048, and of DIPUC No. 98.16e.
References
- [1978] Aaronson, M., Cohen, J. G., Mould, J., Malkan, M., 1978, ApJ, 223, 824
- [1985] Aguilar, L. A., White, S. D. M., 1985, ApJ, 295, 374
- [1988] Aguilar, L. A., Hut, P., Ostriker, J. P., 1988, ApJ, 335, 720
- [1998] Arnaboldi, M., Freeman, K. C., Gerhard, O., et al., 1998, ApJ, 507, 759
- [1992] Ashman, K. M., Zepf, S. E., 1992, ApJ, 384, 50
- [1998] Ashman, K. M., Zepf, S. E., 1998, Globular Cluster Systems. Cambridge University Press, Cambridge
- [1998] Brodie, J. P., Schroder, L. L., Huchra, J. P., Phillips, A. C., Kissler–Patig, M., Forbes, D. A., 1998, AJ, 116, 691
- [1993] Bruzual, G. A., Charlot, S., 1993, ApJ, 405, 538
- [1996] Bruzual, G. A., Charlot, S., 1996, private communication (BC96)
- [1984] Burstein, D., Heiles, C., 1984, ApJS, 54, 33
- [1994] Caon, N., Capaccioli, M., D’Onofrio, M., 1994, A&AS, 106, 199
- [1995] Carter, B. S., Meadows, V. S., 1995, MNRAS, 276, 734
- [1982] Cohen, J. G., 1982, ApJ, 258, 143
- [1981] Cohen, J. G., Frogel, J. A., Persson, S. E., Elias, J. H., 1981, ApJ, 249, 481
- [1998] Côté, P., Marzke, R. O., West, M. J., 1998, ApJ, 501, 554
- [1993] Davies, R. L., Sadler, E. M., Peletier, R. F., 1993, MNRAS, 262, 650
- [1997] D’Onofrio, M., Capaccioli, M., Zaggia, S. R., Caon, N., 1997, MNRAS, 289, 847
- [2001] Drinkwater, M. J., Gregg, M. D., Colless, M., 2001, ApJ, 548, L139
- [1997] Elmegreen, B. G., Efremov, Yu. N., 1997, ApJ, 480, 235
- [1985] Elson, R. A. W., Fall, S. M., 1985, PASP, 97, 692
- [1996] Elson, R. A. W., Santiago, B., 1996, MNRAS, 278, 617
- [1998] Elson, R. A. W., Grillmair, C. J., Forbes, D. A., Rabban, M., Williger, G. M., Brodie, J. P., 1998, MNRAS, 295, 240
- [1977] Fall, S. M., Rees, M. J., 1977, MNRAS, 181, 37
- [1989] Ferguson, H. C., 1989, AJ, 98, 367
- [2000] Ferrarese, L., Ford, H. C., Huchra, J. P., et al., 2000, ApJS, 128, 431
- [1995] Fleming, D. E. B., Harris, W. E., Pritchet, C. J., Hanes, D. A., 1995, AJ, 109, 1044
- [2001] Forbes, D. A., Forte, J. C., 2001, MNRAS, 322, 257
- [1997] Forbes, D. A., Brodie, J. P., Grillmair, C. J., 1997, AJ, 113, 1652
- [1998] Forbes, D. A., Grillmair, C. J., Williger, G. M., Elson, R. A. W., Brodie, J. P., 1998, MNRAS, 293, 325
- [1982] Forte, J. C., Martinez, R. E., Muzzio, J. C., 1982, AJ, 87, 1465
- [1990] Frogel, J. A., Mould, J. R., Blanco, V. M., 1990, ApJ, 352, 96
- [1999] Gallagher, J. S. III, Smith, L. J., 1999, MNRAS, 304, 540
- [1996] Geisler, D., Lee, M. G., Kim, E., 1996, AJ, 111, 1529
- [1984] Glass, I. S., 1984, MNRAS, 211, 461
- [1997] Gnedin, O. Y., Ostriker, J. P., 1997, ApJ, 474, 223
- [1994a] Goudfrooij, P., Hansen, L., Jørgensen, H. E., Nørgaard-nielsen, H. U., de Jong, T., van den Hoek, L. B., 1994a, A&AS, 104, 179
- [2001] Goudfrooij, P., Mack, J., Kissler–Patig, M., Meylan, G., Minniti, D., 2001, MNRAS, 643, 657 (Paper I)
- [1994] Grillmair, C. J., Faber, S. M., Lauer, T. R., et al., 1994, AJ, 108, 102
- [1999] Grillmair, C. J., Forbes, D. A., Brodie, J. P., Elson, R. A. W., 1999, AJ, 117, 167
- [1991] Harris, W. E., 1991, ARA&A, 29, 543
- [1996] Harris, W. E., 1996, AJ, 112, 1487
- [1981] Harris, W. E., van den Bergh, S., 1981, AJ 86, 1627
- [1995] Hibbard, J. E., Mihos, J. C., 1995, AJ, 110, 140
- [1992] Holtzman, J. A., Faber, S. M., Shaya, E. J., et al. 1992, AJ, 103, 691
- [1995] Holtzman, J. A., Burrows, C. J., Casertano, S., et al., 1995, PASP, 107, 165
- [1983] Iben, I. Jr., Renzini, A., 1983, ARA&A, 21, 271
- [1992] Jog, C. J., Solomon, P. M., 1992, ApJ, 387, 152
- [1996] Kauffmann, G., 1996, MNRAS, 281, 487
- [1999] Kundu, A., Whitmore, B. C., Sparks, W. B., et al., 1999, ApJ, 513, 733
- [2001] Kundu, A., Whitmore, B. C., 2001, AJ, in press (astro-ph/0103021)
- [2000] Kuntschner, H., 2000, MNRAS, 315, 184
- [1999] Lançon, A., 1999, in Le Bertre T., Lebre A., and Waelkens C., Asymptotic Giant Branch Stars. Kluwer, Dordrecht, p. 579
- [1992] Landolt, A. U., 1992, AJ, 104, 340
- [2001] Larsen, S. S., Brodie, J. P., Huchra, J. P., Forbes, D. A., Grillmair, C. J., 2001, AJ, in press (astro-ph/0102374)
- [1998] Maraston, C., 1998, MNRAS, 300, 872
- [1999] Maraston, C., 1999, in Carral, P. & J. Cepa, eds, Star formation in Early-type Galaxies. ASP, San Francisco, p. 28
- [2001] Maraston, C., Kissler-Patig, M., Brodie, J. P., et al., 2001, A&A, in press
- [1995] Meurer, G. R., Heckman, T. M., Leitherer, C., et al., 1995, AJ, 110, 2665
- [1997] Meylan, G., Heggie, D. C., 1997, A&AR, 8, 1
- [1997] Miller, B. W., Whitmore, B. C., Schweizer, F., Fall, S. M., 1997, AJ, 114, 2381
- [1995] Minniti, D., 1995, AJ, 109, 1663
- [1996] Minniti, D., Alonso, M. V., Goudfrooij, P., Jablonka, P., Meylan, G., 1996, ApJ, 467, 221
- [1997] Murali, C., Weinberg, M. D., 1997, MNRAS, 288, 749
- [1995] Olszewski, E. W., 1995, in Gilmore G., van der Kruit P., eds., Stellar Populations. Kluwer, Dordrecht, p. 181
- [1983] Persson, S. E., Aaronson, M., Cohen, J. G., Frogel, J. A., Mathews, K., 1983, ApJ, 266, 105
- [1981] Renzini, A., 1981, Ann. Phys. Fr., 6, 87
- [1981] Renzini, A., Voli, M., 1981, A&A, 94, 175
- [1986] Renzini, A., Buzzoni, A., 1986, in Chiosi C., Renzini A., Spectral Evolution of Galaxies. Reidel, Dordrecht, p. 195
- [1998] Riess, A. G., Filippenko, A. V., Challis, P., et al., 1998, AJ, 116, 1009
- [1955] Salpeter, E. E., 1955, ApJ, 121, 161
- [1987] Sandage, A. R., Tammann, G. A., 1987, A Revised Shapley-Ames Catalog of Bright Galaxies. Carnegie Institution of Washington, Washington, D.C.
- [1996] Sanders, D. B., Mirabel, I. F., 1996, ARA&A, 34, 749
- [1986] Scalo, J. M., 1986, Fundam. Cosmic Phys., 11, 1
- [1980] Schweizer, F., 1980, ApJ, 237, 303
- [1981] Schweizer, F., 1981, ApJ, 246, 722
- [1987] Schweizer, F., 1987, in Faber S. M., Nearly Normal Galaxies. Springer, New York, p. 18
- [1998] Schweizer, F., 1998, in Friedli D., Martinet L., Pfenniger D., eds, ‘Galaxies: Interactions and Induced Star Formation’. Springer, Berlin, p. 105
- [1998] Schweizer, F., Seitzer, P., 1998, AJ, 116, 2209
- [1996] Schweizer, F., Miller, B. W., Whitmore, B. C., Fall, S. M., 1996, AJ, 112, 1839
- [1994] Searle, L., Wilkinson, A., Bagnuolo, W. G., 1980, ApJ, 239, 803 (SWB)
- [1998] Schlegel, D. J., Finkbeiner, D. P., Davis, M., 1998, ApJ, 500, 525
- [2001] Smith, L. J., Gallagher, J. S. III, 2001, MNRAS, in press (astro-ph/0104429)
- [1987] Stetson, P. B., 1987, PASP, 99, 191
- [1972] Spitzer, L., Chevalier, R. A., 1973, ApJ, 183, 565
- [1999] Terlevich, A. I, Kuntschner, H., Bower, R. G., Caldwell, N., Sharples, R. M., 1999, MNRAS, 310, 445
- [1999] Thomas, D., Greggio, L., Bender, R., 1999, MNRAS, 302, 537
- [1981] van den Bergh, S., 1981, A&AS, 46, 79
- [1995] van den Bergh, S., 1995, ApJ, 450, 27
- [2000] Vesperini, E., 2000, MNRAS, 318, 841
- [1979] Wegner, G., 1979, Ap&SS, 60, 15
- [1991] Westerlund, B. E., Azzopardi, M., Rebeirot, E., Breysacher, J., 1991, A&AS, 91, 425
- [1997] Whitmore, B. C., 1997, in Livio M., ed., The Extragalactic Distance Scale. Cambridge University Press, Cambridge, p. 254
- [1993] Whitmore, B. C., Schweizer, F., Leitherer, C., Borne, K., Robert, C., 1993, AJ, 106, 1354
- [1997] Whitmore, B. C., Miller, B. W., Schweizer, F., Fall, S. M., 1997, AJ, 114, 1797
- [1999a] Whitmore, B. C., Heyer, I., Casertano, S., 1999a, PASP, 111, 1559
- [1999b] Whitmore, B. C., Zhang, Q., Leitherer, C., Fall, S. M., Schweizer, F., Miller, B. W., 1999b, AJ, 118, 1551
- [1992] Worthey, G., Faber, S. M., González, J. J., 1992, ApJ, 398, 69
- [1995a] Zepf, S. E., Carter, D., Sharples, R. M., Ashman, K. M., 1995a, ApJ, 445, L19
- [1995b] Zepf, S. E., Ashman, K. M., Geisler, D., 1995b, ApJ, 443, 570
- [1999] Zepf, S. E., Ashman, K. M., English, J., Freeman, K. C., Sharples, R. M., 1999, AJ, 118, 752
Appendix A Photometry tables of star cluster candidates
| RA | DEC | |||||
|---|---|---|---|---|---|---|
| arcsec | arcsec | mag | mag | mag | mag | mag |
| 8.91 | 11.46 | 19.627 0.003 | 1.866 0.005 | 15.78 0.04 | 0.83 0.06 | 0.15 0.06 |
| 48.09 | 22.24 | 20.241 0.003 | 1.744 0.004 | 16.60 0.06 | 0.78 0.08 | 0.11 0.08 |
| 25.01 | 13.04 | 20.343 0.003 | 1.700 0.005 | 16.75 0.07 | 0.95 0.09 | 0.18 0.09 |
| 12.17 | 12.14 | 20.467 0.003 | 1.935 0.005 | 15.83 0.05 | 0.95 0.08 | 0.35 0.07 |
| 43.94 | 38.32 | 20.523 0.003 | 1.740 0.005 | 16.73 0.06 | 0.83 0.08 | 0.28 0.08 |
| 4.13 | 10.50 | 20.918 0.005 | 2.103 0.005 | 16.74 0.07 | 1.06 0.11 | 0.22 0.10 |
| 45.15 | 21.03 | 20.967 0.005 | 1.757 0.006 | 17.41 0.10 | 0.86 0.13 | 0.23 0.13 |
| 53.03 | 23.58 | 21.313 0.007 | 1.972 0.008 | |||
| 12.77 | 3.75 | 21.609 0.008 | 2.047 0.010 | |||
| 59.81 | 33.74 | 22.094 0.008 | 1.721 0.011 | |||
| 3.99 | 74.26 | 22.373 0.009 | 1.959 0.011 | |||
| 15.88 | 9.49 | 22.413 0.012 | 1.618 0.017 | |||
| 49.09 | 31.98 | 22.430 0.010 | 1.754 0.013 | |||
| 1.02 | 13.66 | 22.483 0.009 | 1.918 0.013 | |||
| 37.20 | 72.27 | 22.654 0.010 | 1.740 0.013 | |||
| 1.74 | 33.59 | 22.656 0.013 | 1.909 0.015 | |||
| 63.76 | 21.37 | 22.657 0.011 | 1.771 0.014 | |||
| 20.40 | 63.09 | 22.706 0.012 | 2.178 0.013 | |||
| 25.66 | 9.95 | 22.729 0.016 | 2.071 0.019 | |||
| 2.52 | 9.22 | 22.743 0.015 | 1.883 0.022 | |||
| 43.14 | 72.73 | 22.770 0.011 | 2.125 0.013 | |||
| 23.15 | 39.81 | 22.870 0.015 | 1.813 0.019 | |||
| 13.54 | 18.60 | 22.908 0.023 | 1.605 0.028 | |||
| 6.76 | 15.93 | 22.950 0.014 | 2.430 0.016 | |||
| 38.30 | 64.33 | 22.951 0.013 | 1.469 0.017 | |||
| 29.16 | 46.12 | 23.006 0.016 | 1.868 0.018 | |||
| 5.48 | 7.77 | 23.030 0.021 | 1.916 0.025 | |||
| 41.55 | 23.01 | 23.041 0.017 | 1.677 0.021 | |||
| 62.41 | 54.32 | 23.066 0.015 | 1.604 0.018 | |||
| 24.13 | 2.52 | 23.074 0.022 | 1.781 0.026 | |||
| 24.49 | 78.68 | 23.089 0.013 | 1.534 0.017 | |||
| 8.07 | 7.71 | 23.131 0.022 | 2.207 0.025 | |||
| 28.74 | 13.85 | 23.134 0.022 | 1.867 0.026 | |||
| 21.48 | 42.39 | 23.197 0.021 | 1.381 0.027 | |||
| 27.23 | 2.73 | 23.256 0.026 | 1.493 0.035 | |||
| 52.60 | 13.63 | 23.276 0.020 | 1.636 0.024 | |||
| 15.78 | 6.93 | 23.278 0.023 | 1.615 0.030 | |||
| 34.60 | 27.10 | 23.288 0.023 | 1.754 0.027 | |||
| 21.84 | 75.37 | 23.292 0.017 | 1.644 0.021 | |||
| 0.27 | 13.01 | 23.295 0.022 | 2.309 0.025 | |||
| 36.77 | 5.88 | 23.302 0.021 | 1.514 0.028 | |||
| 82.63 | 46.10 | 23.302 0.016 | 1.642 0.020 | |||
| 13.36 | 19.33 | 23.311 0.033 | 1.958 0.039 | |||
| 53.16 | 79.19 | 23.320 0.018 | 1.328 0.023 | |||
| 41.75 | 38.95 | 23.327 0.018 | 1.674 0.023 | |||
| 85.71 | 52.72 | 23.350 0.015 | 1.722 0.019 | |||
| 21.31 | 13.12 | 23.352 0.026 | 1.464 0.034 | |||
| 12.11 | 45.72 | 23.379 0.019 | 1.230 0.028 | |||
| 54.35 | 52.15 | 23.389 0.023 | 1.790 0.027 | |||
| 49.59 | 7.15 | 23.394 0.019 | 1.641 0.026 |
Note to Table 3: The first two columns give the positional offsets of the GC candidates from the centre of NGC 1316 in RA and DEC, respectively.
| RA | DEC | ||||||
|---|---|---|---|---|---|---|---|
| arcsec | arcsec | mag | mag | mag | mag | mag | mag |
| 158.09 | 64.95 | 20.17 0.19 | 0.98 0.20 | 1.78 0.20 | |||
| 50.75 | 46.88 | 20.64 0.23 | 0.87 0.25 | 1.45 0.25 | |||
| 84.07 | 163.18 | 20.71 0.24 | 0.97 0.26 | 1.73 0.25 | |||
| 148.33 | 132.35 | 20.79 0.25 | 0.90 0.27 | 1.67 0.26 | |||
| 53.89 | 23.29 | 20.83 0.01 | 1.04 0.09 | 1.82 0.01 | |||
| 53.89 | 23.29 | 20.83 0.26 | 1.04 0.27 | 1.82 0.27 | |||
| 60.97 | 94.40 | 20.88 0.26 | 0.93 0.28 | 1.70 0.28 | |||
| 67.31 | 54.96 | 21.03 0.28 | 0.78 0.30 | 1.37 0.30 | |||
| 67.31 | 54.96 | 21.03 0.28 | 0.78 0.30 | 1.37 0.30 | |||
| 178.46 | 52.70 | 21.15 0.30 | 0.72 0.32 | 1.13 0.32 | |||
| 86.04 | 191.25 | 21.22 0.31 | 0.72 0.33 | 1.01 0.34 | |||
| 160.04 | 150.52 | 21.23 0.31 | 0.64 0.34 | 0.99 0.34 | |||
| 123.07 | 8.43 | 21.50 0.35 | 1.01 0.37 | 1.83 0.36 | |||
| 40.89 | 198.75 | 21.57 0.36 | 0.68 0.39 | 1.02 0.39 | |||
| 141.71 | 0.40 | 21.60 0.36 | 1.20 0.38 | 2.06 0.38 | |||
| 12.87 | 129.47 | 21.71 0.38 | 0.86 0.41 | 1.51 0.41 | |||
| 203.34 | 21.51 | 21.73 0.39 | 0.72 0.42 | 0.99 0.43 | |||
| 71.17 | 20.14 | 21.75 0.39 | 0.85 0.42 | 1.64 0.41 | |||
| 127.28 | 31.86 | 21.79 0.40 | 0.97 0.42 | 1.71 0.42 | |||
| 60.05 | 17.62 | 21.83 0.41 | 0.97 0.44 | 1.71 0.43 | |||
| 5.25 | 74.90 | 21.96 0.01 | 0.85 0.17 | 1.57 0.01 | |||
| 129.89 | 142.12 | 21.97 0.44 | 0.31 0.49 | 1.23 0.47 | |||
| 93.83 | 49.74 | 21.97 0.43 | 0.92 0.46 | 1.71 0.46 | |||
| 171.13 | 176.59 | 22.00 0.44 | 1.09 0.46 | 1.99 0.46 | |||
| 15.98 | 49.92 | 22.07 0.45 | 0.99 0.48 | 1.86 0.47 | |||
| 140.28 | 58.05 | 22.08 0.46 | 0.99 0.49 | 1.73 0.48 | |||
| 9.71 | 49.94 | 22.10 0.46 | 0.96 0.49 | 1.82 0.48 | 18.08 0.15 | 1.23 0.20 | 0.50 0.20 |
| 94.24 | 5.95 | 22.15 0.47 | 1.14 0.50 | 2.02 0.49 | |||
| 133.37 | 106.62 | 22.16 0.47 | 0.87 0.51 | 1.52 0.50 | |||
| 113.18 | 80.14 | 22.17 0.47 | 0.90 0.51 | 1.62 0.50 | |||
| 190.76 | 9.15 | 22.21 0.49 | 0.56 0.53 | 1.38 0.52 | |||
| 119.69 | 7.11 | 22.34 0.51 | 1.02 0.55 | 1.78 0.54 | |||
| 76.75 | 85.49 | 22.50 0.55 | 1.02 0.59 | 1.59 0.58 | |||
| 69.04 | 6.28 | 22.51 0.56 | 0.84 0.60 | 1.58 0.59 | |||
| 115.13 | 112.73 | 22.51 0.56 | 1.01 0.59 | 1.79 0.58 | |||
| 120.31 | 70.95 | 22.55 0.57 | 0.91 0.61 | 1.69 0.60 | |||
| 93.24 | 2.41 | 22.57 0.57 | 1.01 0.61 | 1.77 0.60 | |||
| 100.24 | 77.63 | 22.59 0.57 | 1.05 0.61 | 1.91 0.60 | |||
| 110.05 | 148.12 | 22.60 0.58 | 1.07 0.61 | 1.82 0.61 | |||
| 156.04 | 17.66 | 22.60 0.58 | 0.79 0.63 | 1.34 0.62 | |||
| 122.96 | 82.64 | 22.61 0.59 | 0.61 0.64 | 1.22 0.63 | |||
| 33.49 | 164.70 | 22.63 0.59 | 0.91 0.63 | 1.64 0.62 | |||
| 37.41 | 59.81 | 22.63 0.59 | 0.99 0.63 | 1.54 0.63 | |||
| 110.55 | 1.67 | 22.67 0.60 | 1.08 0.63 | 1.72 0.63 | |||
| 18.57 | 108.55 | 22.67 0.60 | 0.86 0.64 | 1.72 0.63 | |||
| 10.99 | 63.23 | 22.73 0.63 | 0.63 0.68 | 1.15 0.68 | |||
| 104.57 | 106.84 | 22.75 0.62 | 0.41 0.69 | 1.03 0.68 | |||
| 100.28 | 56.20 | 22.75 0.63 | 0.57 0.68 | 1.32 0.67 | |||
| 140.89 | 114.79 | 22.77 0.63 | 0.74 0.68 | 1.39 0.67 | |||
| 27.38 | 104.95 | 22.81 0.64 | 0.96 0.68 | 1.68 0.67 |
Note to Table 4: The first two columns give the positional offsets of the GC candidates from the centre of NGC 1316 in RA and DEC, respectively.