National Astronomical Observatories, Chinese Academy of Sciences
Black hole mass and velocity dispersion of narrow line region in active galactic nuclei and narrow line Seyfert 1 galaxies
Controversy regarding whether Narrow Line Seyfert 1 galaxies (NLS1s) follow the same black hole — galactic bulge relation as normal galaxies has been raised by Mathur et al. (2001) and Ferrarese et al. (2001). In this paper, the correlation between the black hole mass and the velocity dispersion of the narrow line region, indicated by the [OIII] line width for a heterogeneous sample of NLS1s, is examined. We show that the non-virial component subtracted [OIII] width, which may well represent the stellar velocity dispersion (), correlates with the estimated black hole mass , made using the empirical law for broad line region size from the reverberation mapping measurements. Considering measurement errors, we find that the relation between and the [OIII] width in active galactic nuclei (both NLS1s in this paper and normal Seyferts in Nelson 2000) is consistent with that defined in nearby hot galaxies (ellipticals and spiral bulge) but with more scatter. It seems that there is no clear difference in the relation between and (represented by the [OIII] width for AGN) in both NLS1s and normal broad line active galactic nuclei from the same relation defined by nearby hot galaxies.
Key Words.:
black hole physics–galaxies: active–galaxies: nuclei–galaxies: Seyfert1 Introduction
Massive Black Holes (MBHs) are believed to exist in the centers of all active and many or most normal galaxies. High-resolution observations of various kinematic tracers of the central gravitational potential have resulted in the detections of numerous MBHs in nearby galaxies over the past decade (e.g. Kormendy & Richstone (1995); Ferrarese & Merritt (2000); Gebhardt et al. 2000a ; Sarzi et al. (2000); Ho (1999), and references therein). A relationship between the MBH mass and the mass of the spheroidal component was suggested by Kormendy (1993) and later quantified by Kormendy & Richstone (1995) and Magorrian et al. (1998). This correlation appears also in Seyfert 1 galaxies and QSOs, in which the MBH masses are measured either using reverberation mapping techniques (Wandel (1999)) or using the empirical relation between the Broad Line Region (BLR) size and nuclear luminosity (Laor (1998)). Laor (1998) found that the MBH mass-to-bulge mass ratio for a sample of PG QSOs is the same as that for nearby galaxies. In contrast, Wandel (1999) obtained a substantially lower MBH mass-to-bulge mass ratio for Seyfert 1 galaxies. This could be due to an overestimation of the bulge mass in Seyfert galaxies, e.g., a larger luminosity-to-mass ratio in the host galaxies, or an underestimation of central black hole masses using the reverberation mapping method (McLure & Dunlop (2000); Krolik (2000)), or an intrinsic difference in the MBH mass-to-bulge mass ratio for Seyfert galaxies and normal galaxies.
For nearby hot galaxies (ellipticals and spiral bulge), recent works by Gebhardt et al. (2000a) and Ferrarese & Merritt (2000) have demonstrated that the mass of a MBH is tightly correlated with the stellar velocity dispersion, which is obtained within a large aperture extending to the galaxy effective radius and thus with little influence of the MBH, with remarkably small scatter. Note that Gebhardt et al. (2000b) included also seven AGN, in which the MBH masses are obtained by the reverberation mapping method, and they found that these objects follow the same correlation with small scatter. Ferrarese et al. (2001) reached the same conclusion by making an accurate measurement of stellar velocity dispersions for 6 Seyfert galaxies, for which the masses of MBHs have been measured using reverberation mapping techniques.
The good correlation between the [OIII] width and the stellar velocity dispersion (Nelson & Whittle (1996)) indicates that the narrow-line width is primarily virial in origin and the Narrow Line Region (NLR) kinematics are mainly controlled by the gravitational potential of the galaxy bulge. For a sample of 32 AGN and QSOs in which the MBH masses have been measured from reverberation mapping, Nelson (2000) demonstrated a good relation between the MBH mass and the bulge velocity dispersion derived from the [OIII] width, which is consistent with the results of Gebhardt et al. (2000b) but with somewhat larger scattering. This agreement can be taken as evidence in support of the reverberation mapping method to measure the MBH masses in AGN.
The tight relation supports the theoretical arguments of a close link between the growth of MBHs and the galaxy or spheroidal formation. Several theoretical scenarios have been proposed to explain the or relation (e.g. Silk & Rees (1998); Fabian (1999); Ostriker (2000); Haehnelt & Kauffmann (2000)). Silk & Rees (1998) predicted , based on the back-reaction mechanism such that the kinetic energy associated with the output wind from the central BH-accretion disk system will evacuate the fueling gas when it is comparable to the bound energy of the gas in the bulge or host galaxy. Fabian (1999) further incorporated the Silk–Rees scenario into an obscured growth of MBHs model, and a consequent result is that most MBHs grow very fast in an obscured phase before they clean the surrounding dust and cold gas and appear as QSOs or AGN. This scenario can also explain both the and relation.
It is of particular interest to investigate the time evolution (or accretion history) of MBHs and thus reveal the physical link between the bulge formation and the MBH growth. One approach is to measure the masses of MBHs and bulge properties in high redshift QSOs and AGN and compare them with low redshift QSOs, AGN and nearby galaxies. Narrow Line Seyfert 1 galaxies (NLS1s) are suggested to be due to accretion rates close to the Eddington limit and have small BHs compared to normal Seyfert 1 galaxies at a given luminosity, and much evidence suggests that NLS1s might be normal Seyfert galaxies at an early stage of evolution ((Mathur, 2000, and references therein)). If this is true, NLS1s could be an ideal class of objects, together with normal Seyfert galaxies and QSOs, to study the accretion history and growth of MBHs. Therefore, it is also interesting to measure the masses of MBHs and bulge properties in NLS1s and compare them with those in Broad Line (BL) Seyfert 1 galaxies and nearby galaxies. Using the MBH mass estimated from spectra fitting by an accretion disk model and the virial mass of the broad line region, Mathur et al. (2001) found that NLS1s show systematically lower than BL AGN with the same bulge luminosity or [OIII] width of host galaxies. However, two NLS1s in the Ferrarese et al. (2001) sample follow the same relation as BL Seyfert 1 galaxies. The conflicting results in the literature suggest that further study is required. In the present paper, we investigate the correlation between the MBH mass and the [OIII] line width for a large sample of NLS1s (Veron-Cetty et al. (2001)) and find that NLS1s consistently follow the well-known relation defined in nearby galaxies.
2 Data and Analysis
A heterogeneous sample of 59 NLS1 galaxies were observed spectroscopically by Veron-Cetty et al. (2001) (hereafter VVG) with a moderate resolution of 3.4Å . The measurement of the instrument-subtracted [OIII] and H width as well as the optical magnitude at B band are listed in table 1. VVG found that, in general, the [OIII] lines of those NLS1s have a relatively narrow Gaussian profile (with Full Width at Half Maximum, hereafter FWHM, of km s-1) with often, in addition, a second broad blueshifted Gaussian component (with FWHM of km s-1). The blueshifted Gaussian component is proposed to be associated with those individual high-velocity clouds seen in the spatially resolved NLR of some nearby Seyfert galaxies, which is outflowing rather than virial bounded (e.g. NGC 4151: Kaiser et al. (2000)). The width of the narrow component is then adopted as the velocity dispersion of the virial NLR clouds if the line is fitted by a narrow component and a blueshifted broad component.
| Name | B | Z | NH | FWHM(H) | FWHM([OIII]) | RBLR | MBH |
|---|---|---|---|---|---|---|---|
| Mrk 335a | 13.7 | 0.025 | 3.8 | 245 | 0.63 | ||
| I ZW 1 | 14.0 | 0.061 | 5.1 | 1040 | |||
| Ton S 180 | 14.4 | 0.062 | 1.5 | 1085 | 435 | 89.8 | 1.16 |
| Mrk 359 | 14.2 | 0.017 | 4.8 | 900 | 180 | 19.0 | 0.17 |
| MS 01442-0055 | 15.6 | 0.080 | 2.8 | 1100 | 240 | 63.7 | 0.85 |
| Mrk 1044 | 14.3 | 0.016 | 3.0 | 1010 | 335 | 15.0 | 0.17 |
| HS 0328+0528 | 16.7 | 0.046 | 8.9 | 1590 | 220 | 18.9 | 0.53 |
| IRAS 04312+40 | 15.2 | 0.020 | 34.5 | 860 | 380 | 52.2 | 0.42 |
| IRAS 04416+12 | 16.1 | 0.089 | 14.1 | 1470 | 650 | 92.8 | 2.20 |
| IRAS 04576+09 | 16.6 | 0.037 | 13.5 | 1210 | 380 | 18.5 | 0.30 |
| IRAS 05262+44 | 13.6 | 0.032 | 38.3 | 740 | 365 | 342.3 | 2.06 |
| RXJ 07527+261 | 17.0 | 0.082 | 5.1 | 1185 | 400 | 29.9 | 0.46 |
| Mrk 382 | 15.5 | 0.034 | 5.8 | 1280 | 155 | 23.0 | 0.41 |
| Mrk 705 | 14.9 | 0.028 | 4.0 | 1790 | 365 | 23.6 | 0.83 |
| Mrk 707 | 16.3 | 0.051 | 4.7 | 1295 | 315 | 23.2 | 0.43 |
| Mrk 124 | 15.3 | 0.056 | 1.3 | 1840 | 380 | 43.0 | 1.60 |
| Mrk 1239 | 14.4 | 0.019 | 4.1 | 1075 | 400 | 18.9 | 0.24 |
| IRAS 09571+84 | 17.0 | 0.092 | 3.9 | 1185 | 240 | 33.4 | 0.52 |
| PG 1011-040 | 15.5 | 0.058 | 4.5 | 1455 | 400 | 46.3 | 1.08 |
| PG 1016+336 | 15.9 | 0.024 | 1.6 | 1590 | 315 | 8.9 | 0.25 |
| Mrk 142 | 15.8 | 0.045 | 1.2 | 1370 | 260 | 22.7 | 0.47 |
| KUG 1031+398 | 15.6 | 0.042 | 1.4 | 935 | 315 | 23.6 | 0.23 |
| RXJ 10407+330 | 16.5 | 0.081 | 2.2 | 1985 | 460 | 35.3 | 1.53 |
| Mrk 734 | 14.6 | 0.049 | 2.7 | 1825 | 180 | 59.6 | 2.18 |
| Mrk 739E | 14.1 | 0.030 | 2.2 | 1615 | 380 | 39.9 | 1.14 |
| MCG 06.26.012 | 15.4 | 0.032 | 1.9 | 1145 | 220 | 18.6 | 0.27 |
| Mrk 42 | 15.4 | 0.024 | 1.9 | 865 | 220 | 12.4 | 0.10 |
| NGC 4051a | 12.9 | 0.002 | 1.3 | 1120 | 200 | 1.8 | 0.13 |
| PG 1211+143a | 14.6 | 0.085 | 2.8 | 1975 | 410 | 132.6 | 4.05 |
| Mrk 766 | 13.6 | 0.012 | 1.8 | 1630 | 220 | 14.8 | 0.43 |
| MS 12170+0700 | 16.3 | 0.080 | 2.2 | 1765 | 365 | 39.4 | 1.35 |
| MS 12235+2522 | 16.3 | 0.067 | 1.8 | 800 | 240 | 29.9 | 0.21 |
| IC 3599 | 15.6 | 0.021 | 1.4 | 280 | 8.8 | ||
| PG 1244+026 | 16.1 | 0.048 | 1.9 | 740 | 330 | 21.2 | 0.13 |
| NGC 4748 | 14.0 | 0.014 | 3.6 | 1565 | 295 | 15.5 | 0.42 |
| Mrk 783 | 15.6 | 0.067 | 2.0 | 1655 | 430 | 47.4 | 1.43 |
| R 14.01 | 14.6 | 0.042 | 7.6 | 1605 | 430 | 60.5 | 1.71 |
| Mrk 69 | 15.9 | 0.076 | 1.1 | 1925 | 315 | 44.9 | 1.83 |
| 2E 1346+2646 | 16.5 | 0.059 | 1.1 | 180 | 21.2 | ||
| PG 1404+226 | 15.8 | 0.098 | 2.0 | 1120 | 950 | 72.4 | 1.00 |
| Mrk 684 | 14.7 | 0.046 | 1.5 | 1150 | 1290 | 48.2 | 0.70 |
| Mrk 478 | 14.6 | 0.077 | 1.0 | 1270 | 365 | 105.3 | 1.87 |
| PG 1448+273 | 15.0 | 0.065 | 2.7 | 1050 | 155 | 69.1 | 0.84 |
| MS 15198-0633 | 14.9 | 0.084 | 12.4 | 170.4 | |||
| Mrk 486 | 14.8 | 0.038 | 1.8 | 1680 | 400 | 34.9 | 1.08 |
| IRAS 15462-0450 | 16.4 | 0.100 | 12.5 | 1615 | 1600 | 83.9 | 2.40 |
| Mrk 493 | 15.1 | 0.031 | 2.0 | 740 | 315 | 21.7 | 0.13 |
| EXO 16524+393 | 16.7 | 0.069 | 1.7 | 1355 | 400 | 24.0 | 0.48 |
| B 31702+457 | 15.1 | 0.060 | 2.2 | 975 | 295 | 56.4 | 0.59 |
| RXJ 17450+480 | 15.9 | 0.054 | 3.1 | 1355 | 400 | 30.2 | 0.61 |
| Kaz 163 | 15.0 | 0.063 | 4.4 | 1875 | 480 | 71.7 | 2.77 |
| Mrk 507 | 15.4 | 0.053 | 4.3 | 1565 | 1025 | 43.0 | 1.16 |
| HS 1817+5342 | 15.2 | 0.080 | 4.9 | 1615 | 570 | 91.2 | 2.61 |
| HS 1831+5338 | 15.9 | 0.039 | 4.9 | 1555 | 240 | 20.7 | 0.55 |
| Mrk 896 | 14.6 | 0.027 | 4.0 | 1135 | 315 | 27.1 | 0.38 |
| MS 22102+1827 | 16.7 | 0.079 | 6.2 | 690 | 890 | 36.2 | 0.19 |
| Akn 564 | 14.2 | 0.025 | 6.4 | 865 | 220 | 35.4 | 0.29 |
| HS 2247+1044 | 15.8 | 0.083 | 6.2 | 1790 | 710 | 69.6 | 2.45 |
| Kaz 320 | 16.8 | 0.034 | 4.9 | 1470 | 260 | 9.5 | 0.23 |
2.1 Estimation of black hole masses
The size of the broad emission line region (BLR) can be estimated by the empirical relationship between the size and the monochromatic continuum luminosity at 5100Å (Kaspi et al. (2000)):
| (1) |
where is estimated from the B-magnitude by adopting an average optical spectral index of and accounting for Galactic reddening and K-correction (H0=75km s-1 Mpc-1, q0=0.5). Assuming that the BLR is virialized, the MBH mass can be estimated by , where is the gravitational constant, can be estimated from the emission line width, , by assuming BLR clouds in random orbit motion. The estimated BH masses are also listed in Table 1.
There are some uncertainties in the estimation of the MBH mass. First, a typical error of 0.2 mag in the B magnitude given in VVG would introduce an uncertainty of above 0.05 dex in MBH mass. Second, the continua are likely to be variable, but generally this variation is not larger than a factor of 2 for most AGN (cf. Kaspi et al. (2000)), which may introduce an uncertainty of 0.15 dex in the estimation of MBH mass. Third, using the empirical law of equation 1 to estimate the BLR size, the uncertainties are generally not much larger than a factor of 2 for those NLS1s in VVG sample (see Kaspi et al. (2000)) with range from to erg s-1, if those NLS1s do follow this empirical relation. Finally, a significant fraction of optical light may come from host galaxies. To make a quantitative estimation of this effect in a NLS1, we notice that , and . For NLS1, the typical value of should be around 0.5 (Puchnarewicz et al. 2001); the typical bulge mass to light ratio may be similar to nearby hot galaxies with ; and the MBH mass to bulge mass ratio may be similar to (or less than) nearby galaxies with of about 0.0015 — 0.003 (by an order of magnitude) (Merritt & Ferrarese 2001b; Gebhardt et al. 2000a; Mathur et al. 2001). The fraction of light at the optical band is for AGN and for bulge. Adopting those values, one obtains , which suggests that the stellar contribution to the measured optical luminosity should be much less (or less) than that from the nuclear emission. Thus, the uncertainty in the mass estimation is small in comparison with the intrinsic scatter in the mass of the sample. Combining all those uncertainties, the estimation of the MBH mass would typically have an uncertainty of about 0.5 dex.
2.2 Estimation of the bulge velocity dispersion
The [OIII] width can be converted to the stellar velocity dispersion by (Nelson & Whittle (1995)). Nelson (2000) has shown that the reverberation mapping measured MBH mass in AGN, for which the bulge velocity dispersion is derived from the [OIII] width, is in good agreement with the relation defined by nearby hot galaxies, which may support the assertion that the narrow line [OIII] width serves as a good representation of the bulge velocity dispersion. The derived this way is systematically lower than the stellar velocity dispersion from the absorption line width by 0.1 dex, while the mean deviation to the best fit line is 0.13 dex (Nelson & Whittle (1995)). This systematic difference will not affect the following statistical analysis significantly since it is much smaller than the intrinsic scatter in the [OIII] line width measurements.
The [OIII] width could be significantly over-estimated from the spectra with poor resolution (Veilleux 1991, hereafter V91). According to Figure 3 in V91, this overestimation could be as large as a factor of 1.2—1.5 if the spectral resolution is close to the intrinsic [OIII] width of the object. Note that three objects in VVG, Mrk 359, NGC 4051, Mrk 766, were also observed by Veilleux (1991) at a resolution of 10 km s-1, and the [OIII] line width (the width measured by VVG, the V91 width to the VVG width ratio) are 113 (180, 1.59), 162 (200, 1.23) and 180 (220, 1.22) km s-1, respectively. These values clearly support that the [OIII] line width is overestimated by a factor of 1.2—1.5 for those objects with intrinsic widths close to or less than the spectral resolution, i.e. 204 km s-1. As discussed by Whittle (1985), the detailed amount of the deviation is also sensitive to the line profile. This would suggest that the measured line width of less than 300 km s-1 may be overestimated by such a factor. In the following analysis, we will keep in mind this uncertainty, and discuss its consequences wherever appropriate. Note also that the [OIII] widths for most objects in the Nelson (2000) sample were measured from the spectra with high resolution, Å, corresponding to km s-1, which may not suffer from the overestimation due to spectral resolution, since measured [OIII] line widths are much larger than the spectral resolution.
2.3 to the bulge velocity dispersion relation
The relationship between the estimated MBH mass and the bulge velocity dispersion represented by the [OIII] width is shown in the left panel of Figures 1 and 2 for NLS1s in VVG, along with the same relationship for those BL AGN in Nelson (2000). Note that four objects, NGC 4051, Mrk 335, PG 1211+143 and Mrk 110, which have reverberation mapping measured MBH masses and high resolution () [OIII] line widths, in the Nelson (2000) sample are NL Seyfert 1 galaxies or QSOs. The former three objects are also included in VVG. The high quality data in Nelson (2000) are adopted for these three objects instead of the estimated ones from VVG. The effectiveness of using the empirical law to estimate the mass of MBHs in NLS1s may also be supported by the fact that the other NL objects, whose masses are estimated from the empirical law, follow the trend of these four NL objects in Figures 1 and 2. In the present paper, the stellar velocity dispersion derived from the [OIII] width is likely to represent the central velocity dispersion. For comparison, the nearby hot galaxies from Merritt & Ferrarese (2001a), for which values of and (the central stellar velocity dispersion) are measured from dynamical modeling of HST data, are therefore also plotted in Figure 1. Since there are different views on the slope of the relation defined in nearby galaxies (see Merritt & Ferrarese 2001a; Gebhardt et al. 2000a), a similar figure is also plotted (see Fig. 2) for comparison with the galaxies from Gebhardt et al. (2000a), in which the brightness weighted stellar velocity dispersions within the effective radius of galaxies are adopted.

It is clearly shown in Figures 1 and 2 that five NL objects, Mrk 507, Mrk 684, IRAS 15462-0450, MS 22102+1827, and PG 1404+226, having large [OIII] widths, deviate from other NL objects. Note that Mrk 507, Mrk 684, IRAS 15462-0450 are the three objects for which a narrow HII region contribution has been subtracted in the VVG sample. For spectra with a resolution of 3.4Å used by VVG, the HII component may not be reliably separated from a narrow component of NLR with width 200—500 km s-1 if an additional broad wing is present. Thus the widths of NLR in these three objects are likely to be significantly over-estimated. Only poor quality [OIII] profiles are available for MS 22102+1827 and PG 1404+226, and VVG mentioned that broad blueshifted [OIII] profiles should not be overlooked in PG 1404+226. These five objects will be excluded in the following statistic analysis. The galactic bulge mass of IC 4329A, which clearly deviates from other AGN in the Figure 1 in Nelson (2000), is one of the smallest in the Wandel (1999) sample of about solar mass. However, the bulge velocity dispersion derived from the [OIII] width of IC 4329A is one of the largest. The small bulge mass but large bulge velocity in this object compared with others in the Wandel (1999) sample is in contradiction with the Faber-Jackson relation. The high resolution radio map of IC 4329A consists of a compact core and with extended component to several kpc (Unger et al. 1987). If the extended component is the radio jet, then the large [OIII] width can be due to the non-virial component (Nelson & Whittle 1996). This object will also be removed from the sample in the following analysis.
Considering both the NL Seyfert 1 galaxies and NL QSOs in VVG and BL AGN in the Nelson (2000) sample, a Spearman rank correlation tests gives a strong correlation between and for 78 AGN with a correlation coefficient of corresponding to a probability of that the correlation is caused by a random factor, which can be fitted by a line with a slope of using an ordinary least-squares (OLS) bisector111 One should be cautious, as the use of OLS can be very misleading: linear fits not accounting for errors are known to underestimated the true slope of the relation. Merritt & Ferrarese (2001a), for example, have argued that the shallower slope found for the M- relation by Gebhardt et al. (2000) is due mostly to a bias introduced by neglecting the observational errors. In our sample, however, it is hard to assign errorbars to the BH masses and velocity dispersions for galaxies. (Isobe et al. (1990)) (represented by the solid line in the left panel of Figs. 1 and 2). This slope agrees well with the one defined in nearby hot galaxies derived by Gebhardt et al. (200a), but deviates from the one derived by Merritt & Ferrarese (2001a), and the MBH mass in AGN seems smaller than the one in nearby hot galaxies by 0.5 dex. If we only consider NL Seyfert 1 galaxies and NL QSOs (51 objects), the correlation is also moderately significant with (), which can be fitted by a line with a slope of using the OLS bisector (represented by the dotted line in the left panel of Figs. 1 and 2). Compared with the relation defined by nearby hot galaxies (Gebhardt et al. 2000a), we find the MBH mass in NLS1s is smaller than that in nearby hot galaxies by dex. However, we may not be able to draw a conclusion that the MBHs in NLS1s (or AGN) are systematically smaller than that in nearby hot galaxies at a given bulge velocity dispersion if the uncertainties in the estimation of MBH mass (about 0.5 dex) and possible overestimation of the [OIII] width (see following paragraph) are considered.
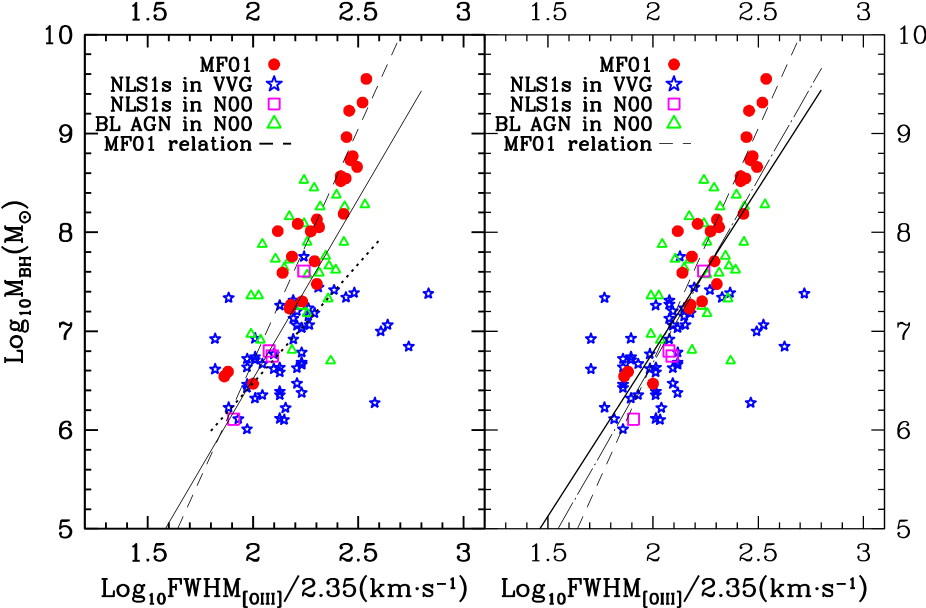
As discussed in § 2.2, the low spectral resolution could introduce an overestimation of the [OIII] width, probably by a factor of 1.2—1.5. The relationship between and are re-plotted in the right panel of Figure 2 by correcting this overestimation of a moderate factor 1.3 for NLS1s in VVG. Now, the correlation between and becomes very strong with a coefficient () for the combined sample (78 AGN), and can be fitted (using the OLS bisector) by
| (2) |
as shown by the solid line in the right panel of Figures 1 and 2. As seen in Figures 1 and 2, three objects, Mrk 382, Mrk 734 and PG 1448+273, which have the smallest [OIII] widths, deviate from the other NL objects. The reason that they have somewhat larger MBHs than others is not known. However, if excluding them, the correlation becomes even stronger with (), which can be fitted (using OLS bisector) by
| (3) |
as shown by the dotted-long dashed line in the right panel of Figures 1 and 2. The scatter is large for this relation, which should be due to large uncertainties in both variables. Whether we exclude Mrk 382, Mrk 734 and PG 1448+273 or not, the relation for AGN (both NL and BL AGN) is consistent with that defined in nearby hot galaxies. It seems also that the slope of the fit agrees with the one found by Gebhardt et al. (2000a) for nearby hot galaxies and Nelson (2000) for AGN (see Fig. 2), but is different to the one derived by Merritt & Ferrarese (2001a) of 4.72 (see Fig. 1); more conclusive result needs precise measurement of both the MBH mass and bulge velocity dispersion. Again, the difference from the relation (Gebhardt et al. 2000a) in Log10 or Log10 is about -0.5 or 0.1. The consistency of the MBH mass in NL Seyfert 1 galaxies and NL QSOs with the bulge velocity dispersion supports the result of Ferrarese et al. (2001) that the two NLS1s with measured MBH masses (by the reverberation mapping method) and bulge velocity dispersions (from stellar absorption lines) are consistent with relation defined by nearby hot galaxies.
3 Discussion and Conclusion
In this paper, we find that there is no clear difference in the relation between and (the bulge velocity dispersion is represented by the [OIII] width for AGN) for both NL and BL AGN from the same relation defined by nearby hot galaxies (Gebhardt et al. 2000a; Ferrarese & Merritt 2000). Furthermore, the MBH masses and bulge velocity dispersions of NLS1s are thought to be consistent with the relation for other galaxies if we consider the overestimation in the [OIII] line width. This consistency suggests that NLS1s have small MBHs compared with BL AGN with similar non-thermal luminosity simply due to their host galaxies having small bulges compared to that of BL AGN. This may support one of the competing model of NLS1s, i.e., the low-mass/high accretion rate interpretation.
A simple evolutionary scenario proposed by Mathur (2000) is that NLS1s are likely to represent a crucial early and more obscured phase in the evolution of active galaxies based on the observational properties of NLS1s, such as super-solar metallicities and are unusually luminous in the far-infrared band etc. This evolutionary view has also been frequently suggested by other authors (Law-Green et al. (2000)). Although it is tentative that the and of NLS1s is consistent with the relation (Gebhardt et al. 2000a, Ferrarese & Merritt 2000), we cannot rule out the possibility that the MBHs in NLS1s are smaller than those in BL AGN or nearby hot galaxies at a given bulge velocity dispersion by a factor of several (say, 3), which means that Mathur’s scenario cannot simply be ruled out by our results. However, the claim of Mathur et al. (2001) that NLS1s have a significantly smaller MBH to bulge velocity dispersion ratio, which may be caused by some non-virial component in their [OIII] line width measurements, is discredited by our results.
Now we have more confidence in applying the reverberation mapping method to measure the masses of MBHs in AGN, since the MBH masses from reverberation mapping are consistent with the relation recently discovered for local galaxies (Gebhardt et al. 2000b ; Ferrarese et al. (2001); Nelson (2000)). Krolik (2000) pointed out, however, this consistence could be due to fortuitous mutual canceling of the systematic errorsincluding overestimation of the MBH mass by a fixed ratio by interpreting the emission line kinematics as gravitationally bound and underestimating the mass for planar-like BLR cloud distribution. If the narrowness of the permitted line width of NLS1s is due to a planar-like BLR viewed nearly “pole-on” (the “orientation model”: Osterbrock & Pogge 1985; Goldrich 1989; Puchnarewicz et al. 1992), the estimated MBH masses would be systematically smaller than the real one. Since the orientation is a random effect, we would expect that the estimated MBH masses in BL AGN are systematically larger than those in NLS1 by a similar factor of 10, considering of NLS1s broad line width are around km s-1 while BL objects are typically about km s-1 (which means that the velocity of broad-line-emitting clouds would be underestimated by a factor of about 3 if both NLS1s and BL objects have a similar central engine and a flat broad line geometry), at a given stellar velocity dispersion. As we can see in Figure 1 and 2, masses of NL objects at a given bulge velocity dispersion are consistent with the trend of BL objects, which suggests that at least not all NLS1s can be regarded as “orientation” dependent.
It is generally believed that the activity in galactic nuclei is closely linked with the galaxy and bulge formation. Silk & Rees (1998) proposed that the powerful wind from the central engine can blow away the cold gas from the galaxy and terminate the accretion process when the output kinetic energy is comparable with the bound energy of the total gas in the galaxy. This results in a relation of the MBH mass to the stellar velocity dispersion of the form . The typical duration of the bright QSOs phase is required to be only about few yr from fitting the optical QSOs luminosity function by the mass function of dark matter halos predicted by standard hierarchical cosmogonies (Haehnelt et al. (1998)). It suggests that MBHs may grow at an accretion rate far above the Eddington rate before this brief optical bright phase and/or at a very low accretion rate via advection-dominated accretion flows lasting a Hubble time after this phase. Fabian (1999) further incorporated the Silk-Rees scenario in a model of obscured growth of MBHs. In his model, a MBH in the center of a galaxy accretes the surrounding material and emits a QSO/AGN-like spectrum which is absorbed by surrounding gas and dust. The wind from the central engine exerts a force on the gas and pushes it outwards. The central engine emerges when the Thomson depth in the relation for bright AGN or NL objects is similar to that of the galaxies. Our result of a consistent relation in NLS1s favors the model of Fabian (1999).
Many works have been done on the relation between and . There is still controversy about whether Seyfert galaxies have a small to ratio compared with local galaxies or not (Wandel 1999, McLure & Dunlop 2000). Czerny et al. (2000) claimed that NLS1s, at least, have a smaller to ratio, which could be due to nuclear star burst (or stellar formation and evolution) in NLS1s leading to a small mass to light ratio of bulges.
In the present paper, there are some caveats for both the estimation of the MBH mass and the bulge velocity. First, the empirical - relation is not fully tested for NLS1s. This relation is derived from a moderate-size sample of AGN, composed mainly of BL AGN (Kaspi et al. (2000)). Three of the four NLS1s in this sample closely follow the - relation. The lowest luminosity object, NGC 4051, shows a larger size of BLR than this empirical relation predicted. There is, at least, no obvious evidence against this empirical relation, although further confirmation is needed. Second, Nelson & Whittle (1996) identified two cases in which the [OIII] width can be significantly larger than the bulge velocity dispersion, i.e., presenting kpc linear radio sources or displaying distorting morphology. Though lacking in systematic study, NLS1s tend to possess similar radio properties to average radio-quiet Seyfert galaxies (Ulvestad et al. (1995)). Zheng et al. (1999) found that NLS1s in their sample are morphology relaxed. We also note that two NL objects included in the sample of Nelson & Whittle (1995) do not show systematic deviation. Also, the non-virial component of [OIII] lines has been subtracted for VVG objects. Therefore, our results should not be affected by the possible linear radio source in some objects.
Acknowledgements.
We thank an anonymous referee for helpful comments and suggestions. TW thanks the financial support from Chinese NSF through grant NSF-19925313 and from Ministry of Science and Technology. YL acknowledges the hospitality of the Department of Astrophysical Sciences, Princeton University.References
- Blandford (1999) Blandford, R. D., 1999, in “Origin and Evolution of Massive Black Holes in Galactic Nuclei”, ed. Merritt, Valluri & Sellwood, 1999, p87
- Czerny et al. (2000) Czerny, B., Nikolajuk, M., Piasecki, M., & Kuraszkiewicz, J., 2001, MNRAS, 325, 865
- Fabian (1999) Fabian, A. C., 1999, MNRAS, 308, L39
- Ferrarese & Merritt (2000) Ferrarese, L., & Merritt, D. 2000, ApJL, 539, L9
- Ferrarese et al. (2001) Ferrarese, L., Pogge, R. W., Peterson, B. M., Merritt, D., Wandel, A., & Joseph, C. L., 2001, ApJL, 555, L79
- (6) Gebhardt, K., et al. 2000a, ApJL, 539, L13
- (7) Gebhardt, K., et al. 2000b, ApJL, 543, L5
- Goldrich (1989) Goldrich, R. W., 1989, ApJ, 342, 224
- Haehnelt & Kauffmann (2000) Haehnelt,M. G., Kauffmann, G., 2000, MNRAS, 318, L35
- Haehnelt et al. (1998) Haehnelt, M. G., Natarajan, P. & Rees, M. J., 1998, MNRAS, 300, 817
- Ho (1999) Ho, L., 1999, in ”Observational Evidence for the Black Holes in the Universe”, ed. S. K. Chakrabarti (Dordrecht:Kluwer), p157
- Kaiser et al. (2000) Kaiser, M. E., Bradley, L. D. II, Hutchings, J. B., Crenshaw, D. M., Gull, T. R., Kraemer, S. B., Nelson, C. H., Ruiz, J., & Weistrop, D., 2000, ApJ, 528, 260
- Kaspi et al. (2000) Kaspi, S., Smith, P. S., Netzer, H., Maoz, D., Jannuzi, B. T., & Giveon, U., 2000, ApJ, 533, 631
- Isobe et al. (1990) Isobe, T., Feigelson, E. D., Akritas, M. G., & Babu, G. J., 1990, ApJ, 364, 104
- Kauffmann & Haehnelt (2000) Kauffmann, G., Haehnelt, M., 2000, MNRAS, 311, 576
- Kormendy (1993) Kromendy, J., 1993, in The Nearest Active Galaxies, eds. J. Beckman, L. Colina, & H. Netzer (Madrid: CSIC), 197
- Kormendy & Richstone (1995) Kormendy, J., & Richstone, D., 1995, ARA&A, 33, 581
- Krolik (2000) Krolik, J., 2001, ApJ, 551, 72
- Laor (1998) Laor, A., 1998, ApJL, 505, L83
- Law-Green et al. (2000) Law-Green, J. D. B., Hirst, P., O’Brien, P. T., Ward, M., & Boisson, C., 2000, MNRAS submitted
- Magorrian et al. (1998) Magorrian, J., et al. 1998, AJ, 115, 2285
- Mathur (2000) Mathur, S., 2000, MNRAS, 314, L17
- Mathur et al. (2001) Mathur, S., Kuraszkiewicz, J., & Czerny, B. 2001, New Astron., 6, 321
- McLure & Dunlop (2000) McLure, R. J., & Dunlop, J. S., 2000, MNRAS, in press (astro-ph/0009406)
- (25) Merritt D, & Ferrarese L., 2001a, ApJ, 547, 140
- (26) Merritt D, & Ferrarese L., 2001b, MNRAS, 320, L30
- Nelson (2000) Nelson, C. H., 2000, ApJ, 544, L91
- Nelson & Whittle (1995) Nelson, C. H., & Whittle, M., 1995, ApJS, 99, 67
- Nelson & Whittle (1996) Nelson, C. H., & Whittle, M., 1996, ApJ, 465, 96
- Osterbrock & Pogge (1985) Osterbrock, D. E., & Pogge, R. W., 1985, ApJ, 297, 166
- Ostriker (2000) Ostriker, J. P., 2000, PRL, 84, 5258
- Puchnarewicz et al. (1992) Puchnarewicz, E. M., et al. 1992, MNRAS, 256, 589
- Puchnarewicz et al. (2001) Puchnarewicz, E. M., Mason, K. O., Siemiginowska, A., Fruscione, A., Comastri, A., Fiore, F., & Cagnoni, I., 2001, ApJ, 550, 644
- Sarzi et al. (2000) Sarzi, M., et al. 2000, ApJ, 550, 65
- Silk & Rees (1998) Silk, J. & Rees, M. J., 1998, A&A, 331, L1
- Ulvestad et al. (1995) Ulvestad, J. S., Antonucci, R. R. J., Goodrich R., 1995, AJ, 109, 81
- Unger et al. (1987) Unger, S. W., Lawrence, A., Wilson, A. S., Elvis, M., Wright, A. E., 1987, MNRAS, 228, 521
- Veilleux (1991) Veilleux, S., 1991, ApJS, 75, 383
- Veron-Cetty et al. (2001) Veron-Cetty, M.-P., Veron, P., & Goncalves, A. C., 2001, A&A, 372, 730
- Wandel (1999) Wandel, A., 1999, ApJL, 519, L39
- Whittle (1985) Whittle, M., 1985, MNRAS, 216, 817
- Zheng et al. (1999) Zheng, Z., Wu, H., Mao, S., Xia, X. Y., Deng, Z. G., & Zou, Z. L., 1999, A&A, 349, 735