Backwards galaxy formation with only a few parameters
Abstract
We present a simple phenomenological model of star formation in galaxies that describes the process with a set of a few parameters. The star formation efficiency () and the fraction of gas and metals ejected in outflows () are assumed to be the main drivers of star formation. The Tully-Fisher and the Faber-Jackson relations in different passbands are used as constraints in the analysis of disk and elliptical galaxies, respectively. We find that a steep correlation between and maximum rotation velocity is needed in disk systems, whereas elliptical galaxies can be explained by a high star formation efficiency, uncorrelated with the central velocity dispersion. Gas outflows are not important in disks, whereas a correlation of outflows with galaxy mass must be invoked in early-type galaxies to account for the observed colors. A simple explanation for these correlations can be given with respect to the difference in the dynamical formation histories of disks and elliptical galaxies. A phenomenolgical model allows us to evolve the system “backwards” in time. A significant redshift evolution of the slope of the Tully-Fisher relation is predicted, with the rest frame -band slope () steepening from at up to at .
Nuclear & Astrophysics Lab. Keble Road, Oxford OX1 3RH, United Kingdom
1. Introduction
One of the main difficulties in the study of galaxy formation is to determine the detailed role played by star formation. The complexity of this process both locally — in the environment of the giant molecular clouds — and globally — via the importance of star formation in the structure and evolution of galaxies — are major hurdles towards a final theory of galaxy formation. The remarkably tight correlation between luminosity and maximum rotation velocity found by Tully & Fisher (1977) in disk galaxies has been the Holy Grail of galaxy formation modellers. Its origin has been claimed to be in cosmology, and attributed to the structure of dark matter halos (Mo, Mao & White 1998; Steinmetz & Navarro 1999). However, star formation may play an important role (Heavens & Jimenez 1999; Silk 2001) and the assumption of light tracing mass may not be correct (McGaugh et al. 2000). In such a situation, a phenomenological approach seems appropriate. The process of star formation may be reduced to a simple set of parameters, and high-quality observations are used as constraints. We concentrate on the scaling relations between luminosity and some “dynamical” parameter such as the maximum rotation velocity in disk galaxies (Tully & Fisher 1977) or the central velocity dispersion in elliptical galaxies (Faber & Jackson 1976). In this paper we compare the difference between the star formation histories in early- and late-type galaxies.
2. Star Formation Phenomenology
Our model of galaxy formation follows a “backwards” approach. We describe the process of star formation with a small number of parameters. For a given choice of parameters we integrate the chemical enrichment equations to find a final distribution of stellar ages and metallicities which are convolved using simple stellar populations from the latest models of Bruzual & Charlot (in preparation). The predicted spectrophotometric properties are compared to the observations, so that we come up with a range of parameters that can explain the observations. This phenomenological analysis is useful for the study of the physics of the underlying star formation. Furthermore, it allows us to evolve the system backwards in time, so that its predictions over a large redshift range can be used to further constrain the volume of parameter space compatible with the observations. The parameters used in this model can be separated into two categories: external and internal (see Ferreras & Silk 2000; 2001 for a complete description):
-
External. These parameters control the infall of primordial gas that fuels star formation. We define a short “start-up” timescale — Gyr — which allows for the buildup of metals, preventing the over-production of old, low-metallicity stars. The main external parameters are the infall timescale — — which can be related to galaxy type, with early-types having values Gyr and late-types having a more extended infall Gyr, and the epoch at infall maximum. We characterize this epoch by its redshift . Even though this epoch could be determined in a hierarchical clustering scenario, either using dynamical simulations or the analytic Press-Schechter formalism, we decided to leave this parameter unconstrained, to find out which formation epochs would be ruled out purely based on spectrophotometric considerations.
-
The internal parameters are responsible for the star formation rate and chemical enrichment. We define a star formation efficiency as the constant of proportionality between the star formation rate () and a power of the gas mass density () as given by a Schmidt law: . This efficiency is roughly the inverse of the time to process gas into stars (in Gyr in our units). Semi-analytic models usually assume this efficiency to be given by the inverse of the dynamical timescale in the galaxy. The other internal parameter is the amount of gas ejected in outflows (). It is still a matter of debate whether supernova-driven outflows are important in disk galaxies.
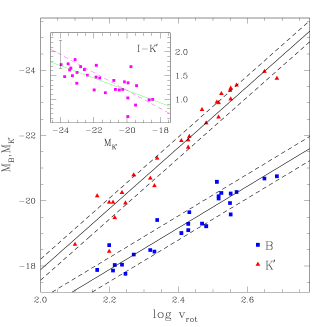
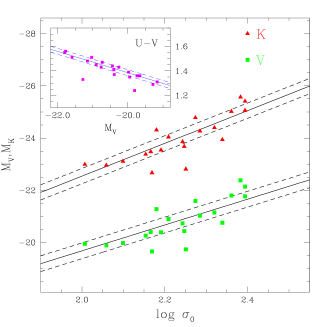
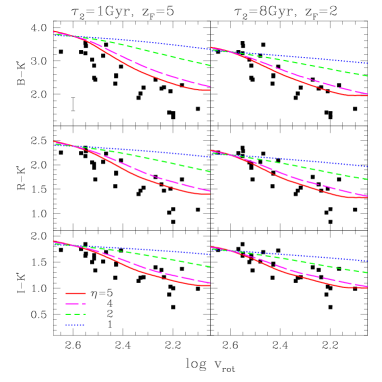
The observational constraints are shown in Figure 1. The multiband Tully-Fisher (Tully & Fisher 1977) and Faber-Jackson (Faber & Jackson 1976) relations are used to explore the star formation history of late-type and early-type galaxies, respectively. Figure 1 shows the data for some of the observed bandpasses. The disk galaxy sample corresponds to a set of disks in the Ursa Major cluster observed by Verheijen (1997) in , , and bands. The early-type galaxies used in this work are the sample of Coma ellipticals observed by Bower, Lucey & Ellis (1992) in , , and bands.
The slope difference between filters can be represented in terms of a color-magnitude relation both in ellipticals and disk galaxies (see insets in Figure 1). However, the scatter found in disk galaxies is much larger, notwithstanding the added complication of the contribution from dust in disks. The universality of the color-magnitude relation in disks is a reasonable assumption if we compare the fit for a completely different sample of disk galaxies observed by de Grijs & Peletier (1999) and shown in the inset of Figure 1 (left) as a dashed line. These authors also found similar slopes in several sets of disk galaxies from the literature. The small scatter found in ellipticals even in high redshift clusters (Van Dokkum et al. 2000) is an indication of the dominant role of metallicity to explain the color range in these galaxies. The bulk of the stellar populations in early-type systems must be rather old in order to explain this small scatter if a fine-tuned conspiracy in the star formation history is to be avoided. On the other hand, the large scatter found in the color-magnitude relation of disk galaxies is a tell-tale sign of a more extended period of star formation.
The modus operandi of the model presented here is to select one star formation history by a choice of parameters . This history is integrated using the standard enrichment equations (Ferreras & Silk 2001) and the final chemical enrichment tracks are used to convolve simple stellar populations over a wide range of ages and metallicities from the latest population synthesis models of Bruzual & Charlot (in preparation), out of which we come up with a spectral energy distribution which gives us a set of broadband fluxes which are compared with the data described above. This procedure is repeated for different choices of parameters. Even though this model is a coarse oversimplification of the star formation process in galaxies, its strength is the robustness allowed by exploring a wide volume of parameter space. In our model we do not assume a priori any functional dependence of the star formation efficiency, the outflow fractions or even the epoch of maximum infall. The outcome of this model should therefore be useful for implementing the “recipes” for galaxy formation included in semi-analytic models.
3. The efficiency of Star Formation
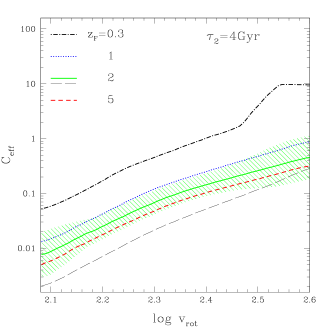
Figure 2 shows the range of star formation efficiencies predicted by the model. A test was applied to compare the predicted colors for a given choice of parameters and the linear fits to the observed data shown in Figure 1. A typical infall timescale in early and late-type systems was chosen for these figures, but a different value of does not change the result significantly (Ferreras & Silk 2001). A remarkable difference is found between the efficiency in disks and elliptical galaxies. The former have efficiencies that range over nearly two orders of magnitude, being strongly correlated with the maximum rotation velocity of the disk (or roughly the luminosity or even the disk mass). On the other hand, elliptical galaxies have very high star formation efficiencies which are not correlated with galaxy mass.
This result should not come as a surprise if we realize the colors of ellipticals are very red and the scatter of the color-magnitude relation is remarkably small. There is an interesting point that can be predicted from the figure: The high star formation efficiency required to explain the data is telling us that pure passive evolution should be expected for early-type cluster galaxies with redshift. This has been observed already in several samples of clusters at moderate and high redshift (e.g. Stanford et al. 1998) but the constraint for the efficiencies shown in Figure 2 only involves zero redshift data from the Coma cluster.
The large range of efficiencies found in late-type galaxies implies low mass disks should have a very high mass fraction of gas. The slope of the correlation between maximum rotation velocity and star formation efficiency () is depending on infall parameters and whether a linear or a quadratic Schmidt law is used. In order to check how inefficient star formation can be (and so how high the gas mass fraction can be), we show in Figure 3 the colors predicted by our model, enforcing a power-law dependence between and for a few choices of power law index. The result shows that the correlation must be steep in order to reproduce the colors. Correlations with are incapable of reaching blue colors for any choice of infall parameters.
The steepness of the correlation was further analyzed in Ferreras & Silk (2001) with respect to the predictions of the star formation rates at zero redshift and compared with a local sample. The model gives consistent answers. This leads us to conclude that a large amount of molecular hydrogen is needed in order to explain the high gas mass fractions predicted for low mass disks. This is a highly speculative prediction of our relatively simple model. However, the “canonical” method of estimating molecular hydrogen using carbon monoxide as tracer (e.g. Young & Knezek 1989) may underestimate the contribution from in low metallicity regions. Furthermore, direct detections of large amounts of through its rotational transitions (Valentijn & Van der Werf 1999) as well as recent theoretical estimates of the lifetimes of the giant molecular clouds that nurture star formation (Pringle et al. 2001) point to the possible existence of large masses of hitherto undetected, cold . More work in this field is badly needed and the prospect of a partial solution to the baryonic dark matter problem via an augmentation in the cold gas mass seems very encouraging. We note paranthetically that the warm/hot intergalactic medium predicted from large-scale hydrodynamical simulations accounts for at most half of the baryonic dark matter.
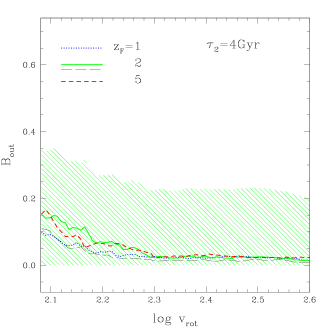
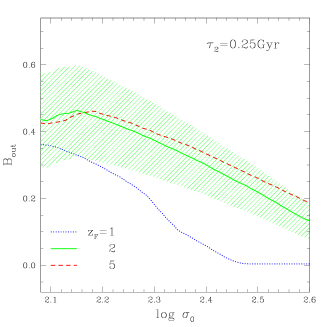
4. Gas Outflows
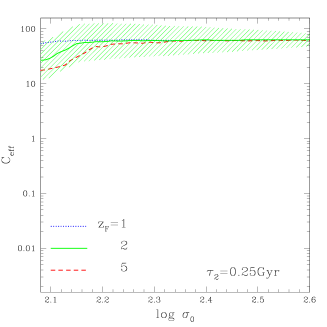
The ejection of gas and metals in outflows changes the metallicity distribution of the stellar populations. If the outflow fraction is very large, it could even deplete the gas reservoir, “stifling” star formation. However, the average metallicities that would be found in such a system would be very low so that the predicted photometry would not be compatible with the observations. Nevertheless, our model explores a wide range of outflows , using only the observed colors to reject unphysical values. Figure 4 shows the predicted outflow mass fractions both for disks (left) and elliptical galaxies (right). One can see from the figure that gas outflows may not be important in disk galaxies. The observations are compatible with no gas outflow throughout the mass range. This result is in good agreement with hydrodynamical simulations in disk galaxies (MacLow & Ferrara 1999). The 2-dimensional geometry of disks prevent a large fraction of gas from being ejected out of the galaxy. Most of the gas “stirred” by supernovae-driven winds stays in the interstellar medium. Only in small galaxies (well below the range of maximum rotation velocities analyzed in this paper) feedback from supernovae seems to play an important role.
On the other hand, elliptical galaxies present an important range of outflows, being very significant at the faint end of the luminosity function. This is necessary in order to obtain the observed color range in cluster ellipticals. Figure 2 shows that early-type systems have a high star formation efficiency. This translates into rather old stellar populations. In this case, the only way to explain a color-magnitude relation is to assume a mass-metallicity relation. This is confirmed by the lack of evolution in the slope of the color-magnitude relation in clusters up to redshifts (Stanford et al. 1998). Hence, a mass-metallicity relation can only be obtained by a correlation between mass and gasmetal outflows as seen in the figure. We want to emphasize that the conclusions reached here with respect to star formation efficiencies and gas outflows are purely based on spectrophotometry and not on the dynamics of these galaxies. The fact that these results are compatible with the current ideas about the dynamical history of early- and late-type systems should count as independent further evidence towards the galaxy formation scenario.
5. The Dynamics/Star Formation connection
Star formation is assumed to take place mostly (or even completely) in giant molecular clouds. However, it is not clear which mechanisms are responsible for the onset of this process. Turbulence and magnetic fields play an important role in the process of star formation. Nevertheless, a simple scenario for star formation involving cloud-cloud collisions seems to give reasonable results (e.g. Tan 2000; Silk 2001). This implies the quiescent dynamics of disk galaxies should result in very low star formation efficiencies. Furthermore, massive disk galaxies should have more cloud-cloud encounters compared to low mass disks, thereby raising the average star formation efficiency. On the other hand, the dynamically violent birth of elliptical galaxies after the merging of progenitors with similar masses (Toomre & Toomre 1972) implies a higher rate of cloud-cloud collisions, yielding high star formation efficiencies that are uncorrelated with the progenitor masses. Hence, the dependence of the star formation efficiency with respect to some “mass-related parameter” such as the rotational velocity in disk galaxies or central velocity dispersion in elliptical systems can be explained — at least qualitatively — with respect to the dynamical history of the galaxies.
The dependence on galaxy mass of the outflow fraction () presented in Figure 4 can also be explained in terms of the dynamical formation process of both galaxy types: disks are presumed to form by an “ordered” infall of gas on to the center of dark mater halos (e.g. White & Rees 1978). This implies outflows can only be triggered by supernova-driven winds, a process that seems not to be too effective in the 2D geometry of disk galaxies, even with masses at the faint end of the observed Tully-Fisher relation ( km s-1). Notice that this analysis has not been extended to dwarf galaxies. In fact, dwarf galaxies drop off the luminosity Tully-Fisher relation and are claimed by McGaugh et al. (2000) to “jump back” to a linear correlation if baryonic mass — rather than luminosity — is plotted against rotation velocity. Our analysis is purely based on luminosity and so we would have to add the non-linearity of the low-mass end of the Tully-Fisher relation to draw any conclusions regarding dwarf galaxies. On the other side of the morphological spectrum, early-type systems are thought to have been formed in merging processes whose progenitors had similar masses. This mechanism involves a violent encounter with low relative velocities, and it is very efficient in driving gas, metals and even stars out of the galaxy. Hence, the results shown in Figure 4 are qualitatively consistent with the dynamical history of early- and late-type galaxies.
A quantitative estimate is harder to get. Wyse & Silk (1989) proposed a star formation efficiency that scales with the local angular frequency: . Tan (2000) uses a simple model of cloud-cloud collisions to find a similar scaling behavior for the efficiency. In our notation, their claim implies a global (i.e. spatially integrated) efficiency of . The correlation shown in Figure 2 is significantly steeper than this, and only a steep dependence of disk sizes would reconcile both estimates (however, see §6).
Concerning gas outflows, high resolution HydroN-body numerical simulations of mergers for a wide range of encounters should be performed in order to estimate the scaling of the outflow fraction as a function of galaxy mass.
6. Caveat: Formation Epoch
One of the caveats of the model can be seen in Figure 2. The star formation efficiency is shown as a dot-dashed line for an extremely low formation redshift (). In that case, a similar correlation is predicted for vs but the values are one order of magnitude higher !. This implies that a disk formation scenario in which small disks form much later than large disks could result in a star formation efficiency that is completely uncorrelated with the galaxy mass. This result has been suggested by several authors (Bell & Bower 2000; Boissier et al. 2001). According to a standard hierarchical formation scenario, small disks should be dynamically older than their massive counterparts. However, one can think of several processes by which either infall or star formation can be delayed in small disks. Even though we do not believe values of are realistic for our low mass disks ( km s-1), we must emphasize that an inverted hierarchy in the formation of stars in disks may make the predicted correlation between disk mass and efficiency shallower.
7. Redshift evolution
The model presented here allows us not only to connect phenomenology with physical processes driving star formation. It also enables us to evolve the “best fit” for a given mass backwards in time, so that we can trace the redshift evolution of color and luminosity (of course aside from the problem of dust formation and depletion). One of the main consequences of the star formation efficiencies found in Figure 2 is that:
-
a)
(Unsurprising) The high and uncorrelated star formation efficiency found in early-type galaxies implies their stellar populations are old and so the luminosity evolution corresponds to a passively evolving simple stellar population. The color-magnitude relation should not change its slope with redshift. Only the zero-point offset should evolve in step with the luminosity evolution of a simple stellar population (e.g. Bower et al. 1992; Stanford et al. 1998).
-
b)
(Somehow surprising) The strongly correlated efficiency found in disk galaxies implies a huge difference between the stellar age histogram of low mass disks and their massive counterparts. This translates into a slope change of the Tully-Fisher relation with redshift.
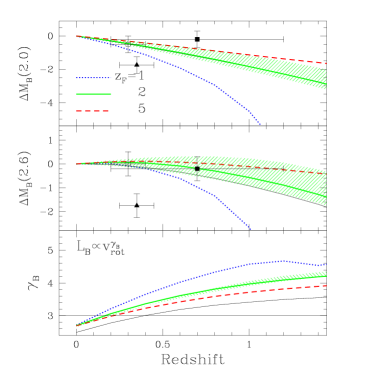
Figure 5 shows the redshift evolution of the Tully-Fisher relation observed in rest frame band. The bottom panel plots the evolution of the slope (so that ). Needless to say, a change in the slope will result in a different zero-point offset between and depending on the absolute luminosity of the galaxies observed. The top and middle panels show this offset for low () and high mass () disks, respectively. The points are observed offsets of the Tully-Fisher relation at moderate redshifts: Bershady et al. (1999, hollow square); Vogt (2000, filled square) and Simard & Pritchet (1998, triangle). The horizontal error bar encompasses the redshift range of the observations. The horizontal line — at — in the bottom panel gives the prediction of a simple dynamical model that assumes the same mass-to-light ratio for all disks (Mo et al. 1998).
8. Final Remarks
A phenomenological model using only observed data as a constraint enables us to determine the role of the star formation efficiency and gas outflows. The passband-dependent slope of both the Tully-Fisher and the Faber-Jackson relations for disk and elliptical galaxies, respectively yields a remarkably different picture of star formation. Taking the model at face value, one could venture into the risky business of extrapolation and consider that the model described so far has only taken into account star formation. Were we to determine the scaling between and from a so far undeveloped theory of star formation, we could have inferred that self-regulated star formation could explain the Tully-Fisher relation (e.g. Silk 2001).
Acknowledgments.
IF is supported by a grant from the European Community under contract HPMF-CT-1999-00109. We would very much like to thank the organizers for such an enjoyable workshop.
References
Bell, E. F. & Bower, R. G. 2000, MNRAS, 319, 235
Bershady, M. A., et al. 1999, ASP Conf. Ser. 182, 499
Boissier, S., Bosselli, A,. Prantzos, N., Gavazzi, G. 2001, MNRAS, 321, 733
Bower, R. G., Lucey, J. R. & Ellis, R. S. 1992, MNRAS, 254, 589
de Grijs, R. & Peletier, R. F. 1999, MNRAS, 310, 157
Faber, S. M. & Jackson, R. 1976, ApJ, 204, 668
Ferreras, I. & Silk, J. 2000, MNRAS, 2000, 316, 786
Ferreras, I. & Silk, J. 2001, ApJ, in press astro-ph/0104240.
Heavens, A. F. & Jimenez, R. 1999, MNRAS, 305, 770
MacLow, M.-M. & Ferrara, A. 1999, ApJ, 513, 142
McGaugh, S. S., Schombert, J. M., Bothun, G. D. & de Blok, W. J. G. 2000, ApJ, 533, L99
Mo, H. J., Mao, S. & White, S. D. M. 1998, MNRAS, 295, 319
Pringle, J. E, Allen, R. J. & Lubow, S. H. 2001, astro-ph/0106420
Silk, J. 2001, MNRAS, 324, 313
Stanford, S. A., Eisenhardt, P. R. & Dickinson, M. 1998, ApJ, 492, 461
Steinmetz, M. & Navarro, J. F. 1999, ApJ, 513, 555
Tan, J. C. 2000, ApJ, 536, 173
Toomre, A. & Toomre, J. 1972, ApJ, 178, 623
Tully, R. B. & Fisher, J. R. 1977, A&A, 54, 661
Valentijn, E. A. & Van der Werf, P. 1999, ApJ, 522, L29
Van Dokkum, P. G., Franx, M., Fabricant, D., Illingworth, G. & Kelson, D. D. 2000, ApJ, 541, 95
Verheijen, M. A.W. 1997, PhD thesis, Univ. Groeningen
White S. D. M. & Rees, M. J. 1978, MNRAS, 183, 341
Wyse, R. F. G. & Silk, J. 1989, ApJ, 339, 700
Young, J. S. & Knezek, P. M. 1989, ApJ, 347, L55