High-Resolution X-ray and Radio Observations of SGR 190014 in the Immediate Aftermath of a Giant Flare
Abstract
We present the results of Chandra, RXTE, and VLA observations of SGR 1900+14 in the immediate aftermath of its 2001 April 18 giant flare event. In the X-ray band we find the source in a pulsating and bursting state, with time-averaged 2–10 keV flux initially elevated by 20% above the source’s previous quiescent periods. In the radio we establish upper limits on the strength of any persistent post-flare emission of 0.7 and 0.1 mJy at 1.4 GHz and 8.0 GHz, respectively. The position of the X-ray source is consistent, to approximately 1 arcsec precision, with the August 1998 VLA determination, and the one-dimensional X-ray profile is consistent with that of a point source. The X-ray spectrum is best-fit by a two component power-law plus blackbody model, with fitted blackbody temperature keV and radius km for an assumed distance of 5 kpc. The spectral parameters of this thermal component are consistent with those reported for the source in quiescence, and the variations in the source flux we observe may be explained as variations in the power-law component alone, providing support for magnetar models of SGR 1900+14.
1 Introduction
The Soft Gamma-Ray Repeaters (SGRs; see Hurley 2000 for a recent observational review) are a unique class of Galactic neutron stars that exhibit bright flaring activity in the hard X-ray and soft gamma-ray bands. Perhaps their most unusual and distinctive feature is their hyper-Eddington bursts, the so-called “giant flares,” of which the 5 March 1979 event (Mazets et al., 1979b) is the most famous example. Based on the few observed events, the SGRs appear to emit their giant flares on a recurrence timescale of years to decades. They also exhibit softer quiescent X-ray emission with coherent pulsations at periods of 5–10 s.
The SGRs are generally thought to be young ( yr) neutron stars (NSs) with extremely strong magnetic fields ( G), i.e. magnetars (Duncan & Thompson, 1992; Thompson & Duncan, 1993). This belief has been motivated by their several associations with young supernova remnants (SNRs) or star-forming regions (Evans et al., 1980; Kulkarni & Frail, 1993; Fuchs et al., 1999; Vrba et al., 2000), by the energetics and phenomenology of their giant flares (Paczyński, 1992; Thompson & Duncan, 1995), and by the detection of X-ray pulsations with relatively long (5–10 s) periods and large () spin-down rates (e.g. Kouveliotou et al., 1998, 1999).
1.1 SGR 1900+14
Historically, multiple bursts from SGR 1900+14 gave the first hint of the existence of a new class of gamma-ray transients (Mazets et al., 1979a), suggesting that SGR 052666, source of the famous 5 March 1979 event, was not alone. Reactivation of SGR 1900+14 in 1992 (Kouveliotou et al., 1993) led to follow-up observations that associated the burst source with a soft, persistent X-ray source (Vasisht et al., 1994; Hurley et al., 1996) and, possibly, an SNR 12 arcmin distant (G42.80.6; Vasisht et al., 1994). On 27 August 1998, a giant flare with strong 5 s pulsations was detected by several spacecraft (Hurley et al., 1999a); this flare remains the strongest gamma-ray event (in peak flux and fluence) detected to date from any cosmic source apart from the Sun. Arrival-time localization (Hurley et al., 1999b) identified SGR 1900+14 as the source, and prompt radio observations detected a fading, non-thermal radio source (Frail et al., 1999) coincident with the quiescent X-ray source, a 5.17-s pulsar (Hurley et al., 1999c). Timing analyses of the quiescent X-ray emission soon revealed that the pulsar was spinning down in magnetar-like fashion (Kouveliotou et al., 1999). Observations of the source in the aftermath of the flare demonstrated, in addition, a short-term (hours) increase in spin-down rate (Palmer, 2001) and associated deviations from simple spin-down (Woods et al., 1999b). The radio detection provided the highest-accuracy position for SGR 1900+14 (current as of August 1998): , , with uncertainty in each coordinate (Frail et al., 1999).
The precise localization of SGR 1900+14 has since enabled further observations at all wavelengths. Lorimer & Xilouris (2000) and Kulkarni et al. (2001b) have raised questions about the association of SGR 1900+14 with G42.80.6; Vrba et al. (2000) have proposed instead an association of SGR 1900+14 with an embedded cluster of high-mass stars, 12 arcsec from the source, that is probably located at a distance of 12–15 kpc. Additional follow-up observations in the infrared (Eikenberry & Dror, 2000), optical, and radio (Kaplan et al., 2001b) have been undertaken; although these have not revealed any point-source candidate counterparts to date, the upper limits on persistent emission in the IR band can now constrain accretion disk models for the source (c.f. van Paradijs et al., 1995; Marsden et al., 2001), as discussed by Kaplan et al. (2001a).
On 2001 April 18.33, the Beppo-SAX and Ulysses satellites detected a second giant flare from SGR 1900+14 (Guidorzi et al., 2001; Hurley et al., 2001) with duration s, 25-100 keV fluence , and peak flux over 0.5 s of ( less fluence and lower peak flux than the flare of August 1998). In response we initiated observations of SGR 1900+14 with the Chandra X-ray Observatory, Rossi X-ray Timing Explorer, and Very Large Array, seeking to investigate the numerous transient phenomena that have been associated with the giant flares. Kouveliotou et al. (2001) have pursued a similar agenda with their overlapping set of observations.
2 Observations & Analysis
Our program sought to probe the immediate aftermath of the flare with sensitive X-ray spectral, X-ray timing, and radio imaging observations. These observations also allow us to investigate the nature of SGR 1900+14.
2.1 Radio
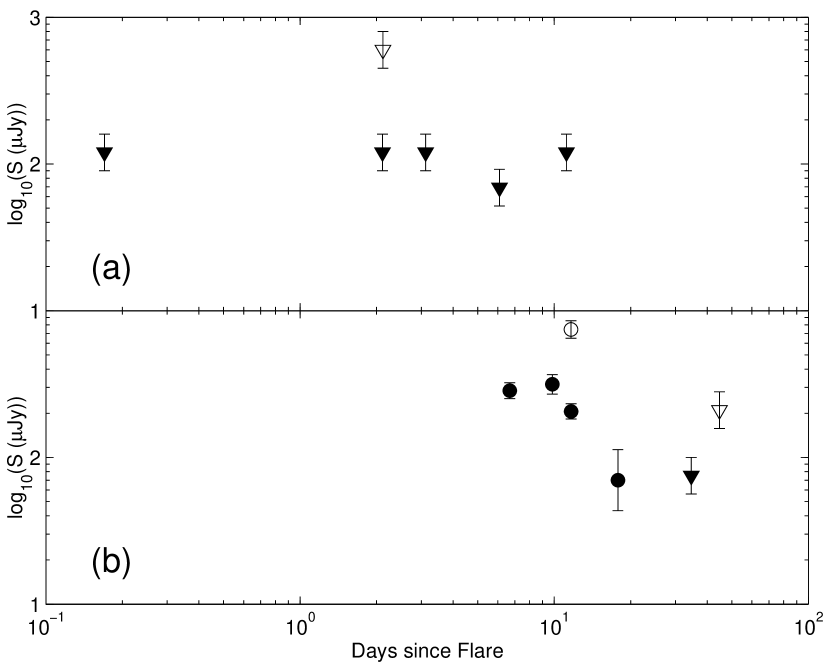
We observed the position of the radio transient associated with the August 1998 giant flare (Frail et al., 1999) from SGR 1900+14 with the Very Large Array111The VLA is operated by the National Radio Astronomy Observatory, which is a facility of the National Science Foundation operated under cooperative agreement by Associated Universities, Inc. (VLA) in its “B” configuration on a number of occasions, as part of our regular observing program and using observing time donated by others. A log of these observations is found in Table 4. The data were taken in continuum mode with 250 MHz bandwidth. They were reduced and calibrated using standard procedures in AIPS, and then imaged with the IMAGR task. This yielded beam sizes of and at 1.4 GHz and 8.4 GHz, respectively. We did not detect a source in any of the observations, giving the 3 upper limits plotted in Figure 1.
2.2 X-ray
We observed SGR 1900+14 with the Chandra X-ray Observatory on two occasions after the flare, beginning on 2001 April 22.19 UT and 2001 April 30.97 UT, with durations of 20.8 ks and 18.9 ks respectively, as part of the Director’s Discretionary Time allocation, with no proprietary data rights period. Both observations were taken in continuous-clocking mode with the aimpoint on the backside-illuminated ACIS S-3 detector. This gave us a time resolution of 2.85 ms and mitigated the effects of photon pileup for the persistent emission, as well as for bursts of modest size, while sacrificing one dimension of spatial information.
The two Chandra observations were coordinated with two observations of the Rossi X-ray Timing Explorer (RXTE) whose data were also made immediately public. Due to a change in Chandra planning that was not mirrored by RXTE, the first Chandra observation occurred one day after the first RXTE observation. The second RXTE and Chandra observations overlapped as planned. The RXTE observations began at 2001 Apr 21.32 UT and 2001 Apr 30.99 UT, lasted for 15.2 and 15.6 ks respectively, and had total good-time intervals, after screening of Earth occults and intervals of high electron background, of 9.6 and 8.9 ks respectively.
Chandra data were processed, for the most part, according to standard CXC procedures. First we examined the lightcurve of a background region for high-background intervals; none were identified. We then extracted events recorded by the ACIS S-3 detector and restricted to the energy range 0.3–10 keV. We barycentered this data using the axbary tool with a preliminary CXO ephemeris. We extracted the events from a region 10 pixels () wide. This region gives source count rates of and for the two observations. For precision timing analyses we were forced to account separately for the charge-transfer time, that is, the approximately 4 s it takes for the charge packets produced by each X-ray photon from the source to be read out from the center of the ACIS-S3 chip. We made this correction in two different ways: first, by following an approximate prescription related to us by the Chandra X-ray Center Helpdesk staff; and second, by executing a shell script provided to us by Allyn Tennant of the Marshall Space Flight Center222Script available at http://wwwastro.msfc.nasa.gov/xray/ACIS/cctime/. Results of the two approaches were identical; however, we note that the latter approach is superior in that it incorporates higher-order corrections for the dither-motion and flexure of the observatory over the course of the observation; these corrections will make a difference for analyses requiring significantly more precision than ours.
RXTE realtime data were processed according to the protocols described on the RXTE web site333http://heasarc.gsfc.nasa.gov/docs/xte/recipes/cook_book.html; note that the RXTE pointing was offset from SGR 1900+14 by 20 arcmin to reduce contamination from the bright source GRS 1915+105, resulting in a factor of 1.5 decrease in count rates relative to direct-pointing observations due to reduced collimator efficiency. The spectrum was (particle) background-dominated at high energies, so timing analyses were performed on 2–60 keV data only.
2.2.1 Phase-Averaged Spectral Analysis
Our spectral analysis focused first on the Chandra data. We extracted the events in a large background region and used the CXC tool psextract to bin the source and background event data and generate the appropriate response files. We then fit the data using the XSPEC and Sherpa packages independently. As a caveat to the results reported below, we note that the continuous-clocking mode of ACIS has not yet been independently calibrated for spectral purposes; our analysis depends on the calibration of the timed-exposure “Faint” mode of ACIS S-3, which telemeters an equivalent quantity of information about each event ( pixel islands). To the extent that photon interaction times in the CCD substrate are negligible compared to the CC single-row clocking time of 2.85 ms, we expect this calibration to be accurate.
Pure blackbody fits (with interstellar absorption) were unable to fit the spectra, indicating that a harder spectral component was required. Single-temperature thermal bremsstrahlung models were able to fit the data but only with plasma temperatures so high that the resulting spectra in the ACIS 0.2–10 keV range were little different from simple power laws; thus a power-law component became our starting point for the fits.
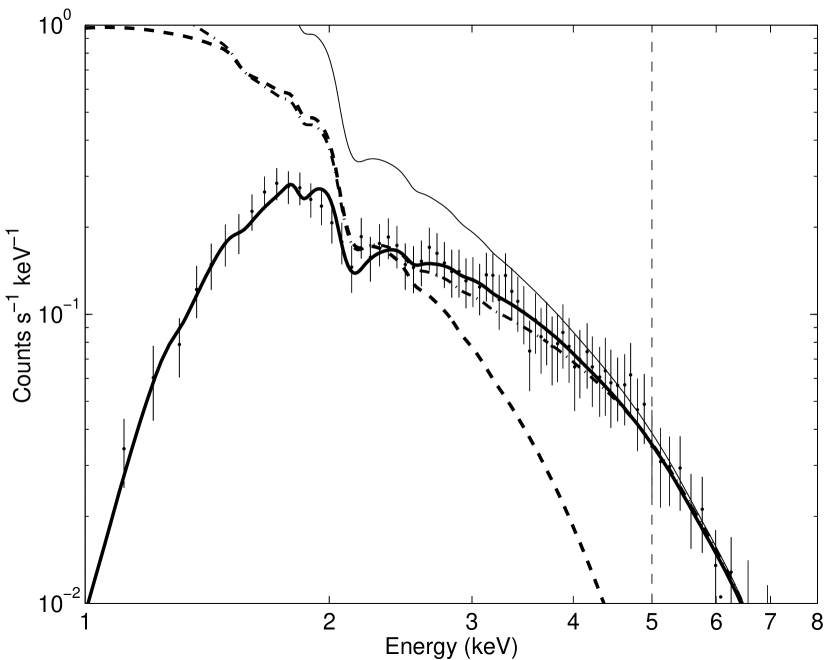
Single power-law (PL-only) models (with hydrogen absorption) were able to fit the data satisfactorily (Table 1). However, the resulting power-law indices are quite steep (2.5), requiring high column densities and implying relatively low high-energy fluxes, especially when extrapolated to the RXTE band. Adding a blackbody component to the models remedied these possible defects, but could not be justified in a strict statistical sense (-test probability of 62% for the additional parameters in the joint fit). To determine, then, whether the PL-only fits were a realistic description of the spectra, we examined the high-energy range of the data in greater detail. As shown in Fig. 2, above 5 keV the effects of interstellar absorption, or of any 0.5 keV blackbody, on the spectrum are negligible.
We therefore executed our power-law plus blackbody (PL+BB) fits in the following manner. First, we fit a PL to the data in the 5–10 keV range. At these energies a BB component is superfluous, and fits are insensitive to the precise amount of interstellar absorption. As indicated in Table 1, the PL indices for these 5–10 keV fits are significantly harder than those for the 1–10 keV PL-only fits: the difference for the first observation is and for the second , giving an overall significance for the distinction of 3.8. We then froze the PL parameters at their best fit 5–10 keV values, added a soft ( keV) BB plus interstellar absorption, and fit the full 1–10 keV dataset, allowing the BB parameters as well as to vary – note, however, that was forced to be the same for both epochs. This fit, with fixed PL normalizations and power-law indices, required a soft (BB) component at very high confidence. After making this constrained fit, we freed all parameters and fit a final time. The results of this final fit are given in Table 1, along with the results of the 1–10 keV and the 5–10 keV PL-only fits.
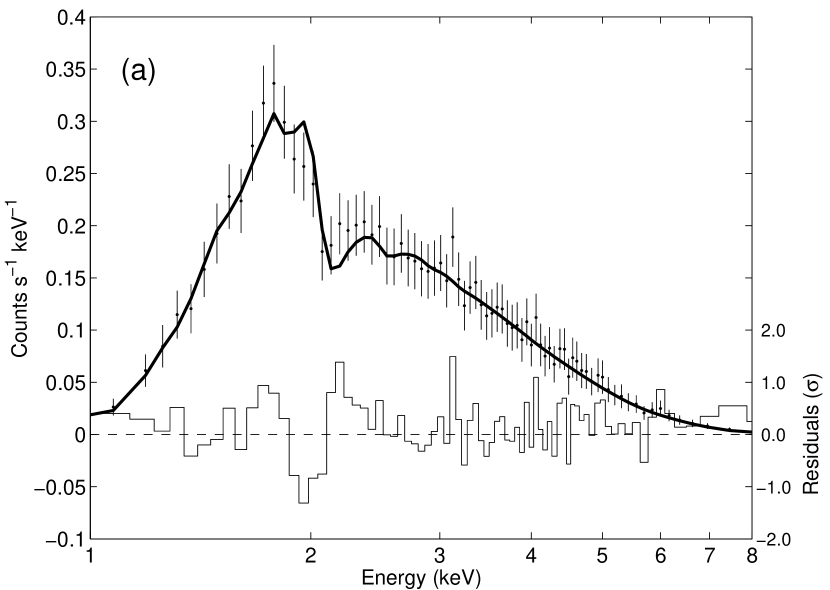
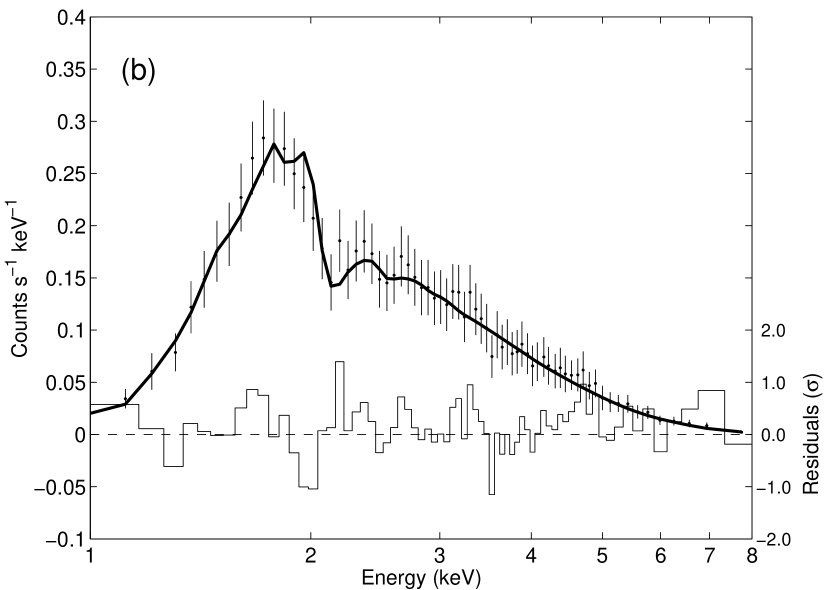
Our best-fit PL+BB models are plotted in Figure 3 (PL-only fits appear indistinguishable). We note that while Chandra does not have sufficient sensitivity at high energies ( keV) to discriminate directly between the PL+BB and PL-only models, other satellites, including RXTE and Beppo-SAX, do; see Section 2.2.2 for our approach on this point. Therefore we also quote in Table 1 the 2–10 keV fluxes from the models, as appropriate for comparison with other satellites. While the 0.5–10 keV fluxes are very similar for the PL or PL+BB models, there are significant differences in the absorbed 2–10 keV fluxes of the two models.
No narrow spectral features are apparent. The absorption “feature” near 2 keV is likely to be an instrumental artifact (Si)444See http://asc.harvard.edu/cal/Links/Acis/acis/Cal_prods/matrix/notes/Fl-esc.html. The 2- upper limit on the flux of a persistent 0.2-keV FWHM emission line in the 5–7 keV range (c.f. Strohmayer & Ibrahim 2000) is , corresponding to an equivalent width at 6.5 keV of less than 150 eV; narrower lines with similar equivalent widths would have been readily apparent in the data.
We attempted to extract time-averaged spectral information from the RXTE data as well. However, with the faintness of the source (which we estimate from our Chandra fits at 2 c s-1 for three active PCUs of the RXTE PCA), the high background (100 c s-1) – some of which is likely due to unresolved sources near the Galactic plane – and the non-imaging nature of the PCA, we have been unable so far to obtain meaningful results.
2.2.2 Phase-resolved spectral analysis
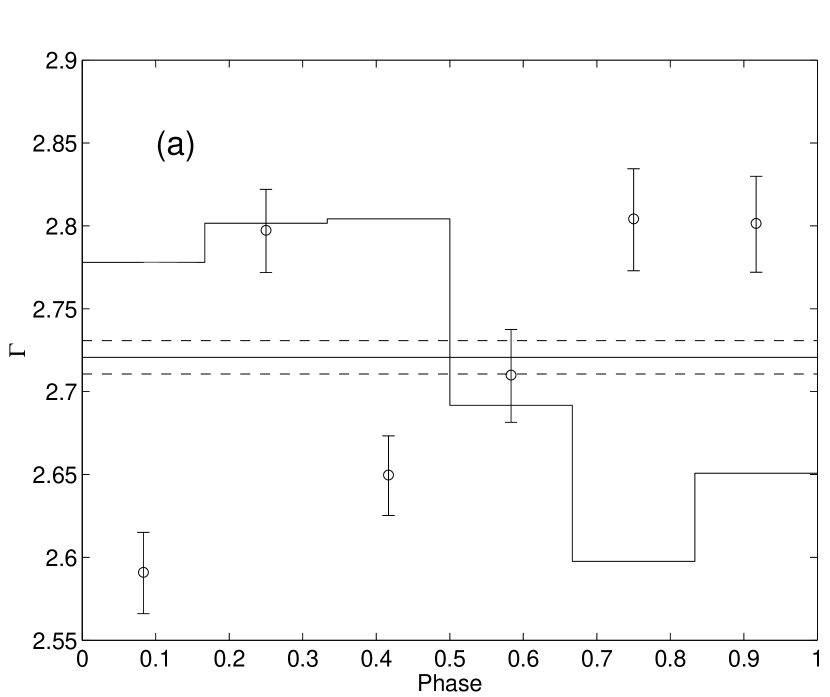
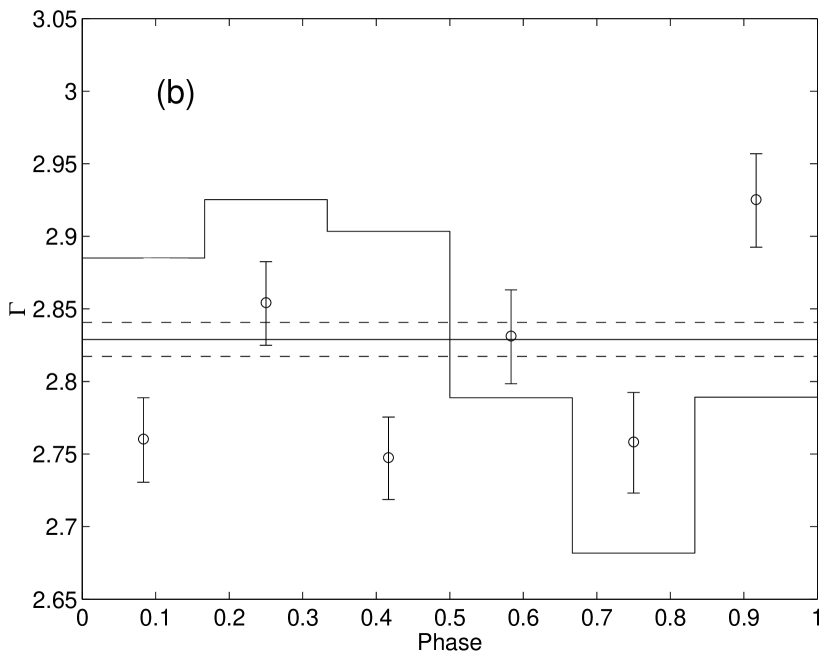
To perform a phase-resolved spectral analysis we divided the Chandra events into six phase bins, according to the best fit period for each observation. We constructed a spectrum for each spectral bin independently. With the reduced counts of the phase-binned spectra we were unable to discriminate between multicomponent spectral models and fit a PL only, fixing to the best-fit value for the PL-only fits to the phase-averaged data set (; see Table 1). Whether or not this model is accurate, the fits illustrate the gross variations in spectral shape (hardness) with phase exhibited by the source. We see in Figure 4 that there are moderate variations across the phase, with the beginning of the cycle harder than the end, and with an additional softening at pulse-maximum. The shape remains similar over the two observations.
As mentioned previously, we were not able to make a direct comparison with the RXTE spectral results due to unresolved background emission in the RXTE data that corrupted the absolute flux levels. However, we were able to compare the fluxes for pulse ONOFF. Specifically, we extracted spectral datasets for the of the phase around the maximum (ON) and the minimum (OFF) of the pulse for both Chandra and RXTE for the second epoch of (overlapping) observations. Our goal was to use the two datasets in combination to make an independent test of the reasonability of the PL+BB fits.
For the RXTE data we fit the PCABACKEST-subtracted data in the 7–20 keV range for the ON and OFF datasets with a power-law plus 7 keV Gaussian. We are only interested in the flux difference between these fits so the exact parameterization here is not crucial; however, we do fix in the fits to cm-2, a reasonable value from the Chandra fits. We determined our uncertainties in the flux difference by exploring the parameter space near the minimum for the ON and OFF datasets, determining one-sigma flux errors for each, and combining these ON and OFF errors in quadrature. The RXTE fits, combined with this investigation of the errors, demonstrate an ONOFF flux difference of erg cm-2 s-1 (7–20 keV).
When we fit the Chandra ON and OFF pulse data using a PL-only model, the best-fit power-law photon indices for the two datasets are quite similar, , and the best-fit flux difference in the extrapolated 7–20 keV band is erg cm-2 s-1. Investigating the parameter space defined by the ON and OFF power-law indices of the fit, which will have the largest effect on the extrapolated RXTE flux, we find that the maximum ONOFF flux allowed by the PL-only models is erg cm-2 s-1 (3- upper limit). This value is 2 from the actual RXTE flux. By contrast, the PL+BB fits give an ONOFF flux difference of erg cm-2 s-1, which is only 0.8 different from the RXTE value.
We feel that the combined weight of the 5–10 keV Chandra fits and the 7–20 keV RXTE-Chandra ONOFF fits demonstrates that the BB component of the spectral models is indeed required by the data. We note that Kouveliotou et al. (2001) reached the same conclusion by making fits to the summed spectrum of the two Chandra observations.
2.2.3 Bursts
A cursory examination of the RXTE data revealed several short (0.25 s), intense (30 c s-1 PCU-1) bursts – as typical for SGRs – in each observation. We therefore made a systematic search for bursts in all data sets. We constructed a 1/8-s-resolution light curve for each observation and identified all bins with 4 fluctuations above background. These bursts, detected in one or two adjacent time-bins exclusively, are listed in Table 2. Since we do not make a detailed investigation of the burst spectra, burst fluences given in the table should be taken as suggestive only.
Exactly one burst is detected in the Chandra dataset. This event occurred at 2001 April 22.30, 9079.8 s after the start of the first observation, and contains 14 photons over 0.27 s for a count rate of times the quiescent rate. This implies a 0.5–10 keV X-ray flux of (for either spectral model), and an unabsorbed flux of (for the PL+BB model) or (for the PL-only model).
All seven bursts detected during the second RXTE observation occurred during times of simultaneous observation by Chandra. Examination of the Chandra light curve reveals that several of these bursts were accompanied by a mild excess in the ACIS count rate. The excess Chandra counts at the times of the RXTE bursts provide an independent demonstration of the consistency of the absolute timing for both satellites, to a precision of 0.1 s. In the context of the Chandra continuous-clocking observation, this establishes the position of the source on-chip, along the Y axis, to 35 pixels, and the position of the source on-sky to 18 arcsec from its August 1998 VLA position (the assumed location for all timing analyses). We make a more precise determination of the two-dimensional source position below (Sec. 2.2.5).
2.2.4 Pulsations
Fourier power spectra of the two Chandra observations show a clear pulse peak at the location of the known 5.17 s period of SGR 1900+14 (Hurley et al., 1999c). To make a more precise characterization of the pulse period and phase at the start of each observation, we performed a phase connection of the Chandra data; this also allowed us to test for variability of the pulse strength over the course of the observation. The phase connection procedure was implemented by dividing the observation into six sections and folding the data (a barycenter-corrected light curve with 1/8-s resolution) in each section about the pulse period. From the folded pulse profile we derived the phase at the start of each section, as well as a phase uncertainty that we determined by Monte Carlo simulation. The connection of these phases then provided us with the value and uncertainties for the observation’s pulse period and starting pulse phase.
We find the pulse profile of the first Chandra observation to be largely sinusoidal. There is evidence, at the 2.9- level, for power at the first harmonic of the pulse period (twice the main pulse frequency); the harmonic power is % the power at the fundamental if it is real. Any power at the second harmonic is less than 3.5% the power of the fundamental at 90%-confidence.
The pulse profile of the second Chandra observation has a first harmonic detected with 3- confidence. Its power is % the power at the fundamental, marginally consistent with results from the first observation. Any power at the second harmonic is less than 7.2% the power of the fundamental at 90%-confidence for this observation. Folded pulse profiles from the two Chandra observations are shown in Figure 5.
We also performed a phase connection on the data from the RXTE observations. The procedure was identical; however, we used a barycenter-corrected light curve of 1/8-s resolution divided into four sections. Uncertainties from this analysis were greater due to the much larger background in the RXTE data.
The results of our timing analysis are shown in Table 3. A Bayesian period-estimator (Gregory & Loredo, 1992) analysis of the data yielded similar results. The pulsed signal did not show detectable variation in frequency or strength over the course of any observation, consistent with prior and contemporaneous reports (Woods et al., 2001) and with expectations for a slow pulsar such as SGR 1900+14. A global analysis of our results yields a period derivative for SGR 1900+14 of at the epoch of the first RXTE observation, MJD 52020.5, consistent with the more precise results of Woods et al. (2001). There are no significant variations of the strength or profile of the pulsations with energy for either Chandra observation.
2.2.5 Localization
The one-dimensional spatial profile is consistent at close radii with an unresolved source, having a Gaussian shape with (c.f. Marshall et al., 2001). Kouveliotou et al. (2001) have pointed out that at larger radii (5 arcsec) a scattering halo, the product of X-ray scattering off of interstellar dust, is apparent.
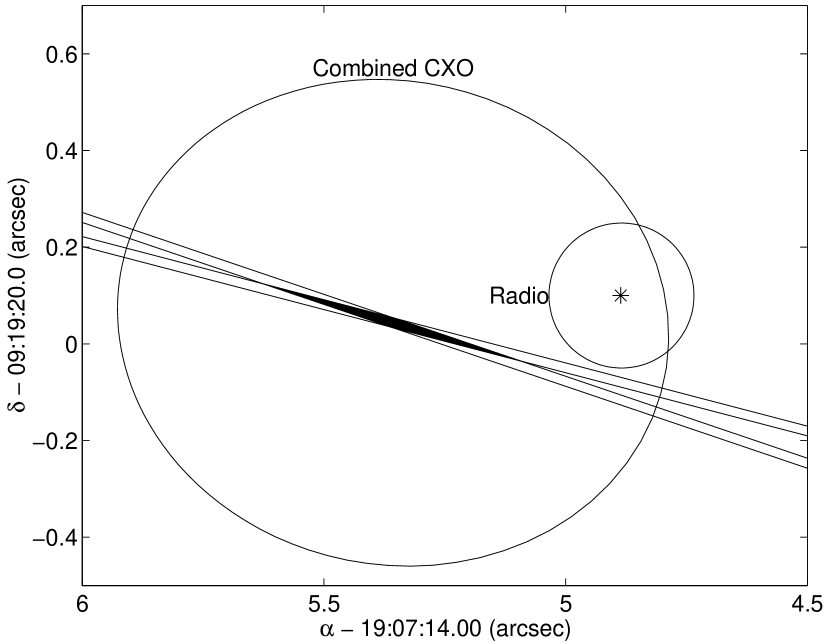
With only one dimension of spatial information, an individual observation does not give a precise two dimensional location (without highly precise timing information), but merely confines the source to a one-dimensional locus. We were able, however, to use the two observations together to obtain a two-dimensional localization as each observation was taken at a slightly different orientation, with roll angles differing by . When the one-dimensional positions are combined, there is a quasi-elliptical region of overlap centered at , , with statistical 1- error contours of semi-major axis , semi-minor axis , and position angle East of North (Figure 6). This position has absolute systematic uncertainties of up to due to Chandra aspect errors, but we have here assumed that the separate observations possess internally consistent aspect determinations to 0.1 arcsec; this agrees with our experience with other Chandra data sets. Under this assumption, the resulting localization is consistent to a high degree of accuracy with the position of the August 1998 radio transient (Frail et al., 1999).
3 Discussion
3.1 Radio
Frail et al. (1999) reported, following the giant August 1998 flare, the detection of a transient radio source. Their observations covered the time interval from 1 week to 1 month after the burst. The source was detected in the first observation, 1 week after the burst, and then declined over the course of the following four observations (9–30 d; Fig. 1). Thus – at least for this giant flare – the radio source appears to have peaked about a week after the burst and subsequently undergone a power-law decay.
For the April 2001 flare, we undertook VLA observations beginning 0.17 d after the event and ending almost two weeks later (Table 4). Despite our prompt radio observations, we did not detect a radio source comparable in strength to the August 1998 flare at any of our five epochs of observation.
The fluence of the August 1998 flare was erg cm-2 (here we include the contribution to the fluence from the initial hard spike and the subsequent softer afterglow; Feroci et al. 2001). In contrast, the fluence of the April 2001 flare was erg cm-2 (Hurley et al., 2001). The inferred peak flux of the transient radio source for the August 1998 flare was about 400 Jy in the 8.46-GHz band. If the radio flux is proportional to the energy released by the flare then we would expect a peak radio flux of 10 Jy in the same band some time 0.1–10 d after the current flare. In this context, as seen from Table 4 and Fig. 1, our failure to detect a transient radio source is not surprising.
We end by noting a possibly interesting point. The origin of the transient radio source from SGR outbursts is not well understood. It is clear that the radio emission is powered by the flare in some way. Could it be that the radio emission arises from internal shocks of the emitted particles? Alternatively, the radio emission could be from the shock of the ambient gas driven by the burst of particles (the “afterglow” model). In this context we note that the radio emission of the August 1998 flare appears to peak, in the 8.46-GHz band, one week after the burst, suggesting that the emission at this frequency was optically thick. If so, the flux at earlier epochs may well have been higher at higher frequency. One way to test this idea would be to observe the burst source at higher frequencies (20 GHz) at early times. Observatories currently capable of the requisite sensitivity at these frequencies include the VLA, the Owens Valley Radio Observatory, and the James Clerk Maxwell Telescope (SCUBA).
3.2 X-ray
With our X-ray observations, we are able to establish that the X-ray source remains unresolved, in one dimension, even at Chandra’s extraordinary resolution. Our upper limit of 0.6 arcsec on the FWHM of any persistent extended emission translates into a physical extent of less than pc, where is the distance to the source divided by five kiloparsecs. Recent suggestions that SGR 1900+14 could be as distant as 15 kpc (Vrba et al., 2000) may relax this constraint somewhat, but in general the possibilities for localized plerionic emission (c.f. Gaensler, 2001) seem remote at this point.
Using the two Chandra observations in concert we are able to derive a highly precise location for SGR 1900+14. Although the uncertain Chandra absolute aspect probably implies an uncertainty of 1 arcsec in this position, the best-fit location is less than 0.5 arcsec from the location of the August 1998 radio flare (Frail et al., 1999). Our limit on the proper motion of the source becomes relevant if one considers that SGR 1900+14 has been proposed to be associated with G42.80.6, 12 arcmin distant, and that the nominal spin-down age of SGR 1900+14 was measured, at least initially, to be just 700 yr (Kouveliotou et al., 1999). Taken at face value this would imply a proper motion of fully 1.0 arcsec per year, or 2.7 arcsec between August 1998 and May 2000, significantly exceeding our limit. The alternative possibilities – that SGR 1900+14 is not associated with G42.80.6, or that SGR 1900+14 is significantly older than its spin-down age would imply – are consistent with our data.
Our X-ray spectral observations find the source initially in a state of enhanced X-ray luminosity relative to the quiescent-state observations of Woods et al. (1999a) and Woods et al. (2001). These past observations found the source at an unabsorbed 2–10 keV flux of erg cm-2 s-1 on two occasions, 1997 May and 2000 March. Our first observation finds the source at 20% greater flux, while the flux at the second observation is consistent with the quiescent value (Table 1). The fading nature of this excess emission is confirmed by reports of Beppo-SAX observations at earlier times (Feroci et al., 2001). Spectral parameters for the thermal component in the spectrum are consistent with values reported for the source in quiescence (Woods et al., 1999a, 2001; Perna et al., 2001), and despite the 20% decline in total X-ray flux between our two observations, fitted blackbody parameters show no significant variation – indicating that the variations in source flux are produced solely by the power-law component in the spectrum. Similar fading of the power-law component alone was observed in the wake of the August 1998 giant flare of the source (Woods et al., 1999a). This stability of the blackbody component of SGR 1900+14 has been cited as evidence in favor of the magnetar model for SGRs, with the blackbody produced by surface thermal emission and the power law produced in the magnetosphere by, e.g., inverse Compton effects (Woods et al., 1999a). This interpretation must be further strengthened by the observations reported here, as the stability of the blackbody component of SGR 1900+14 has now withstood two giant flares as well as substantial excursions in X-ray flux.
The X-ray spectrum of SGR 1900+14 thus provides an interesting link between the SGR population and the related population of anomalous x-ray pulsars (AXPs). The AXPs (see Mereghetti 2000) are a group of sources that emit steady, pulsed X-ray emission () with periods and spin-down rates similar to those of the SGRs; indeed, Thompson & Duncan (1996) used spin properties to argue that the SGRs and AXPs were related. However, these spin properties are also shared by a growing class of long-period radio pulsars (Kaspi et al., 1999) which seem otherwise unrelated to both the AXPs – showing no persistent bright X-ray emission (Pivovaroff et al., 2000) – and the SGRs – showing no bursting behavior. We must therefore require more evidence than similar spin properties to relate the SGRs and AXPs.
For some time the X-ray spectra of the two groups appeared to have important differences: the SGRs had relatively hard power-law spectra with photon indices and negligible blackbody contributions (Hurley, 2000), while the AXPs had softer spectra, with and keV blackbodies contributing up to 70% of the X-ray flux (Mereghetti, 2000). But this situation has been changing. Observations of the quiescent SGR 052666 found a photon index of 3.2 – closer to the nominal AXP index than to the that of the other SGRs – and possible evidence for a 0.5 keV blackbody (Kulkarni et al., 2001a). This may put the value of the photon index on a continuum related to burst activity and magnetic field geometry for both groups. Observations of SGR 1900+14 in quiescent and active states demonstrated the presence of an underlying 0.5 keV blackbody (Woods et al., 1999a, 2001). Updated spectral fits of archival ASCA data of SGRs and AXPs have shown that both groups seem to possess blackbody components whose fraction of the overall X-ray emission may constitute another unifying continuum (Perna et al., 2001). Spectral fits to the AXP 1E 1048.15937 show that it has a hard power-law component reminiscent of the SGRs (Kaspi et al., 2001). And finally, optical and infrared observations of SGRs (Kaplan et al., 2001a; Kulkarni et al., 2001b) and AXPs (Hulleman et al., 2000, 2000) have shown that the groups have similar X-ray-to-optical flux ratios, so that this ratio may be a distinguishing characteristic of the two, as a group (Hulleman et al., 2000). All of these findings have strengthened arguments for association between the AXPs and SGRs.
The blackbody component of the SGR 1900+14 spectrum, with keV and km, has parameters that are similar to those of other isolated NS candidates (c.f. Verbunt et al., 1994). The relatively small emitting radius that we find, significantly smaller than the nominal 10 km-radius NS, is typically interpreted as either due to restricted emission from, e.g., the NS polar caps, or as the result of temperature-dependent opacity effects in the NS atmosphere (Rutledge et al., 1999; Perna et al., 2001). The latter scenario would allow for closer distances, lower surface temperatures, and, potentially, emission from the entire NS surface (Perna et al., 2001).
The absence of any narrow spectral features, to equivalent widths of less than 150 eV, is somewhat surprising given the detection by Strohmayer & Ibrahim (2000) of a strong, 400-eV equivalent width, 6.4-keV emission line in the RXTE spectrum of a 1998 August 29 burst of SGR 1900+14. Strohmayer & Ibrahim (2000) discuss two possible interpretations for the feature they observe: first, that it may result from fluorescence of relatively cool iron in the near vicinity of the NS; and second, that it may result from proton or alpha particle (He4) cyclotron transitions in the SGR magnetosphere; these ions would have been liberated by the closely-preceding giant flare of 1998 August 27. However, if the line resulted from iron fluorescence then we would expect, with Chandra’s superior spectral resolution, to have substantially greater sensitivity with the current observations; note that the original emission feature was unresolved by the RXTE PCA. Similarly, if the line resulted from cyclotron emission by He4 or H ions liberated by the preceding giant flare, then we would expect to observe such cyclotron emission in the wake of the current 2001 April 18 flare as well. Both of these scenarios would generate line emission in bursting and persistent source spectra alike. Our upper limits on the presence of any such feature in the persistent source spectrum therefore seem to imply that the line emission is a function of the properties of (at least some of) the bursts alone.
4 Conclusions
We have observed the soft-gamma repeater SGR 1900+14 with high-resolution X-ray (Chandra, RXTE) and radio (VLA) observatories in the immediate aftermath of its 2001 April 18 giant flare. Our detailed study of the Chandra and RXTE X-ray spectra reveals the presence of an underlying thermal component in the spectrum. This thermal component, which we model as a blackbody, has an effective temperature of 0.5 keV and an effective blackbody radius of km, where is the distance to the source divided by 5 kpc. This two-component PL+BB spectrum is strongly reminiscent of the spectra of the anomalous X-ray pulsars, further strengthening the association between these two intriguing classes of neutron star.
We detect enhanced, fading X-ray emission from the source, which is modulated by the source’s known 5.17 s pulsations and, intermittently, by brief bursts of hard X-rays. Detailed studies of the pulsations will be able to determine whether any “glitch” of the source was associated with the April 18 flare. We are able to localize the source to 1 arcsec, and find that the current position remains consistent with the Frail et al. (1999) radio position from August 1998. This corresponds to an upper limit of 1 arcsec per year on any proper motion of SGR 1900+14.
The upper limits we derive on any radio emission from SGR 1900+14 in the 0.2–11 d following the flare may have implications for physical models of the post-flare radio emission. Higher-frequency (20 GHz) observations in the immediate aftermath of future flares will provide stronger constraints for models that predict optically thick emission at lower frequencies.
References
- Duncan & Thompson (1992) Duncan, R. C. & Thompson, C. 1992, ApJ, 392, L9
- Eikenberry & Dror (2000) Eikenberry, S. S. & Dror, D. H. 2000, ApJ, 537, 429
- Evans et al. (1980) Evans, W. D., Klebesadel, R. W., Laros, J. G., Cline, T. L., Desai, U. D., Teegarden, B. J., Pizzichini, G., Hurley, K., Niel, M., & Vedrenne, G. 1980, ApJ, 237, L7
- Feroci et al. (2001) Feroci, M., Hurley, K., Duncan, R. C., & Thompson, C. 2001, ApJ, 549, 1021
- Feroci et al. (2001) Feroci, M. et al. 2001, GCN 1055
- Frail et al. (1999) Frail, D. A., Kulkarni, S. R., & Bloom, J. S. 1999, Nature, 398, 127
- Fuchs et al. (1999) Fuchs, Y., Mirabel, F., Chaty, S., Claret, A., Cesarsky, C. J., & Cesarsky, D. A. 1999, A&A, 350, 891
- Gaensler (2001) Gaensler, B. M. 2001, in AIP Conference Proceedings, Vol. 565, Young Supernova Remnants, ed. S. S. Holt & U. Hwang (New York: AIP), 295
- Gregory & Loredo (1992) Gregory, P. C. & Loredo, T. J. 1992, ApJ, 398, 146
- Guidorzi et al. (2001) Guidorzi, C. et al. 2001, GCN 1041
- Hulleman et al. (2000) Hulleman, F., van Kerkwijk, M. H., & Kulkarni, S. R. 2000, Nature, 408, 689
- Hulleman et al. (2000) Hulleman, F., van Kerkwijk, M. H., Verbunt, F. W. M., & Kulkarni, S. R. 2000, A&A, 358, 605
- Hurley (2000) Hurley, K. 2000, in Gamma-Ray Bursts: 5th Huntsville Symposium, ed. R. M. Kippen, R. S. Mallozi, & G. J. Fishman, 763, (astro-ph/9912061)
- Hurley et al. (1999a) Hurley, K., Cline, T., Mazets, E., Barthelmy, S., Butterworth, P., Marshall, F., Palmer, D., Aptekar, R., Golenetskii, S., Il’Inskii, V., Frederiks, D., McTiernan, J., Gold, R., & Trombka, J. 1999a, Nature, 397, 41
- Hurley et al. (1999b) Hurley, K., Kouveliotou, C., Woods, P., Cline, T., Butterworth, P., Mazets, E., Golenetskii, S., & Frederics, D. 1999b, ApJ, 510, L107
- Hurley et al. (1999c) Hurley, K., Li, P., Kouveliotou, C., Murakami, T., Ando, M., Strohmayer, T., van Paradijs, J., Vrba, F., Luginbuhl, C., Yoshida, A., & Smith, I. 1999c, ApJ, 510, L111
- Hurley et al. (1996) Hurley, K., Li, P., Vrba, F., Luginbuhl, C., Hartmann, D., Kouveliotou, C., Meegan, C., Fishman, G., Kulkarni, S., Frail, D., Bowyer, S., & Lampton, M. 1996, ApJ, 463, L13
- Hurley et al. (2001) Hurley, K. et al. 2001, GCN 1043
- Kaplan et al. (2001a) Kaplan, D. L., Kulkarni, S. R., van Kerkwijk, M. H., Rothschild, R. E., Lingenfelter, R. L., Marsden, D., Danner, R., & Murakami, T. 2001a, ApJ, 556, 399
- Kaplan et al. (2001b) Kaplan, D. L., Kulkarni, S. R., van Kerkwijk, M. H., & Frail, D. A. 2001b, ApJ, submitted
- Kaspi et al. (1999) Kaspi, V. M., Camilo, F., Lyne, A. G., Manchester, R. N., Bell, J. F., D’Amico, N., McKay, N. P. F., & Crawford, F. 1999, astro-ph/9912281
- Kaspi et al. (2001) Kaspi, V. M., Gavriil, F. P., Chakrabarty, D., Lackey, J. R., & Muno, M. P. 2001, astro-ph/0107288
- Kouveliotou et al. (1998) Kouveliotou, C., Dieters, S., Strohmayer, T., van Paradijs, J., Fishman, G. J., Meegan, C. A., Hurley, K., Kommers, J., Smith, I., Frail, D., & Murakami, T. 1998, Nature, 393, 235
- Kouveliotou et al. (1993) Kouveliotou, C., Fishman, G. J., Meegan, C. A., Paciesas, W. S., Wilson, R. B., van Paradijs, J., Preece, R. D., Briggs, M. S., Pendleton, G. N., & Brock, M. N. 1993, Nature, 362, 728
- Kouveliotou et al. (1999) Kouveliotou, C., Strohmayer, T., Hurley, K., van Paradijs, J., Finger, M. H., Dieters, S., Woods, P., Thompson, C., & Duncan, R. C. 1999, ApJ, 510, L115
- Kouveliotou et al. (2001) Kouveliotou, C., Tennant, A., Woods, P. M., Weisskopf, M. C., Hurley, K., Fender, R. P., Garrington, S. T., Patel, S. K., & Göğüş, E. 2001, astro-ph/0107170
- Kulkarni & Frail (1993) Kulkarni, S. R. & Frail, D. A. 1993, Nature, 365, 33
- Kulkarni et al. (2001a) Kulkarni, S. R., Kaplan, D. L., Marshall, H. L., Frail, D. A., Murakami, T., & Yonetoku, D. 2001a, Nature, submitted
- Kulkarni et al. (2001b) Kulkarni, S. R., Kaplan, D. L., Marshall, H. L., van Kerkwijk, M. H., & Frail, D. A. 2001b, in preparation
- Lorimer & Xilouris (2000) Lorimer, D. R. & Xilouris, K. M. 2000, ApJ, 545, 385
- Marsden et al. (2001) Marsden, D., Lingenfelter, R., Rothschild, R., & Higdon, J. 2001, ApJ, in press, (astro-ph/9912207)
- Marshall et al. (2001) Marshall, H. L., Rutledge, R., Fox, D. W., Miller, J. M., Guerriero, R., Morgan, E., van der Klis, M., Bildsten, L., Dotani, T., & Lewin, W. H. G. 2001, AJ, in press, preprint (astro-ph/0103203)
- Mazets et al. (1979a) Mazets, E. P., Golenetskij, S. V., & Guryan, Y. A. 1979a, Soviet Astronomy Letters, 5, 343+
- Mazets et al. (1979b) Mazets, E. P., Golentskii, S. V., Il’inskii, V. N., Aptekar’, R. L., & Guryan, I. A. 1979b, Nature, 282, 587
- Mereghetti (2000) Mereghetti, S. 2000, in The Neutron Star - Black Hole Connection, ed. V. Connaughton, C. Kouveliotou, J. van Paradijs, & J. Ventura (NATO Advanced Study Institute), (astro-ph/9911252)
- Paczyński (1992) Paczyński, B. 1992, Acta Astronomica, 42, 145
- Palmer (2001) Palmer, D. M. 2001, in Soft Gamma Repeaters: The Rome 2001 Mini-Workshop, ed. M. Feroci & S. Mereghetti, astro-ph/0103404
- Perna et al. (2001) Perna, R., Heyl, J., Hernquist, L., Juett, A., & Chakrabarty, D. 2001, ApJ, in press, (astro-ph/0103273)
- Pivovaroff et al. (2000) Pivovaroff, M. J., Kaspi, V. M., & Camilo, F. 2000, ApJ, 535, 379
- Rutledge et al. (1999) Rutledge, R. E., Bildsten, L., Brown, E. F., Pavlov, G. G., & Zavlin, V. E. 1999, ApJ, 514, 945
- Strohmayer & Ibrahim (2000) Strohmayer, T. E. & Ibrahim, A. I. 2000, ApJ, 537, L111
- Thompson & Duncan (1993) Thompson, C. & Duncan, R. C. 1993, ApJ, 408, 194
- Thompson & Duncan (1995) —. 1995, MNRAS, 275, 255
- Thompson & Duncan (1996) —. 1996, ApJ, 473, 322
- van Paradijs et al. (1995) van Paradijs, J., Taam, R. E., & van den Heuvel, E. P. J. 1995, A&A, 299, L41
- Vasisht et al. (1994) Vasisht, G., Kulkarni, S. R., Frail, D. A., & Greiner, J. 1994, ApJ, 431, L35
- Verbunt et al. (1994) Verbunt, F., Belloni, T., Johnston, H. M., van der Klis, M., & Lewin, W. H. G. 1994, A&A, 285, 903
- Vrba et al. (2000) Vrba, F. J., Henden, A. A., Luginbuhl, C. B., Guetter, H. H., Hartmann, D. H., & Klose, S. 2000, ApJ, 533, L17
- Woods et al. (2001) Woods, P. M., Kouveliotou, C., Göğüş, E., Finger, M. H., Swank, J., Smith, D. A., Hurley, K., & Thompson, C. 2001, ApJ, 552, 748
- Woods et al. (1999a) Woods, P. M., Kouveliotou, C., van Paradijs, J., Finger, M. H., & Thompson, C. 1999a, ApJ, 518, L103
- Woods et al. (1999b) Woods, P. M., Kouveliotou, C., van Paradijs, J., Finger, M. H., Thompson, C., Duncan, R. C., Hurley, K., Strohmayer, T., Swank, J., & Murakami, T. 1999b, ApJ, 524, L55
- Woods et al. (2001) Woods, P. M. et al. 2001, GCN 1056
| Parameter | PL | 5–10 keV PL | PL+BB | |||
|---|---|---|---|---|---|---|
| Obs 1 | Obs 2 | Obs 1 | Obs 2 | Obs 1 | Obs 2 | |
| ()aaHeld constant over the two observations for a given model. | 2.3(1) | |||||
| PL Index | 2.0(2) | 1.9(3) | ||||
| PL NormbbIn units of at 1 keV. | 0.004(1) | 0.003(1) | ||||
| PL FluxccAll fluxes are 0.5–10 keV, absorbed, unless otherwise specified; flux units are . | 9.2 | 7.6 | 7.9 | 6.3 | ||
| BB (keV) | 0.52(3) | 0.49(3) | ||||
| BB NormddIn units of , where is the source radius. | 0.008(2) | 0.011(3) | ||||
| BB FluxccAll fluxes are 0.5–10 keV, absorbed, unless otherwise specified; flux units are . | 1.8 | 1.8 | ||||
| Total FluxccAll fluxes are 0.5–10 keV, absorbed, unless otherwise specified; flux units are . | 9.2 | 7.6 | 9.7 | 8.1 | ||
| Unabs. FluxccAll fluxes are 0.5–10 keV, absorbed, unless otherwise specified; flux units are . | 42.6 | 39.5 | 23.1 | 19.5 | ||
| 2–10 keV FluxccAll fluxes are 0.5–10 keV, absorbed, unless otherwise specified; flux units are . | 8.5 | 6.9 | 9.0 | 7.5 | ||
| Unabs. 2–10 keV FluxccAll fluxes are 0.5–10 keV, absorbed, unless otherwise specified; flux units are . | 11.7 | 9.7 | 11.6 | 9.6 | ||
| 279.8 | 227.5 | 32.8 | 25.2 | 276.2 | 220.7 | |
| DOF | 318 | 287 | 59 | 44 | 318 | 288 |
| 0.88 | 0.84 | 0.56 | 0.57 | 0.87 | 0.77 | |
| Total eeTotal reduced for a model, incorporating both observations. | 0.84 | 0.56 | 0.82 | |||
Note. — Number in parentheses is 1- uncertainty on last digit.
| Time | Counts | Fluence | |
|---|---|---|---|
| Date / Inst. | (TDB) | (raw) | ( cgs) |
| 21 April RXTE (3) | 08:05:41.38 | 20 | 6.3 |
| 08:08:56.88 | 31 | 9.9 | |
| 08:34:41.88 | 30 | 9.6 | |
| 08:34:58.51 | 38 | 12.2 | |
| 08:38:45.25 | 166 | 52.7 | |
| 08:42:18.13 | 27 | 8.6 | |
| 08:42:19.01 | 80 | 25.3 | |
| 08:45:50.26 | 65 | 20.7 | |
| 21 April RXTE (4) | 09:49:38.48 | 17 | 4.0 |
| 09:50:26.86 | 18 | 4.2 | |
| 10:17:23.61 | 31 | 7.5 | |
| 10:22:26.23 | 22 | 5.2 | |
| 21 April RXTE (2) | 11:19:11.83 | 150 | 71.3 |
| 22 April Chandra | 07:18:00.30 | 10 | 36.5 |
| 1 May RXTE (4) | 01:49:06.89 | 65 | 15.4 |
| 02:16:55.26 | 28 | 6.7 | |
| 02:35:08.01 | 16 | 3.8 | |
| 02:35:43.39 | 19 | 4.4 | |
| 02:36:56.64 | 15 | 3.5 | |
| 02:37:28.51 | 18 | 4.3 | |
| 02:37:32.64 | 16 | 3.9 | |
| 1 May RXTE (3) | 03:36:40.97 | 21 | 6.7 |
| 04:01:26.22 | 113 | 35.9 |
Note. — Numbers in parentheses for RXTE observations indicate the number of active PCUs at the time of observation. Times are corrected to the solar-system barycenter (TDB). Estimated fluences in units of erg cm-2 are calculated using the following conversion factors: 1 RXTE c PCU-1 erg cm-2 (7–20 keV); 1 Chandra ACIS c erg cm-2 (0.1–11 keV).
| Pulsations | ||||
|---|---|---|---|---|
| Mission | Epoch (MJD) | Phase (cyc.) | Period (s.) | Strength (%rms) |
| RXTE | 52020.5 | 0.76(9) | 5.17274(22) | |
| Chandra | 52021.25 | 0.84(2) | 5.172908(40) | 16.2(9) |
| Chandra | 52030.0 | 0.46(2) | 5.172947(65) | 13.4(11) |
| RXTE | 52030.0 | 0.62(9) | 5.17321(21) | |
Note. — Times are corrected to the solar-system barycenter (TDB); MJD is . Phases reported refer to the phase of the sine wave at the fundamental frequency. Uncertainties in the last significant digit(s) are shown in parentheses. RMS pulse strengths have been corrected for background and include the contributions of the fundamental and first harmonic power.
| Date of | Days after | Frequency | Duration | rms |
|---|---|---|---|---|
| Observation (UT) | Flare | (GHz) | (min) | ( Jy) |
| 2001 Apr 18.58 | 0.17 | 8.4 | 15 | 40 |
| 2001 Apr 20.52 | 2.11 | 8.4 | 15 | 40 |
| 2001 Apr 20.53 | 2.12 | 1.4 | 15 | 200 |
| 2001 Apr 21.53 | 3.12 | 8.4 | 15 | 40 |
| 2001 Apr 24.50 | 6.09 | 8.4 | 60 | 20 |
| 2001 Apr 29.58 | 11.2 | 8.4 | 15 | 40 |
Note. — All observations were in B configuration.