Deep Radio, Optical, and Infrared Observations of SGR 190014
Abstract
We present HST/STIS, Keck - and -band, and VLA 332-MHz and 1400-MHz images of the region around the Soft -ray Repeater SGR 190014. No non-stellar sources were detected at the position of SGR 190014, giving 3- limits of mJy, mJy, mag, mag, mag (point sources), and , (extended emission). Given the very high extinction, the STIS and -band non-detections are not constraining, but the -band limit rules out basic accretion disk models for SGR 190014, and is almost comparable in depth to the -band detection for the anomalous X-ray pulsar 4U 014261. Finally, we report the detection in this field of three new candidate supernova remnants, SNRs G043.500.6, G042.000.1, and G041.5+00.4.
1 Introduction
Soft -ray Repeaters (SGRs; see Hurley 2000 for a recent observational review) are sources both of bursts of hard X-rays/-rays and softer quiescent X-ray emission. They are generally thought to be young ( yr) neutron stars with extremely strong magnetic fields, or magnetars (e.g. Duncan & Thompson 1992; Thompson & Duncan 1993). This belief was motivated by the energetics of their bursts (Paczyński 1992; Thompson & Duncan 1995), their associations with young supernova remnants (SNRs; Evans et al. 1980; Kulkarni & Frail 1993; Vasisht et al. 1994), and the detection of X-ray pulsations with long (5–10 s) periods and large () spin-down rates (Kouveliotou et al. 1998; Hurley et al. 1999d). However, more recent observational evidence (Lorimer & Xilouris 2000; Hurley et al. 1999b; Kaplan et al. 2002) has shown that in most cases the SGR/SNR associations are false and can be attributed to random chance (Gaensler et al. 2001). Instead of being constrained by the SNR associations, the small ages of the SGRs are now limited by the proximity of the SGRs to sites of very massive star formation (Fuchs et al. 1999; Vrba et al. 2000).
An alternate theory, first proposed (van Paradijs, Taam, & van den Heuvel 1995; Chatterjee, Hernquist, & Narayan 2000) for the emission from the related Anomalous X-ray Pulsars (AXPs; see Mereghetti 2000), and now for the SGRs as well (Marsden et al. 2000, 2001; but see Duncan 2001), is accretion from a “fallback” disk of material produced during the supernova explosion onto a central neutron star. In this model, the neutron stars are spinning near the equilibrium period which is proportional to the dipole field strength. This model then explains the spin-down and period clustering of the AXPs: for a typical field strength of G, the resultant spin period is s.
To date, no confirmed persistent counterparts have been found for SGRs at optical/IR or radio wavelengths (e.g. Kaplan et al. 2001), although Eikenberry et al. (2001) may have found an infrared counterpart to SGR 180620. It generally has been the case that when counterparts are identified at other wavelengths, especially optical or IR, there is considerable progress in our understanding of these objects. For example, the identification of an optical/IR counterpart of the AXP 4U 0142+61 (Hulleman, van Kerkwijk, & Kulkarni 2000) has posed the strongest challenge to accretion models. In view of this, it is important to press upon sensitive multi-wavelength observations of SGRs. Here we present optical, IR, and radio observations of the very accurately localized SGR 190014 (Frail, Kulkarni, & Bloom 1999; Hurley et al. 1999d).
1.1 SGR 190014
SGR 190014 had been a relatively innocuous source until late 1998. The source of sporadic bursting emission (Mazets, Golenetskij, & Guryan 1979; Kouveliotou et al. 1993), it had been associated with a soft, persistent X-ray source (Hurley et al. 1996) and a SNR, G042.800.6 (Vasisht et al. 1994). On 1998 August 27, the spacecraft Konus detected an intense burst of -rays (Hurley et al. 1999a). Arrival-time localization (Hurley et al. 1999c) soon identified SGR 190014 as the source. Prompt radio observations detected a fading, non-thermal source (Frail et al. 1999) coincident with the X-ray source (Hurley et al. 1999d), and timing of the X-ray emission revealed a 5.16-s pulsar (Hurley et al. 1999d) with magnetar-like spin-down (Kouveliotou et al. 1999). The radio source associated with the 1998 August 27 burst is located at , , with uncertainty in each coordinate (Frail et al. 1999).
Searches for SGR 190014 at wavelengths other than X-ray and -ray have not detected any quiescent counterpart (Hurley et al. 1996; Lorimer & Xilouris 2000; Eikenberry & Dror 2000; Vrba et al. 2000). However, Lorimer & Xilouris (2000) did detect a young ( yr old) radio pulsar (PSR J19070918) located in the vicinity111PSR J19070918 is located at , , with uncertainty in each coordinate (Lorimer & Xilouris 2000). of both SGR 190014 and G042.800.6, suggesting that G042.800.6 could be associated with PSR J19070918 just as easily as with SGR 190014.
Vrba et al. (2000) have suggested that SGR 190014 is somehow related to a compact cluster found in its vicinity (about away). A similar cluster has been identified near SGR 180620 (Fuchs et al. 1999). We note, though, that no such cluster is found in the vicinity of SGR 0526-66 in the HST images presented by Kaplan et al. (2001). Furthermore, SGR 180620 and SGR 190014 are found at low Galactic latitudes in the inner Galaxy and the chance coincidence probability with star clusters, the rare Luminous Blue Variables (LBVs) and SNRs is not negligible (e.g. Gaensler et al. 2001). Indeed, there is now significant doubt about the association of SGR 180620 with the SNR G10.00.3 (Hurley et al. 1999b; Kaplan et al. 2002). Nonetheless, the presence of star clusters in the vicinity of SGR 190014 appears intriguing, but while our radio maps are deeper than previous images (e.g. Vasisht et al. 1994) we find no radio source or nebulae associated with this star cluster (see Figures 3–5).
For the X-ray properties of SGR 190014 in what follows, we use the power-law blackbody fit to the second epoch (the one closer to normal quiescence) of the recent Chandra observations by Fox et al. (2001): , power-law index , blackbody temperature keV, and an un-absorbed 0.5–10 keV X-ray flux (also see Kouveliotou et al. 2001). This is consistent with the ASCA measurements of Hurley et al. (1999d). We adopt a distance kpc (Hurley et al. 1999d), which is based on hydrogen absorption. The hydrogen column density implies a visual extinction mag, assuming (Predehl & Schmitt 1995). These values differ significantly from those assumed for the star cluster (–15 kpc, mag; Vrba et al. 1996), and this difference may make the case for associating SGR 190014 and the cluster less compelling.
2 Observations
We have carried out a campaign at optical/IR and radio wavelengths to detect SGR 190014. The radio data can also determine the existence of a low surface-brightness nebula surrounding SGR 190014, and localize SGR 190014 relative to nearby SNRs. See Table 1 for a log of all the observations.
2.1 Optical
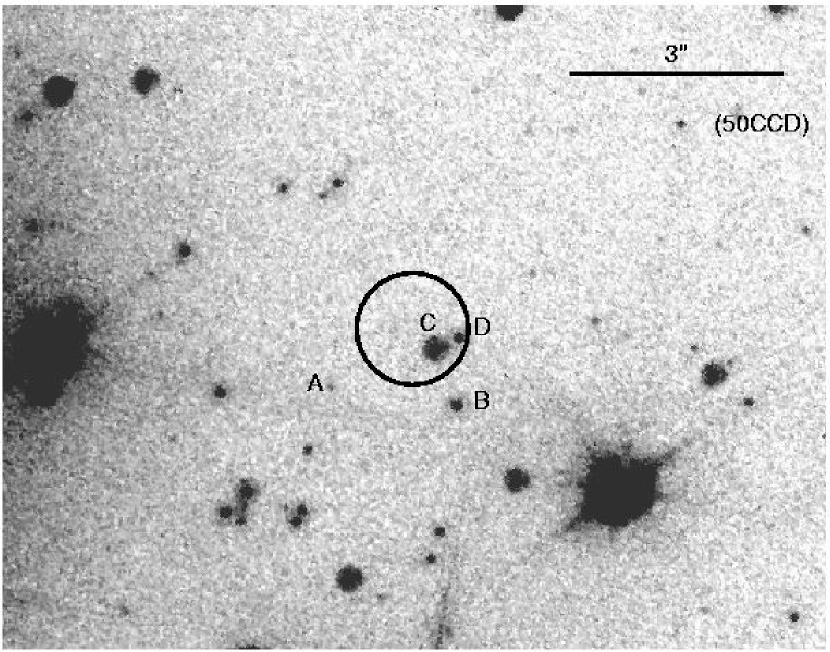
The optical data consist of 5 exposures taken by the Space Telescope Imaging Spectrograph (STIS) aboard the Hubble Space Telescope (HST), totaling 5195 s. The data were taken in imaging mode using the clear (50CCD) filter, giving a bandpass centered at roughly nm and a full-width at half-maximum (FWHM) of nm. The first exposure had a duration of 30 s, and was used for astrometry (see below). The remaining exposures were -s long and were dithered in the usual manner to improve resolution and mitigate the effects of CCD irregularities.
The reduction followed the standard procedure for STIS images. We followed the standard drizzling reduction procedure (Fruchter & Mutchler 1998) expanding the individual pixels by a factor of two. This drizzling changed the pixel scale from to . Typical stellar sources had a FWHM of ; see Figure 1.
For the astrometry, we selected from the USNO-A2.0 catalogue (Monet 1998) all 76 stars that overlapped with a 30-s R-band image taken on 28 August 1998 with the Low-Resolution Imaging Spectrograph (LRIS; Oke et al. 1995) on the Keck telescope. For the 54 stars that were not overexposed, we measured centroids and corrected for instrumental distortion using a bi-cubic function determined by J. Cohen (1997, private communication). We used these to solve for the zero-points in each coordinate, the plate scale, and the position angle on the sky. After rejecting 8 outliers (residual larger than ), the root-mean-square residuals were in each coordinate. This is somewhat larger than we found for other projects, but not atypical for relatively crowded Galactic fields on the Northern hemisphere. Given this, the astrometry is tied to the USNO-A2.0 system at the level. The typical accuracy with which the USNO-A2.0 catalogue is on the International Celestial Reference Frame (ICRF) is about (Deutsch 1999).
The astrometry was transferred to the STIS image using 43 stars close to the radio position, solving again for plate scale, rotation and zero-points. The rms residuals were in each coordinate, giving an overall astrometric uncertainty of in each coordinate. The 3- limiting magnitude, based on calibration using the photometric keywords in the image header, is , or nJy 222Note that STIS magnitudes are in the STMAG system, where , with in units of . All other magnitudes are Vega-based..
2.2 Infrared
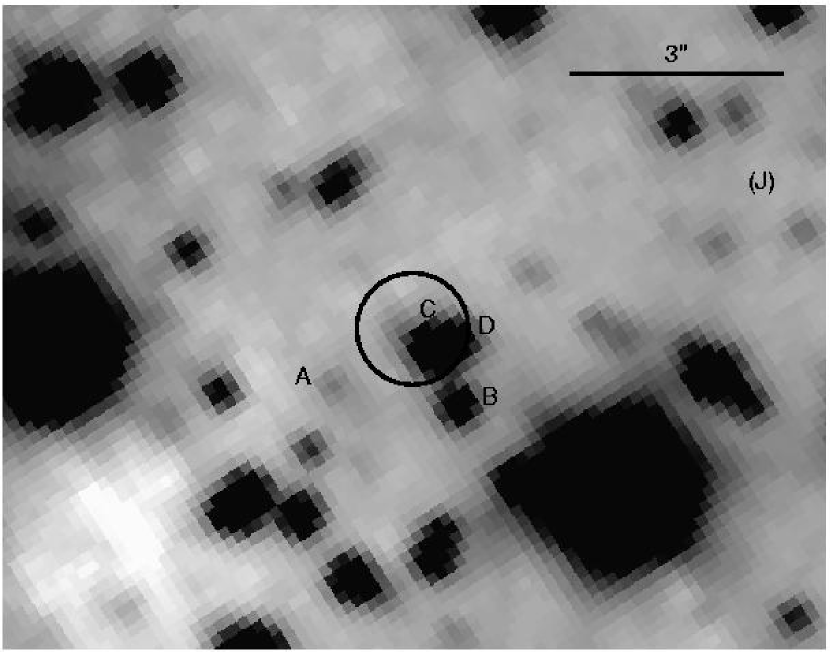
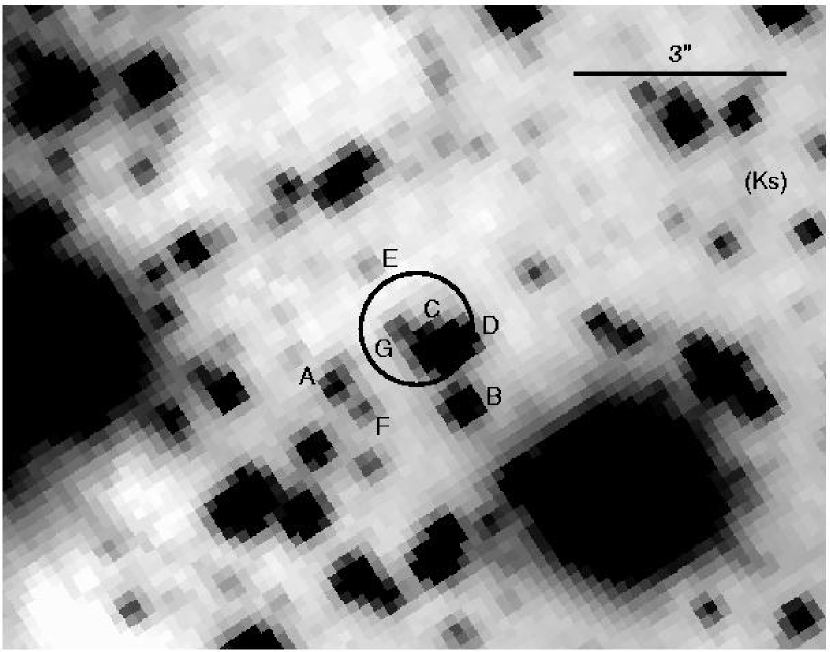
The infrared data were taken with the Near Infrared Camera (NIRC; Matthews & Soifer 1994) mounted on the 10-m Keck I telescope. The observations had photometric conditions and very good seeing ( at -band). The data were reduced with custom IRAF software. The images were dark subtracted, flat-fielded, and corrected for bad pixels and cosmic rays. We then made object masks, which were used to construct improved flat fields for a second round of reduction. The data were finally registered, shifted, and co-added; see Figure 2.
The astrometry was performed with 50 stars from the deep STIS image. This solution had errors of (in each coordinate) relative to the STIS image, or again relative to the ICRF. For photometric calibration we used the standard star SJ 9101 (Persson et al. 1998). The 3- limiting magnitudes are and , corresponding to and , based on the calibration of Bessell, Castelli, & Plez (1998).
2.3 Radio
The 1.4-GHz data were taken at the Very Large Array (VLA) in its C and D configurations using the standard continuum mode, with MHz bandwidth. The separate observations were calibrated independently, following the standard procedure in AIPS. The phase calibrator was JVAS J1925+2106, and the flux calibrator was 3C 48. The data were then self-calibrated and combined for imaging. The nominal beam size was , and the rms noise is ; see Figure 3.
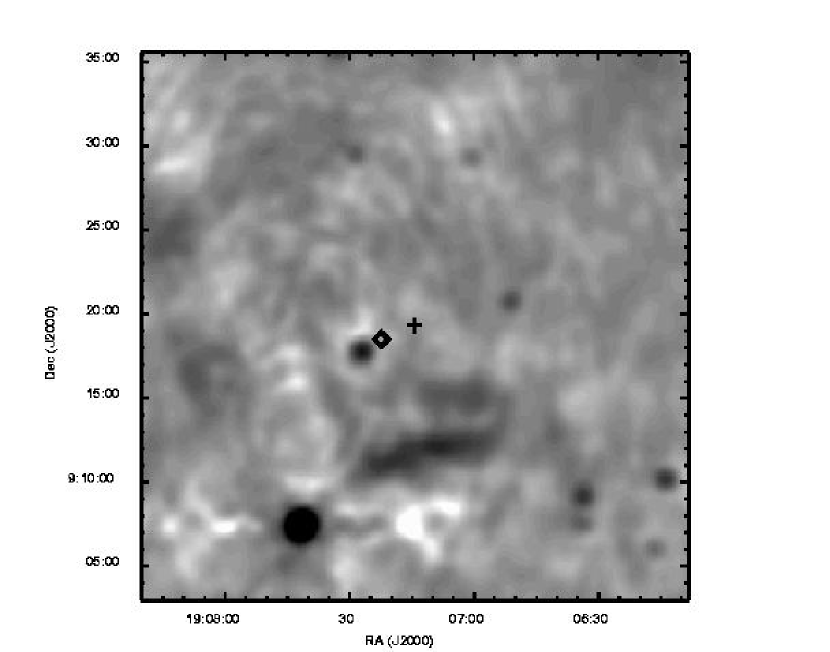
To aid in the detection of diffuse structure we also imaged using a -taper of , giving an effective beam size of . The rms noise is , largely due to confusion from unresolved sources in the Galactic plane; see Figure 4.
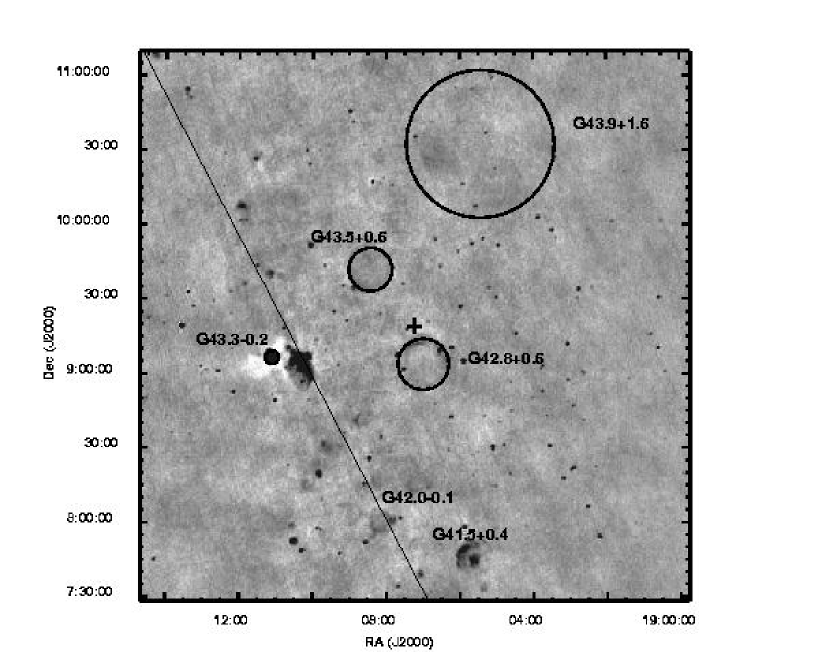
The 332 MHz data were taken at the VLA in spectral-line mode with 32 channels of 97 kHz each to aid in the excision of radio-frequency interference (RFI). We reduced the observations in AIPS, following the procedure for low-frequency data reduction333http://rsd-www.nrl.navy.mil/7213/lazio/tutorial/index.html (see also LaRosa et al. 2000). First we removed any egregious RFI. Then we phase (using 3C 380) and gain (using 3C 286 and 3C 48) calibrated the fringe visibilities. We again searched for and removed RFI, then averaged the channels together. We mapped and self-calibrated the data iteratively, using 3-dimensional Fourier transforms in IMAGR, the basic AIPS deconvolution and imaging task. While imaging we used 25 planar facets arranged in a grid, each of which had cells. These facets were used to mitigate the effects of non-coplanar arrays that are present at low frequencies and with wide fields (Cornwell & Perley 1992; Perley 1999). Finally, we re-assembled the facets and flattened them into a single planar map using the task FLATN. The rms noise is , limited primarily by confusion due to unresolved emission in the Galactic plane and to sidelobes from the bright W49 complex. The final beam size is , comparable to that of the tapered 1.4-GHz images; see Figures 5 and 6.
3 Analysis & Discussion
3.1 Optical/IR
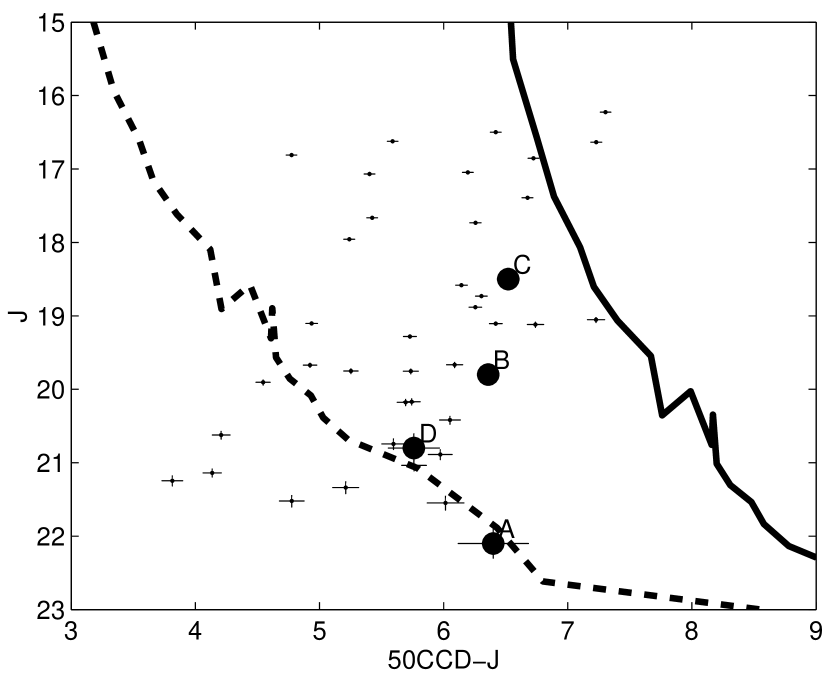
For the infrared and optical observations the astrometric uncertainty is . Combined with the uncertainty from Frail et al. (1999), this gives us a 99% confidence radius of . We examined all sources in or near a circle of this radius around the position of Frail et al. (1999). In the deepest observation, the -band image, we detect 7 sources that we label A–G on Figures 1 and 2 (only sources A–D are visible in Figure 1). Of these, C and D are significantly blended on all the images, as are sources C and G. Sources E, F, and G are too faint to measure on the STIS image, and sources E and F are too faint to measure on the -band image. Because of the degree of blending, we used a point-spread function (psf) fitting and subtraction technique to perform photometry on the infrared data, using the DAOPHOT package. First we measured the psf’s of a number () of stars in the field without close neighbors, and constructed an average psf for each image. We then fit this psf to each source in Figures 1 and 2, subtracted the fitted stellar profile from the images, and used the subtracted images to fit the sources that were hidden by the original source. After iterating this procedure, we were able to obtain consistent magnitudes for most of the sources. For the sources that we were able to fit, all had sizes consistent with unresolved sources. For the STIS data, we adjusted the measured magnitudes to a nominal infinite aperture with a mag correction, based on the observed STIS psf444http://www.stsci.edu/instruments/stis/documents/ihb/stis_cy11_ihb.pdf. We present the positions and magnitudes of sources A–G in Table 2.
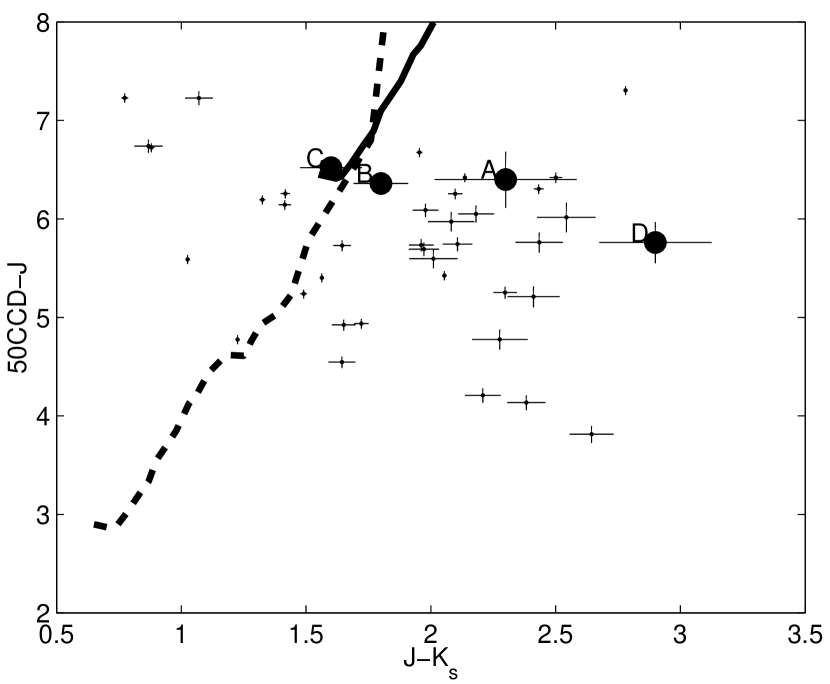
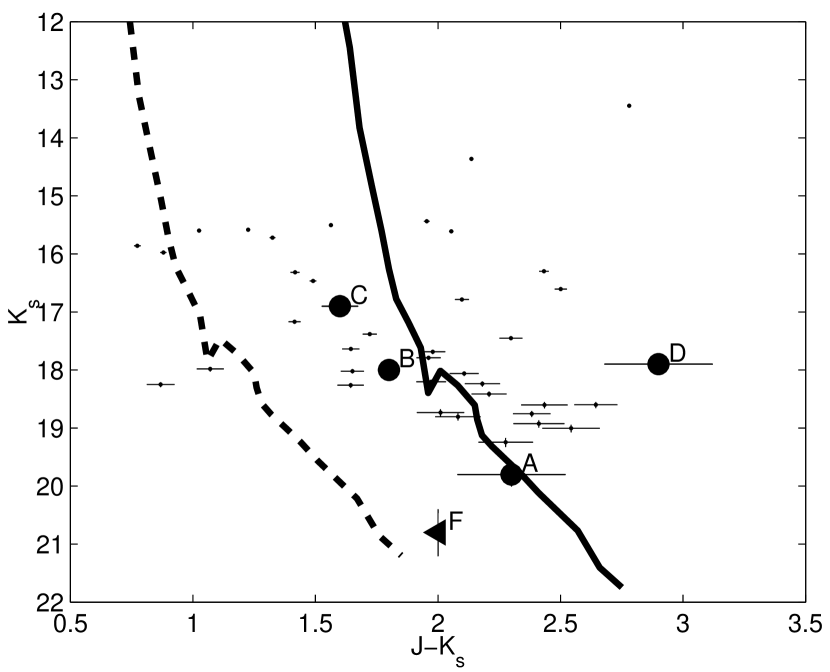
In Figure 7, we show a color-color diagram for the sources in Table 2 and 37 field stars for which we were able to perform reasonably accurate photometry in all bands. The sources from Table 2 all lie in the region populated by the other sources. In Figure 7 we also show model main-sequence colors (based on Cox 2000, p. 388) for –10 mag. These fit the majority of the points, with the exception of source D. However, since source D was blended with source C (making the IR photometry less reliable) and it is still in the region of the color-color diagram populated by other stars (some of whom were slightly blended themselves), we consider it unlikely that D has significantly non-stellar colors, and therefore is probably not a counterpart to SGR 190014 (both the disk models for AXPs [Perna, Hernquist, & Narayan 2000] and the optical/IR detection of an AXP [Hulleman, van Kerkwijk, & Kulkarni 2000] have non-stellar colors, and we expect something similar for SGRs). In Figure 8 we show color-magnitude diagrams for the sources in Table 2 and 37 field stars. Again, the sources populate the same region (although the field stars were chosen to be somewhat brighter than the faintest of the candidate sources), and are well bounded by model main sequences with kpc and –10 mag. Source D, in particular, has slightly strange colors (also as seen in Figure 7) but its magnitudes are well within the range of the main sequence. Main sequences with –15 kpc and mag, such as those plotted in Vrba et al. (2000), are too faint and too red to match these sources. Therefore the sources in Table 2 are likely to be in the foreground of the cluster found by Vrba et al. (2000).
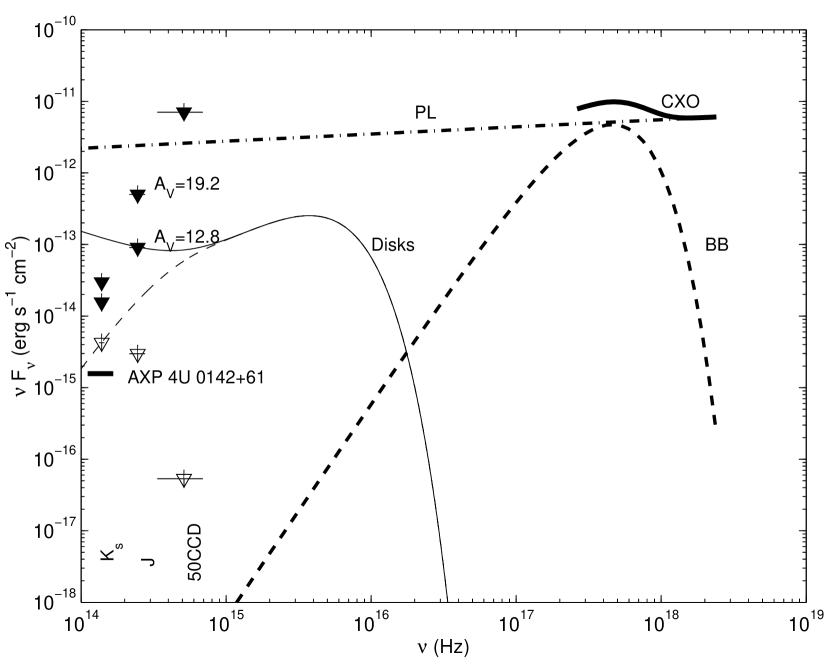
Source G in Figures 1 and 2 and in Table 2 is too faint for accurate photometry given its proximity to other sources. It could be a counterpart of SGR 190014, and we require additional deep, high-resolution infrared imaging to settle this issue. Regardless, it is near our detection limit, so we can place general upper limits to the emission from SGR 190014 of mag, mag, and mag, consistent with previously published limits (Eikenberry & Dror 2000; Vrba et al. 2000). We show these limits along with the CXO X-ray spectrum (Fox et al. 2001) in Figure 9. These limits translate into unabsorbed (“U”) X-ray-to-infrared flux ratios and (assuming mag). This last limit is only a factor of less than the detected X-ray-to- limit found for the AXP 4U 014261 (F. Hulleman 2001, personal communication; see Figure 9) and thus we can exclude the basic disk model for AXP/SGR emission (Perna et al. 2000; see also Kaplan et al. 2001). If a disk does exist, then it must be truncated at cm. As seen for SGR 052666 (Kaplan et al. 2001), the optical/IR limits require that the X-ray power-law break between the X-ray and the optical bands, but allow for a continuation of the X-ray blackbody.
We were able to detect but not photometer many luminous members of the massive star cluster that Vrba et al. (2000) proposed as the origin of SGR 190014, as we only had a small number of exposures where the central M giant stars were unsaturated. In the remaining exposures these stars were too saturated to allow good psf subtraction, and their scattered light, bleed trails, and readout trails prevent accurate measurement of the stars in the cluster.
3.2 Radio
We do not detect either SGR 190014 or PSR J19070918 in the radio images. We therefore have 3- limits on point source emission of 6 mJy (332 MHz) and 1.5 mJy (1.4 GHz). We also have 3- limits on extended emission of (332 MHz) and (1.4 GHz).
We were able to detect SNRs G042.800.6, G043.300.2, G041.100.3, and possibly G043.901.6 at 332 MHz (Figure 5). However, G041.100.3, G043.300.2, and G043.901.6 are too attenuated by the primary beam of the VLA antennas for the flux measurements to be useful. For G042.800.6, we measure Jy, excluding the contributions of point sources (see Figure 6), but we are likely missing some flux on the shortest baselines so this flux may be underestimated by 5%–10%.
3.2.1 Serendipitous Sources
The 332-MHz image (Figure 5) shows three sources besides the known SNRs that have shell-like morphologies but are in neither the current version of the Galactic SNR catalog (Green 2000) nor any online database. We consider these sources to be candidate SNRs, but with only limited data at other wavelengths we are unable to confirm an SNR classification for any of the three. The sources could be H II regions or other similar sources and require additional confirmation. Here we present what limited information we have on each.
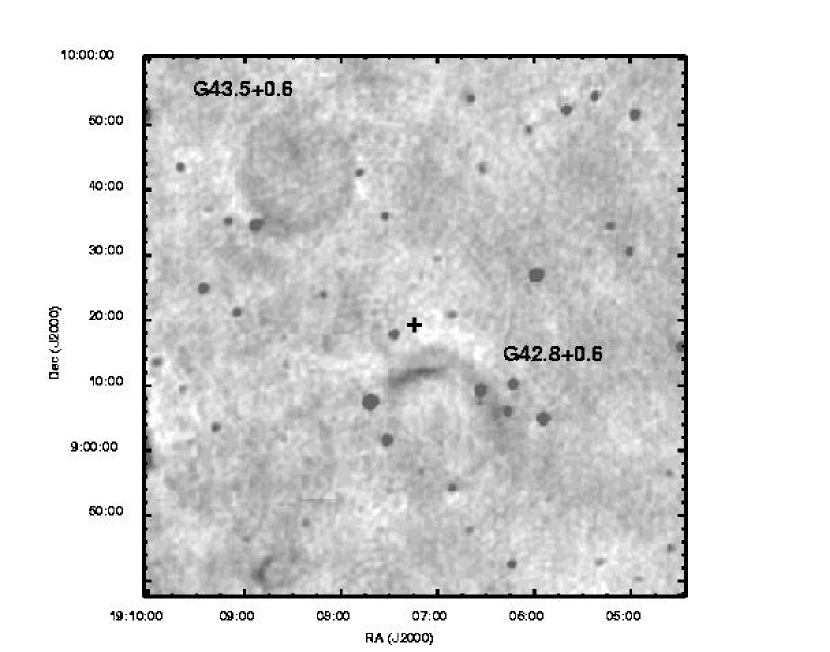
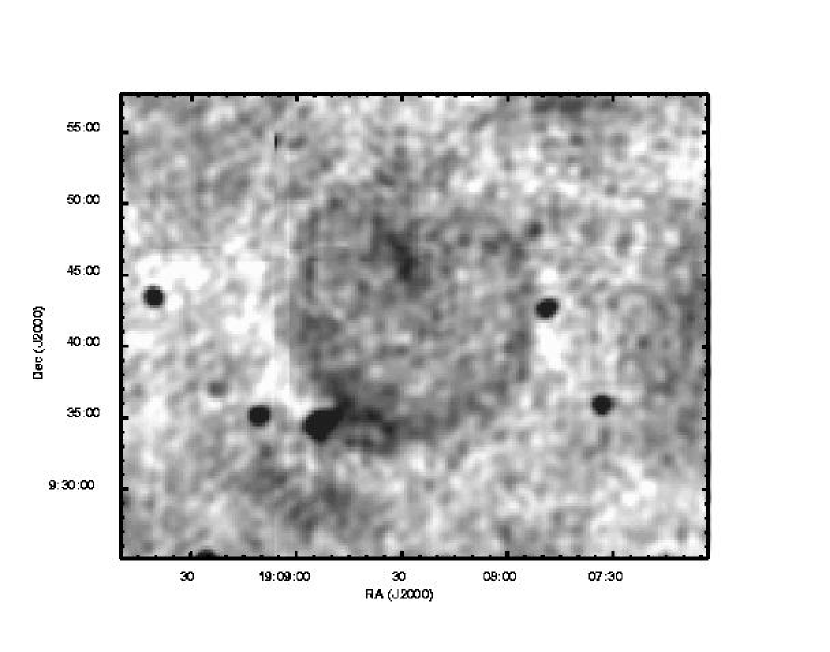
The first source is G043.500.6 (see Figure 10). Its center is at position , . It is circular, with radius . The total flux at 332 MHz is Jy (excluding the point source to the south-east), with an average surface brightness of . The edge appears to be brighter, with typical surface brightness of 6–8, while the interior is more typically 1–3.
Without a measurement at another frequency, it is hard to determine the properties of G043.500.6. We were not able to find any archival X-ray or radio data at this position that could definitively classify G043.500.6. However, there is a marginal detection in the 1.4-GHz NRAO VLA Sky Survey (NVSS; Condon et al. 1998). The source is present in the NVSS with the same general morphology although it is too faint to accurately measure a flux. This faintness, though, suggests that G043.500.6 is not a thermal source, as it would have a NVSS flux of Jy and would then be easily detectable. There are two X-ray sources from the EXOSAT medium-energy slew survey catalog (Reynolds et al. 1999) that lie in or near G043.500.6: EXMS B1906+095 and EXMS B1906+094. Both sources had been associated with the X-ray binary 4U 1907+097, which is within their position uncertainties, but the positions of the EXOSAT sources are closer to G043.500.6 than to 4U 1907+097 (Schwartz et al. 1980). It is therefore conceivable that the EXOSAT sources are associated with regions of G043.500.6, but we require additional X-ray imaging to confirm this.
We can estimate the distance to G043.500.6 very roughly using the updated - relation (Case & Bhattacharya 1998). Assuming a spectral index , appropriate for many shell-type SNRs (e.g. Case & Bhattacharya 1998), we find , which implies a linear diameter pc and distance kpc. We note that these numbers are extremely imprecise (given both intrinsic uncertainties in the - relation and in estimates of the 1-GHz surface brightness) probably having errors approaching 100%. However, this value is consistent with G043.500.6 being near the tangent point of spiral arm 3 of the Taylor & Cordes (1993) electron density model.
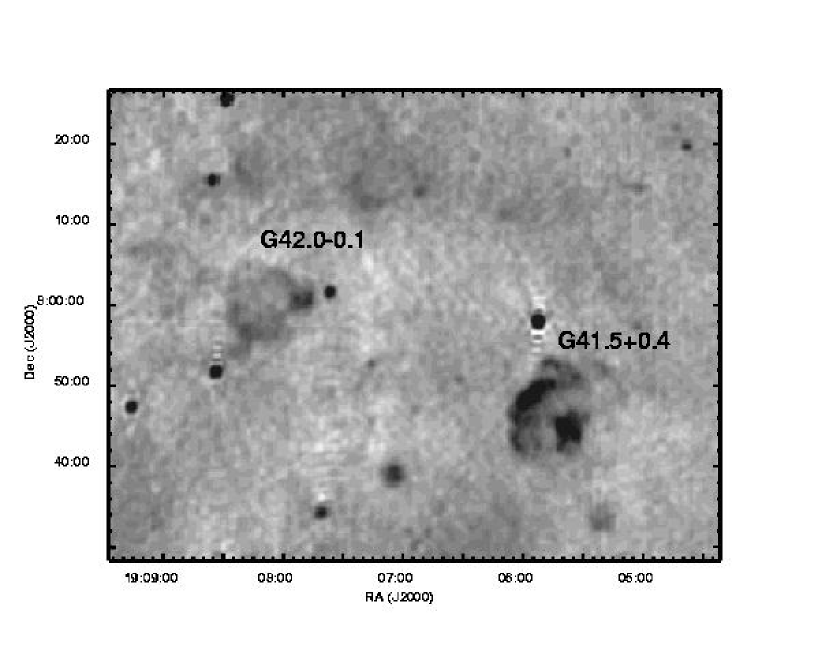
Also intriguing are the objects in Figure 5 marked G042.000.1 and G041.5+00.4 (see Figure 11). These objects have morphologies that are less well-determined than that of G043.500.6 and are further out in the VLA primary beam, so we cannot make very useful measurements, but their shapes are suggestive of either SNRs or H II regions. G042.000.1 is centered at , , is roughly circular with radius , and has a 332-MHz flux of Jy (this value has been corrected for the attenuation of the primary beam of the VLA antennas and is therefore highly uncertain). The protruding region to the south-east of G042.000.1 was identified as an H II region on the basis of radio recombination lines by Lockman, Pisano, & Howard (1996), but their data do not mention the rest of the complex and their angular resolution should be able to distinguish between the center of G042.000.1 and the smaller region. G042.000.1 is present in the NVSS with similar morphology to the 332-MHz image and flux Jy, suggesting a non-thermal spectrum and leading to a provisional classification as an SNR.
G041.5+00.4 is centered at , . It has a complicated morphology, with a brightened rim to the north-east and a compact core to the south-west (, ), suggestive of a pulsar wind nebula. The source has an overall radius of and a 332-MHz flux of Jy (again, this is a highly uncertain value). Comparison of the overall 332-MHz flux with the NVSS flux of Jy leads to a flat spectrum like that of core-dominated SNR or an H II region. We need more data to conclusively classify all three of these objects; further analysis and observations are in progress.
The wealth of information available in Figure 5, concerning both already known objects and newly discovered ones, is readily apparent. It serves to illustrate how productive low-frequency wide-field imaging of the Galactic plane with high resolution can be (e.g. LaRosa et al. 2000).
References
- Bessell et al. (1998) Bessell, M. S., Castelli, F., & Plez, B. 1998, A&A, 333, 231
- Case & Bhattacharya (1998) Case, G. L. & Bhattacharya, D. 1998, ApJ, 504, 761
- Chatterjee et al. (2000) Chatterjee, P., Hernquist, L., & Narayan, R. 2000, ApJ, 534, 373
- Condon et al. (1998) Condon, J. J., Cotton, W. D., Greisen, E. W., Yin, Q. F., Perley, R. A., Taylor, G. B., & Broderick, J. J. 1998, AJ, 115, 1693
- Cornwell & Perley (1992) Cornwell, T. J. & Perley, R. A. 1992, A&A, 261, 353
- Cox (2000) Cox, A. N. 2000, Allen’s astrophysical quantities, 4th edn. (AIP Press/Springer: New York)
- Deutsch (1999) Deutsch, E. W. 1999, AJ, 118, 1882
- Duncan (2001) Duncan, R. C. 2001, in Proceedings of Rome Mini-Workshop on SGRs, ed. M. Feroci & S. Mereghetti, (astro-ph/0106041)
- Duncan & Thompson (1992) Duncan, R. C. & Thompson, C. 1992, ApJ, 392, L9
- Eikenberry & Dror (2000) Eikenberry, S. S. & Dror, D. H. 2000, ApJ, 537, 429
- Eikenberry et al. (2001) Eikenberry, S. S., Garske, M., Hu, D., Jackson, M. A., Patel, S. G., Barry, D. J., Colonno, M., & Houck, J. R. 2001, IAU Circ., 7682, 2
- Evans et al. (1980) Evans, W. D., Klebesadel, R. W., Laros, J. G., Cline, T. L., Desai, U. D., Teegarden, B. J., Pizzichini, G., Hurley, K., Niel, M., & Vedrenne, G. 1980, ApJ, 237, L7
- Fox et al. (2001) Fox, D. W., Kaplan, D. L., Kulkarni, S. R., & Frail, D. A. 2001, ApJ, submitted, (astro-ph/0107520)
- Frail et al. (1999) Frail, D. A., Kulkarni, S. R., & Bloom, J. S. 1999, Nature, 398, 127
- Fruchter & Mutchler (1998) Fruchter, A. & Mutchler, M. 1998, Space Telescope Science Institute Memo, 28 July
- Fuchs et al. (1999) Fuchs, Y., Mirabel, F., Chaty, S., Claret, A., Cesarsky, C. J., & Cesarsky, D. A. 1999, A&A, 350, 891
- Gaensler et al. (2001) Gaensler, B. M., Slane, P. O., Gotthelf, E. V., & Vasisht, G. 2001, ApJ, accepted, (astro-ph/0104228)
- Green (2000) Green, D. A. 2000, A Catalogue of Galactic Supernova Remnants (2000 August version), Mullard Radio Astronomy Observatory, Cavendish Laboratory, Cambridge, UK, (available on the World-Wide-Web at http://www.mrao.cam.ac.uk/surveys/snrs/)
- Hulleman et al. (2000) Hulleman, F., van Kerkwijk, M. H., & Kulkarni, S. R. 2000, Nature, 408, 689
- Hurley (2000) Hurley, K. 2000, in Gamma-Ray Bursts: 5th Huntsville Symposium, ed. R. M. Kippen, R. S. Mallozi, & G. J. Fishman, 763, (astro-ph/9912061)
- Hurley et al. (1999a) Hurley, K., Cline, T., Mazets, E., Barthelmy, S., Butterworth, P., Marshall, F., Palmer, D., Aptekar, R., Golenetskii, S., Il’Inskii, V., Frederiks, D., McTiernan, J., Gold, R., & Trombka, J. 1999a, Nature, 397, 41
- Hurley et al. (1999b) Hurley, K., Kouveliotou, C., Cline, T., Mazets, E., Golenetskii, S., Frederiks, D. D., & van Paradijs, J. 1999b, ApJ, 523, L37
- Hurley et al. (1999c) Hurley, K., Kouveliotou, C., Woods, P., Cline, T., Butterworth, P., Mazets, E., Golenetskii, S., & Frederics, D. 1999c, ApJ, 510, L107
- Hurley et al. (1999d) Hurley, K., Li, P., Kouveliotou, C., Murakami, T., Ando, M., Strohmayer, T., van Paradijs, J., Vrba, F., Luginbuhl, C., Yoshida, A., & Smith, I. 1999d, ApJ, 510, L111
- Hurley et al. (1996) Hurley, K., Li, P., Vrba, F., Luginbuhl, C., Hartmann, D., Kouveliotou, C., Meegan, C., Fishman, G., Kulkarni, S., Frail, D., Bowyer, S., & Lampton, M. 1996, ApJ, 463, L13
- Kaplan et al. (2002) Kaplan, D. L., Fox, D. W., Kulkarni, S. R., Gotthelf, E. V., Vasisht, G., & Frail, D. A. 2002, ApJ, in press
- Kaplan et al. (2001) Kaplan, D. L., Kulkarni, S. R., van Kerkwijk, M. H., Rothschild, R. E., Lingenfelter, R. L., Marsden, D., Danner, R., & Murakami, T. 2001, ApJ, 556, 399
- Kouveliotou et al. (1998) Kouveliotou, C., Dieters, S., Strohmayer, T., van Paradijs, J., Fishman, G. J., Meegan, C. A., Hurley, K., Kommers, J., Smith, I., Frail, D., & Murakami, T. 1998, Nature, 393, 235
- Kouveliotou et al. (1993) Kouveliotou, C., Fishman, G. J., Meegan, C. A., Paciesas, W. S., Wilson, R. B., van Paradijs, J., Preece, R. D., Briggs, M. S., Pendleton, G. N., & Brock, M. N. 1993, Nature, 362, 728
- Kouveliotou et al. (1999) Kouveliotou, C., Strohmayer, T., Hurley, K., van Paradijs, J., Finger, M. H., Dieters, S., Woods, P., Thompson, C., & Duncan, R. C. 1999, ApJ, 510, L115
- Kouveliotou et al. (2001) Kouveliotou, C., Tennant, A., Woods, P. M., Weisskopf, M. C., Hurley, K., Fender, R. P., Garrington, S. T., Patel, S. K., & Göğüş, E. 2001, ApJ, 558, L47
- Kulkarni & Frail (1993) Kulkarni, S. R. & Frail, D. A. 1993, Nature, 365, 33
- LaRosa et al. (2000) LaRosa, T. N., Kassim, N. E., Lazio, T. J. W., & Hyman, S. D. 2000, AJ, 119, 207
- Lockman et al. (1996) Lockman, F. J., Pisano, D. J., & Howard, G. J. 1996, ApJ, 472, 173
- Lorimer & Xilouris (2000) Lorimer, D. R. & Xilouris, K. M. 2000, ApJ, 545, 385
- Marsden et al. (2000) Marsden, D., Lingenfelter, R., Rothschild, R., & Higdon, J. 2000, in Gamma-Ray Bursts: 5th Huntsville Symposium, ed. R. M. Kippen, R. S. Mallozi, & G. J. Fishman, 847, (astro-ph/9912315)
- Marsden et al. (2001) Marsden, D., Lingenfelter, R. E., Rothschild, R. E., & Higdon, J. C. 2001, ApJ, 550, 397
- Matthews & Soifer (1994) Matthews, K. & Soifer, B. T. 1994, in Infrared Astronomy with Arrays, The Next Generation, ed. I. S. McLean (Dordrecht: Kluwer Academic Publisher), 239
- Mazets et al. (1979) Mazets, E. P., Golenetskij, S. V., & Guryan, Y. A. 1979, Soviet Astronomy Letters, 5, 343+
- Mereghetti (2000) Mereghetti, S. 2000, in The Neutron Star - Black Hole Connection, ed. V. Connaughton, C. Kouveliotou, J. van Paradijs, & J. Ventura (NATO Advanced Study Institute), (astro-ph/9911252)
- Monet (1998) Monet, D. E. A. 1998, in The PMM USNO-A2.0 Catalog (U.S. Naval Observatory, Washington DC)
- Oke et al. (1995) Oke, J. B., Cohen, J. G., Carr, M., Cromer, J., Dingizian, A., Harris, F. H., Labrecque, S., Lucinio, R., Schaal, W., Epps, H., & Miller, J. 1995, PASP, 107, 375
- Paczyński (1992) Paczyński, B. 1992, Acta Astronomica, 42, 145
- Perley (1999) Perley, R. 1999, in ASP Conf. Ser. 180: Synthesis Imaging in Radio Astronomy II, ed. G. B. Taylor, C. L. Carilli, & R. A. Perley
- Perna et al. (2000) Perna, R., Hernquist, L., & Narayan, R. 2000, ApJ, 541, 344
- Persson et al. (1998) Persson, S. E., Murphy, D. C., Krzeminski, W., Roth, M., & Rieke, M. J. 1998, AJ, 116, 2475
- Predehl & Schmitt (1995) Predehl, P. & Schmitt, J. H. M. M. 1995, A&A, 293, 889
- Reynolds et al. (1999) Reynolds, A. P., Parmar, A. N., Hakala, P. J., Pollock, A. M. T., Williams, O. R., Peacock, A., & Taylor, B. G. 1999, A&AS, 134, 287
- Schwartz et al. (1980) Schwartz, D. A., Griffiths, R. E., Bowyer, S., Thorstensen, J. R., & Charles, P. A. 1980, AJ, 85, 549
- Taylor & Cordes (1993) Taylor, J. H. & Cordes, J. M. 1993, ApJ, 411, 674
- Thompson & Duncan (1993) Thompson, C. & Duncan, R. C. 1993, ApJ, 408, 194
- Thompson & Duncan (1995) —. 1995, MNRAS, 275, 255
- van Paradijs et al. (1995) van Paradijs, J., Taam, R. E., & van den Heuvel, E. P. J. 1995, A&A, 299, L41
- Vasisht et al. (1994) Vasisht, G., Kulkarni, S. R., Frail, D. A., & Greiner, J. 1994, ApJ, 431, L35
- Vrba et al. (2000) Vrba, F. J., Henden, A. A., Luginbuhl, C. B., Guetter, H. H., Hartmann, D. H., & Klose, S. 2000, ApJ, 533, L17
- Vrba et al. (1996) Vrba, F. J., Luginbuhl, C. B., Hurley, K. C., Li, P., Kulkarni, S. R., van Kerkwijk, M. H., Hartmann, D. H., Campusano, L. E., Graham, M. J., Clowes, R. G., Kouveliotou, C., Probst, R., Gatley, I., Merrill, M., Joyce, R., Mendez, R., Smith, I., & Schultz, A. 1996, ApJ, 468, 225
| Date | Telescope / | Band | Exposure | Comments | |
|---|---|---|---|---|---|
| Instrument | (min) | ||||
| 1998 Sep 05 | Keck I/NIRC | 2.15 | 49.7 | seeing | |
| 1.25 | 22.5 | ||||
| 1998 Nov 18 | VLA | L | 20 cm | 76 | D-config. |
| 1998 Dec 26 | VLA | P | 90 cm | 441.5 | C-config., 32 channels |
| 1999 Apr 26 | VLA | L | 20 cm | 116 | C-config. |
| 2000 Apr 12 | HST/STIS | 50CCD | 0.585 | 86.6 |