The Contribution of HI-rich Galaxies to the Damped Absorber Population at
Abstract
We present a study of HI-rich galaxies in the local universe selected from blind emission-line surveys. These galaxies represent the emission-line counterparts of local damped Lyman- systems. We find that the HI cross-section of galaxies is drawn from a large range of galaxy masses below M, 66% of the area comes from galaxies in the range 8.5 Log M 9.7. Both because of the low mass galaxy contribution, and because of the range of galaxy types and luminosities at any given HI mass, the galaxies contributing to the HI cross-section are not exclusively L∗ spirals, as is often expected. The optical and near infrared counterparts of these galaxies cover a range of types (from spirals to irregulars), luminosities (from L∗ to 0.01 L∗), and surface brightnesses. The range of optical and near infrared properties as well as the kinematics for this population are consistent with the properties for the low- damped Ly- absorbers. We also show that the number of HI-rich galaxies in the local universe does not preclude evolution of the low- damped absorber population, but it is consistent with no evolution.
Center for Astrophysics & Space Astronomy, Department of Astrophysical and Planetary Sciences, University of Colorado, Boulder, CO 80309
Department of Astronomy, University of Massachusetts, Amherst, MA 01003
1. INTRODUCTION
The damped Lyman- absorption-line systems (DLAs), absorbers with N cm-2, are often assumed to be the disks of large spiral galaxies or their progenitors. There are not many of these systems known at low-: only 9 DLAs are know with (Rao & Turnshek 2000, Bowen et al. 2001, Steidel et al. 1994, Lanzetta et al. 1997, and Le Brun et al. 1997), and only 2 of those are at where detailed observations are possible. Absorption line studies do not provide adequate statistical samples because their pencil beams survey only small volumes of space.
Low- DLAs have provided a few surprises. In particular, many of the optical counterparts are dwarf or low surface brightness galaxies rather than bright spirals. The optical characteristics, as well as the metallicities of DLAs have lead to speculation that the absorption line population is biased against detecting the expected population of bright spiral galaxies. However, an unbiased low redshift sample has never been constructed for study, which may account for some of the surprising characteristics. We make use of blind 21 cm surveys to construct a low redshift sample unbiased by a galaxy’s optical properties and use it to determine what we expect to find in the absorber population.
What constraints does the number density of HI-rich galaxies in the local universe place on the low redshift evolution of DLAs (§3.4)? Are the kinematic properties of these =0 absorbers consistent with those of the high- population (§3.5)? What are the optical properties of these =0 galaxies and are they consistent with the properties found for nearby absorbers (§3.6)?
2. THE DATA
For this study, we use the Arecibo Dual-Beam Survey (ADBS, Rosenberg & Schneider 2000), a 21 cm survey that covered 430 deg2 in the Arecibo main beam. The velocity coverage of the survey was –654 to 7977 km s-1 with an average sensitivity of 3.5 mJy. The ADBS identified 265 galaxies, only a third of which had previously identified optical counterparts.The problem with comparing emission and absorption line studies are the differences in spatial resolution (0.25′′-1′′ for absorption and 40′′ for VLA D-array studies).
All of the ADBS sources were followed-up at Arecibo or the VLA. We use the 99 VLA D-array maps to investigate HI size of HI-rich galaxies. The covering area of is determined in an isophote at a column density of 2 1020 cm-2. Because of the low resolution of these data, we have used isophotal fits rather than pixel-by-pixel measurements. However, the galaxies that were mapped were selected to be the lowest mass sources in order to constrain the low mass end of the HI mass function. To fill in the sizes of high HI mass sources, we use information available in the literature (Martin 1998). These data include a compilation of galaxy sizes at given column densities. We restrict the use of these galaxies to the source for which there is a VLA, Westerbork, or ATCA measurement at Log or for which the ratio of the standard deviation to the HI size at Log is less than 5%.
In addition to comparing the gaseous properties of the samples, we compare the stellar properties of HI-rich galaxies to those of the low redshift DLAs that have been found. To examine the stellar properties of the galaxies, we use the 2 Micron All-Sky Survey (2MASS, Jarrett et al. 2000). 2MASS used 2 identical 1.3m telescopes in Tucson and Chile which provide simultaneous J, H, and Ks observations. The observing time per point is only 7.8 seconds, so this survey is not ideal for finding faint and low surface brightness galaxies, but it provides a near infrared measurement for the brighter galaxies in our sample.
3. RESULTS
3.1. The HI Mass Function
To probe the distribution of properties of HI-rich galaxies in the local universe, we must determine the number density (the HI mass function) of these galaxies. Knowing the number density of HI-rich galaxies locally, we can compare their properties to those of DLAs.

The derivation of the HI mass function depends on a careful assessment of the HI sensitivity function for the survey. A complete description of the HI mass function derivation for the ADBS can be found in Rosenberg & Schneider (2001). Figure 1 shows the ADBS HI mass function. We have fit a Schechter function to the results and find the faint-end slope of = -1.5, the knee of the curve is at Log(M∗ /M⊙) = 9.88, and the normalization is = 0.0058 Mpc-3. Our result indicate that the population of small HI-rich galaxies is larger than the number of faint galaxies found in optical luminosity function studies.
3.2. Galaxy Sizes at 21 cm

Figure 2 shows the relationship between de-projected HI area and HI mass. Giovanelli & Haynes (1983) found that the relationship between HI mass and optical size could be used as a measure of HI deficiency in galaxies because it was generally consistent among undisturbed galaxies. The correlation between HI mass and HI size, tighter than for optical size, indicates a narrow range of average HI column densities. The outlying galaxies in Figure 2 show indications of being disturbed by interactions. For this study we scale the area by 0.64, the average projection factor for the sample.
The low resolution of the data and the use of global galaxy relations to derive galaxy size relationships ignores the small scale properties of these galaxies. If the surface filling factor of high column density HI (N cm-2) is small, we have overestimated the size of the damped region for each of these galaxies. It is useful to note, however, that there can also be regions of damped emission beyond our measured HI isophote which will contribute to a larger HI covering area.
Detailed studies of the HI covering fraction have been done in very few galaxies to date and have shown disparities in the covering fractions derived for different galaxies. Braun & Walterbos (1992) find that the HI volume filling fraction in the Galaxy is 16% while it is 38% in M31. However, the surface filling fraction, the important value here, approaches 1 where the emission brightness temperature exceeds 5 K (equivalent to a column density of 2 cm-2 for an asymptotic temperature T K and a velocity width of 21.5 km s-1). These numbers imply that the correction for the covering fraction in these galaxies should be relatively small.
3.3. Galaxy Covering Fraction
The relationship between HI mass and HI size, discussed in the previous section, can be used the relationship to calculate the number of damped systems per unit redshift as a function of HI mass. This function is the multiplication of the HI mass function and the HI mass versus HI size relationship and is given by:
| (1) |
where is the number density of galaxies in the mass bin as given by the HI mass function and is the average covering area in the mass bin. We use H0 = 75 km s-1Mpc-3 throughout, but note that dN/dz is independent of H0.

Figure 3 shows the resulting dN/dz versus HI mass function. This figure shows that 66% of the area comes from galaxies in the range 8.5 Log M 9.7. The highest mass galaxies (Log M 10.26) contribute 13% of the area while the lowest mass galaxies (Log M 8.5) contribute 21%. The cross-section of galaxies is not dominated by the highest HI-mass galaxies, but is instead a contribution from a range of galaxy masses below M.
3.4. Limits on the DLA Population in the Local Universe
Whether the DLA population evolves at low- remains difficult to answer because of the poor statistics. The work of Rao & Turnshek (2000) used HI 21 cm Arecibo data from Rao et al. (1995) on 30 bright spiral galaxies to calculate dN/dz for damped systems in the local universe. Although the errors are large, the data indicate that there has been strong evolution between =2.0 and =0.5. However, the survey of large, bright spiral galaxies may not be representative of the HI-rich galaxy population. Figure 4 shows the same plot with the Rao et al. (1995) bright spirals (open circle) and the ADBS dN/dz value (filled circle). Note that both points suffer from measuring the gas in a large beam, although the resolution is significantly better for the ADBS survey data.

Figure 4 shows dN/dz of the DLA population as a function of redshift. The triangles are from Wolfe et al. (WLFC95; 1995), the squares are from Rao & Turnshek (RT00; 2000), the open circle is the points from the Rao et al. bright spiral galaxies (RTB95; 1995), and the filled circle is the point determined from the ADBS data in this work. The ADBS data is consistent with the q no evolution model shown by the solid line in this figure. The dashed line shows the = 1.5 fit from Rao & Turnshek (2000). The large error bars on these data and the uncertainty in the HI covering fraction means that evolution of the DLA population at low- can not be ruled out. However, the known population of HI-rich galaxies is consistent with no evolution of the absorbers.
3.5. Line Width Distribution
Prochaska and Wolfe have analyzed the kinematics of 35 DLAs and used them to constrain models of the origin of these sytems (Prochaska & Wolfe 1997; Prochaska & Wolfe 1998; Wolfe & Prochaska 2000). They assume that the galaxy population is homogenous and therefore require massive spiral galaxies to account for the largest observed linewidth sources in their sample. Additionally, they find that a population of spherical systems, kinematically similar to dwarf galaxies/protogalaxies, can be ruled out as the origin of the kinematics at greater than 99.9% confidence.
Figure 5 shows the percentage of the DLA sample (open histogram) and of the ADBS sample (shaded histogram) with a given line width. The error bars reflect the Poisson statistics in each bin. There are a total of 26 galaxies in the DLA sample and 265 in the ADBS. The ADBS data show that the population which dominates the HI cross-section is kinematically consistent with the DLAs. There is a deficit of small line width sources in the ADBS data relative to the DLA data. There are several possible explanations of this deficit: (1) the absorption line studies are biased towards lower line widths because, with their higher spatial resolution, they tend to sample a smaller portion of the rotation curve; (2) the DLA data has not been corrected for completeness so linewidth effects, such as the lower contrast between continuum and absorption-line for higher velocity width sources, may preferentially remove large line-width sources from the sample; (3) the most massive spiral systems may obscure the background AGN and therefore be missed in absorption, as has been discussed by other authors.

3.6. Optical and Near Infrared Properties of Absorber Population
Because L∗ galaxies dominate the light in the universe, and M galaxies dominate the HI mass, it was generally expected that the optical counterparts to the DLAs would be HI-rich L∗ galaxies - bright spirals. Instead, many of the low- DLAs are low luminosity and/or low surface brightness. Part of the explination for the stellar properties of the DLAs is that there is a large dispersion in the HI-mass optical luminosity correlation. Additionally, Figure 4 shows that there is a large range of masses below M∗ that contribute to the HI cross-section.
Figure 6 shows the relationship between HI mass and near infrared luminosity for 3 HI-selected galaxy samples: the ADBS (filled circles), the Arecibo Slice survey (Spitzak & Schneider 1998; triangles); and the AHISS survey (Zwaan et al. 1997; stars). The open triangles show the Arecibo Slice galaxies for which there were I-band data, but no J-band detection in 2MASS, so a color-corrected I-band luminosity was substituted. While there is a correlation between the the HI mass and the J-band luminosity, there is a spread of several orders of magnitude. This figure illustrates why we detect a large number of low luminosity systems in absorption line studies. The DLAs are mostly drawn from an HI-rich population which spans the range of luminosities from a few tenths L∗ to L∗. Note that many of the HI-survey sources are not in this figure because they were too low luminosity or too low surface brightness to be detected by 2MASS.

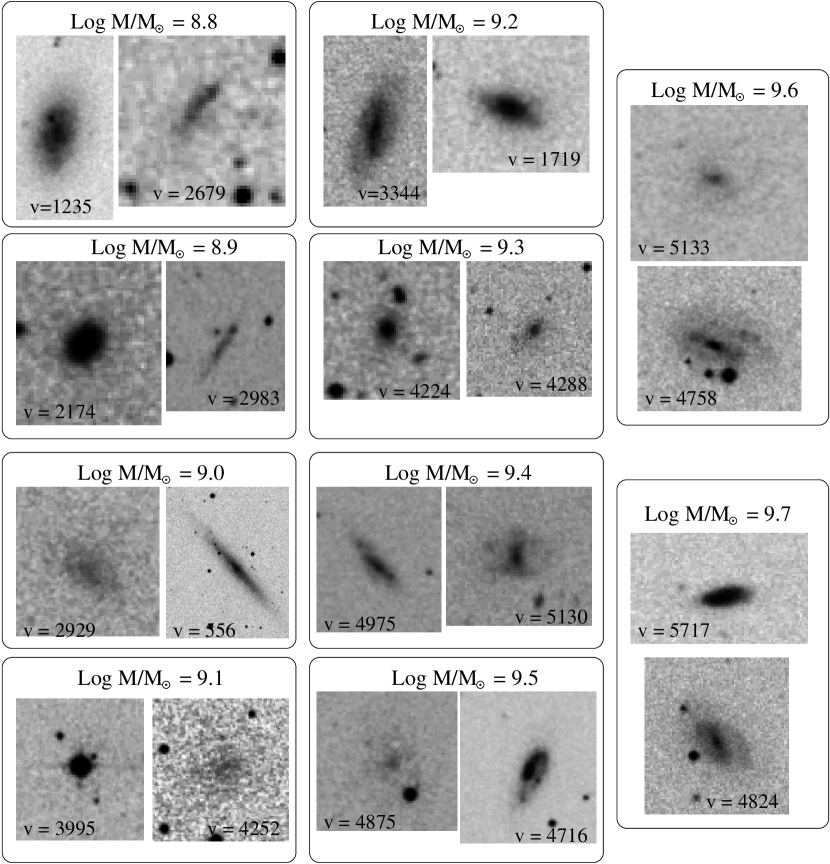
Figure 7 shows Digitized Sky Survey images for a random sample (just chosen such that there would be 2 at each dex) of ADBS galaxies with masses between Log(M) = 8.8 and 9.7. Note the large range of morphologies, luminosities, and surface brightnesses for this sample. In fact, there is very little correlation between these properties and the HI-mass of the galaxy. This figure illustrates that the HI cross-section should not be expected to be dominated by L∗ spirals. Many of the counterparts to DLAs should be low surface brightness and/or irregular galaxies so care must be taken when correlating the nearest bright spiral with a DLA at high redshift.
4. CONCLUSIONS
The number density of HI-rich galaxies at low- does not require evolution of the DLA population as indicated by Rao & Turnshek (2000). However, the large errorbars on the values of dN/dz at any given redshift, and the uncertainties in the HI covering fraction, make it impossible to rule out evolution of this population.
The optical and kinematic properties of HI-selected galaxies are consistent with those of DLAs. The surprising nature of the DLA population is, at least in part, the result of an improper comparison sample rather than a detection bias. There may still be some subtle biases in the DLA selection, but until more data are available for comparing these samples, it will remain uncertain.
The galaxies which dominate the HI cross-section span a large range of properties. They cover a large range in HI mass as well as optical luminosity, surface brightness, and morphology. As has been found for the low redshift DLAs, this is not a homogeneous population of bright spirals as might have been anticipated but is, instead, a very diverse galaxy population.
Acknowledgments.
J.L.R. would like to thank John Stocke for helpful discussions about this work. The Digitized Sky Surveys were produced at the Space Telescope Science Institute under U.S. Government grant NAG W-2166. The images of these surveys are based on photographic data obtained using the Oschin Schmidt Telescope on Palomar Mountain and the UK Schmidt Telescope. The plates were processed into the present compressed digital form with the permission of these institutions.
References
- 2001 Bowen, D. V., Tripp, T. M., & Jenkins, E. B. 2001, AJ, 121, 1456.
- 1989 Giovanelli, R. & Haynes, M. P. 1989, ApJ, 346, 5.
- 1989 Giovanelli, R. & Haynes, M. P. 1983, AJ, 88, 881.
- 2000 Jarrett, T. H., Chester, T., Cutri, R., Schneider, S., Skrutskie, M., Huchra, J. P. 2000, AJ, 119, 2498.
- 1997 Lanzetta, K. M., Wolfe, A. M., Altan, H., Barcons, X., Chen, H.-W., Fernandez-Soto, A., Meyer, D. M., Ortiz-Gil, A., Savaglio, S., Webb, J. K., & Yahata, N. 1997, AJ, 114, 1337.
- 1997 Le Brun, V., Bergeron, J., Boisse, P., & Deharveng, J. M. 1997, A & AS, 321, 733.
- Martin, M. C. 1998, A & AS, 131, 77.
- 1997 Prochaska, J. X. & Wolfe, A. M. 1997, ApJ, 487, 73.
- 1997 Prochaska, J. X. & Wolfe, A. M. 1998, ApJ, 507, 113.
- 1997 Wolfe, A. M. & Prochaska, J. X. 2000, ApJ, 545, 603.
- 2000 Rao, S. M. & Turnshek, D. A. 2000, ApJS, 130, 1.
- 2000 Rao, S. M., Turnshek, D. A., & Briggs, F. H. 1995, ApJ, 449, 488.
- 2000 Rosenberg, J. L. & Schneider, S. E. 2000, ApJ, 130, 177.
- 2001 Rosenberg, J. L. & Schneider, S. E. 2001, ApJ(submitted).
- 1998 Spitzak, J. G. & Schneider, S. E. 1998, ApJS, 119, 159.
- 1994 Steidel, C. C., Pettini, M., Dickinson, M., & Persson, S. E. 1994, AJ, 108, 2046.
- 1997 Zwaan, M. A., Briggs, F. H., Sprayberry, D., & Sorar, E. 1997, ApJ, 490, 173.