The Influence of the Starburst
on the ISM in NGC 1569
1 Introduction
The gas-rich dwarf irregular galaxy NGC 1569 (UGC 3056, Arp 210, VII Zw 16) is a member of the IC 342/Maffei galaxy group (Karachentsev et al. 1994) and lies near the galactic plane at a distance of about (Israel 1988). Its closest neighbor is UGCA 92 at a projected distance of about 40 kpc (). As can be expected of a dwarf galaxy, NGC 1569 is metal-poor (, González Delgado et al. 1997). There is much evidence that this galaxy currently is in a post-starburst phase (see next chapter). Therefore, it has been chosen as the target of a comprehensive study of the influence of a starburst on the ISM and the magnetic structure in a dwarf galaxy, which is the topic of S. Mühle’s Ph.D. thesis. Here we present our first results on the impact of the recent starburst on the neutral atomic and molecular gas.
2 Evidence for a Starburst
Among the most prominent features in NGC 1569 are two very luminous super-star clusters (e.g. O’Connell et al. 1994) that coincide with the centers of the distribution of the young stellar population. The star formation history as derived from photometric studies (e.g. Aloisi et al. 2001, Greggio et al. 1998, Vallenari & Bomans 1996) indicates a starburst, a phase with a very high star formation rate of (), from about 100 million years until about 4 million years ago, with no quiescent periods that lasted longer than about 10 million years. Before the starburst, the overall star formation rate must have been quite low, as the large HI reservoir and the low metallicity of NGC 1569 indicate.
Independent evidence for a recent starburst has been found in the rather strong synchrotron emission of NGC 1569. With a delay of about years, a starburst leads to an increased rate of supernova explosions, each of them injecting a large amount of relativistic electrons into the ISM. These high-energy particles rapidly lose energy due to radiation losses. At the end of a starburst, when the supernova rate decreases, the synchrotron spectrum ages, visible as a distinct kink in the slope of the spectrum. In NGC 1569, Israel & de Bruyn (1988) have found such a kink in the non-thermal continuum emission at 8 GHz, corresponding to an end of the starburst about 5 million years before now.
The ionized gas also reveals signs of strong recent star formation: expanding H shells (Tomita et al. 1994) have been detected in the disk of NGC 1569, and the H image by Hunter et al. (1993) shows numerous filaments along the minor axis extending into the halo. In ROSAT observations, extended soft X-ray emission () has been detected at the location of the super-star clusters (Heckman et al. 1995, Della Ceca et al. 1996). Comparing the pressure of this hot gas with the shallow gravitational potential, it becomes clear that this gas will most likely be blown away from the galaxy (Martin 1999).
3 The Impact on the Molecular Gas
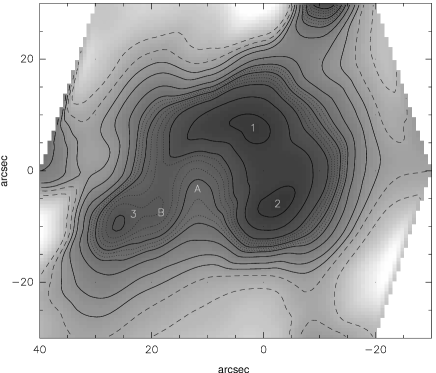
In the course of this study, we have mapped the CO(3–2) emission of NGC 1569 near the super-star clusters with the Heinrich-Hertz Telescope (Figure 1). The map shows not only three giant molecular associations (GMAs), but also much extended emission. The depression in the CO emission at the position of the super-star cluster A hints at a hole in the distribution of the molecular gas, but might as well be caused by dissociation of the CO molecules in the strong radiation field near the super-star cluster. The GMA #2 in our map coincides nicely with the giant molecular clouds (GMCs) #1 and 2 found by Taylor et al. (1999) in maps of the CO(2–1) and CO(1–0) transitions obtained with the Plateau de Bure interferometer. Our northern GMA (#1) can be associated with the GMCs #4 and 5. The GMAs #1 and 2 also coincide with the rim of a high-density HI ridge. A comparison of the fluxes of the interferometric data with the few available single-dish spectra (Greve et al. 1996) shows that a substantial fraction of the total emission is missing in these maps (Taylor et al. 1999). A first analysis of the single-dish data at a position between the GMAs #1 and 2 using our CO(3–2) map as well as the data by Greve et al. (1996) results in rather high line ratios
indicating an unusually warm molecular gas phase. An in-depth non-LTE analysis of the physical properties of the giant molecular clouds has to wait for new single-dish observations of the CO emission to be performed in March and April 2001.
4 The Impact on the Atomic Gas
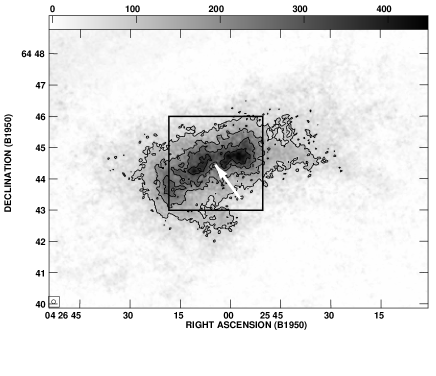
Dwarf galaxies with violent star formation usually have a complex HI distribution with a lot of holes and arcs (e.g. Walter & Brinks 1999). Surprisingly, the column density map of the high-resolution HI cube (Figure 2), that we have obtained from observations with the VLA B-, C- and D-arrays, shows a remarkably smooth distribution of the neutral gas, with only one prominent hole and two arm-like extensions in the west and in the south of the disk. Searching carefully for holes in the channel maps and position-velocity plots of this cube, we have found only two holes: The first hole is the one already detected in the HI column density map. Adopting the classification scheme of Brinks & Bajaja (1986), this is a type 1 hole with a diameter of about and an expansion velocity of about . It is associated with the two super-star clusters and an estimate of its kinematic age assuming a constant expansion velocity yields , supporting a causal connection between the starburst and the creation of this hole. The channel maps also show that the center of the hole is offset to the south of the position of the super-star clusters, suggesting different expansion velocities in the high-density HI ridge and in the thinner gas in the southern part of the disk. The other hole is classified as a type 2 hole and is located southeast of the first hole. With a diameter of about and an estimated expansion velocity of about , it is kinematically younger (). We label this hole a candidate hole, since it is located outside the optical extent of the disk and might be a chance feature formed by the rim of the dense HI distribution and the low-mass HI arm described in the next paragraph.
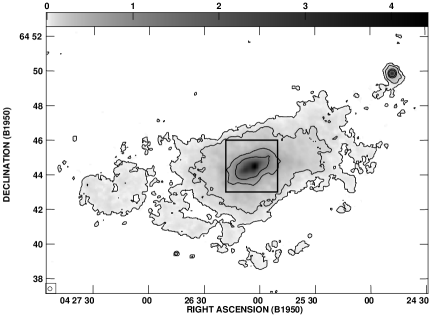
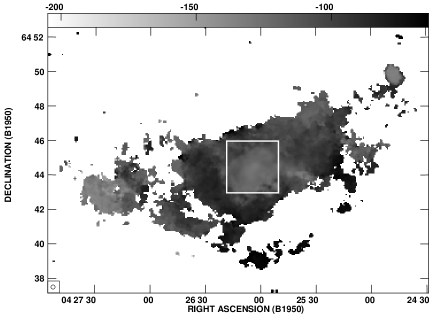
Trading the high-resolution of our cube for increased sensitivity in our low-resolution HI column density map (Figure 3), we have detected a low-mass HI cloud (“companion”) east of the HI distribution of NGC 1569 as well as an HI bridge connecting the cloud with the main HI disk. The measured column densities translate to mass estimates of for the companion and for the disk of NGC 1569. This is in good agreement with the findings of Stil & Israel (1998). As to the origin of the companion, that has no known optical counterpart (Stil & Israel 1998), and the associated bridge, we have investigated different possibilities: In the velocity field (Figure 4), we see a clear offset of the radial velocities of arm and companion from the velocity structure of the disk. Thus, it is very unlikely that these features form an outer part of the main HI distribution. The nearest neighbor to NGC 1569, UGCA 92 is a dwarf galaxy at a similar radial velocity, but less massive than NGC 1569. Comparing the gravitational force that NGC 1569 exerts on the companion with that of the far-away neighbor, we can discard the scenario that the companion and the bridge are tidal features pulled out of the disk of NGC 1569. Another hypothesis is that these features are part of an HI cloud falling into the disk of NGC 1569 and being tidally disrupted in this process. Since the potential energy of the companion is of the same order of magnitude as its kinetic energy, we consider this a possible explanation for the origin of the HI features southeast of the main disk of NGC 1569 and worth further investigation.
The sensitive low-resolution column density map and velocity field also reveal other interesting details: Apart from a radio continuum source northwest of NGC 1569, especially the velocity field clearly shows the remnants of a huge HI shell reaching from the center of the disk out into the halo in the southwest. The western arm detected in the high-resolution column density map seems to be part of this huge shell. The southern feature found in the same map may be interpreted as the continuation of the HI bridge.
5 Summary & Work in Progress
In the nearby dwarf galaxy NGC 1569, evidence for a recent strong
starburst has been found in the star formation history as well as in the
synchrotron spectrum and in the distribution of the ionized gas. We propose
that the starburst has had a strong impact on the neutral atomic and molecular
gas, too: The distribution of both the HI and the CO emission show a
depression at the location of the two super-star clusters. The surrounding
molecular gas seems to be unusually warm. In the HI column density map, we
have detected an extended feature that might be an infalling HI cloud, a
possible trigger for the starburst.
A next step will be the combination of our VLA
data with single-dish HI observations in order to get the complete picture of
the distribution of neutral hydrogen in NGC 1569. For a thorough non-LTE
investigation
of the physical properties of the giant molecular clouds near the super-star
clusters, we will map the starburst region in the CO(2–1) and CO(1–0)
transitions with a single-dish telescope and observe the 13CO(2–1) and
13CO(1–0) emission of selected areas. Another project that has just been
started in the context of this Ph.D. work is the determination of the
polarization, the magnetic structure and field strength in the halo of
NGC 1569. This will allow us to include the effect of a magnetic field in
the feedback processes of a starburst.
-
References
-
Aloisi, A., Clampin, M., Diolaiti, E., et al. 2001, AJ in press (March 2001)
-
Brinks, E., & Bajaja, E. 1986, A&A 169, 14
-
Della Ceca, R., Griffiths, R.E., Heckman, T.M., & Mac Kenty, J.W. 1996, ApJ 469, 662
-
González Delgado, R.M., Leitherer, C., Heckman, T., & Cerviño, M. 1997, ApJ 483, 705
-
Greggio, L., Tosi, M., Clampin, M., et al. 1998, ApJ 504, 725
-
Greve, A., Becker, R., Johansson, L.E.B., & Mc Keith, C.D. 1996, A&A 312, 391
-
Heckman, T.M., Dahlem, M., Lehnert, M.D., Fabbiano, G., Gilmore, D., & Waller, W.H. 1995, ApJ 448, 98
-
Hunter, D.A., Hawley, W.N., & Gallagher, J.S. 1993, AJ 106, 1797
-
Israel, F.P. 1988, A&A 194, 24
-
Israel, F.P., & de Bruyn, A.G. 1988, A&A 198, 109
-
Karachentsev, I.D., Tikhonov, N.A., & Sazonova, L.N. 1994, AstL 20, 84
-
Martin, C.L. 1999, ApJ 513, 156
-
O’Connell, R.W., Gallagher, J.S., & Hunter, D.A. 1994, ApJ 433, 65
-
Stil, J.M., & Israel, F.P. 1998, A&A 337, 64
-
Taylor, C.L., Hüttemeister, S., Klein, U., & Greve, A. 1999, A&A 349, 424
-
Tomita, A., Ohta, K., & Saito, M. 1994, PASJ 46, 335
-
Vallenari, A., & Bomans, D.J. 1996, A&A 313, 713
-
Walter, F., & Brinks, E. 1999, AJ 118, 273