Galactic Origin of the Alleged Extragalactic Gamma Background
Radiation
Arnon Dar
Technion, Israel Institute of Technology,
Haifa 32000, Israel
Abstract
The diffuse gamma-ray background radiation (GBR) at high Galactic latitudes could be dominated by inverse Compton scattering (ICS) of cosmic ray (CR) electrons on the cosmic microwave background radiation (CBR) and on starlight (SL) in an extended CR halo of our galaxy. Assuming the locally observed CR electron spectrum beyond a few GeV, which follows from equilibrium between Fermi acceleration and radiative cooling, to be a universal spectrum throughout our galaxy and its CR halo, we reproduce the observed spectral index, the intensity and the angular dependence of the GBR, in directions away from the galactic disk and centre, without recourse to hypothetical extragalactic sources.
1. The GBR: The existence of an isotropic, diffuse extragalactic gamma background radiation (GBR) was first suggested by data from the SAS 2 satellite (Thompson & Fichtel 1982) and claimed to be confirmed by the EGRET instrument on the Compton Gamma Ray Observatory (e.g. Sreekumar et al. 1998). The alleged extragalactic diffuse GBR is the diffuse emission observed by EGRET by masking the galactic plane at latitudes , as well as the galactic centre at for longitudes , and by extrapolating to zero column density, to eliminate the and bremsstrahlung contributions to the observed radiation and to tame the model-dependence of the results. Outside the mask, the GBR flux integrated over all directions in the observed energy range of MeV to , shown in Fig. 1, is well described by a power law:
| (1) |
The overall magnitude in Eq. (1) is sensitive to the model used to subtract the foreground (Sreekumar et al. 1998; Strong et al. 1998), but the spectral index is not. The EGRET data are given in Sreekumar et al. (1998) for 36 domains, 9 values for each half-hemisphere. The spectral index is, within errors, extremely directionally uniform, as shown in Fig. 2, where we have plotted the EGRET results as functions of , the observation angle relative to the direction to the galactic centre (). The normalization is less homogeneous, but in directions well above the galactic disk and away from the galactic-centre region it has been found to be consistent with a normal distribution around the mean value: thus the claim of a possible extragalactic origin (Sreekumar et al. 1998).
The origin of this diffuse GBR is still unknown. The published candidate sources range from the quite conventional to the decisively speculative. Perhaps the most conservative hypothesis is that the GBR is extragalactic, and originates from active galaxies (Bignami et al. 1979; Kazanas & Protheroe 1983; Stecker & Salamon 1996). The fact that blazars have a -ray spectrum with an average index , compatible with that of the GBR, supports this hypothesis (Chiang & Mukerjee 1998). The possibility has also been discussed that Geminga-type pulsars, expelled into the galactic halo by asymmetric supernova explosions, be abundant enough to explain the GBR (Dixon et al. 1998; Hartmann 1995). More exotic hypotheses include a baryon-symmetric universe (Stecker et al. 1971), now excluded (Cohen et al. 1998), primordial black hole evaporation (Page & Hawking 1976; Hawking 1977), supermassive black holes formed at very high redshift (Gnedin & Ostriker 1992), annihilation of weakly interactive big-bang remnants (Silk & Srednicki 1984; Rudaz & Stecker 1991), and a long etc.
The EGRET GBR data in directions above the galactic disk and centre show a significant deviation from isotropy, correlated with the structure of our galaxy and our position relative to its centre (Dar et al. 1999). In Fig. 4 we have plotted, as a function of , the EGRET GBR counting-rate above 100 MeV. This figure clearly shows, in three out of the four quarters of the celestial sphere, an increase of the counting rate towards the galactic centre. The “reduced” per degree of freedom for a constant flux is 2.6: very unsatisfactory. A best fit of the form yields , a very large amelioration (for higher polynomials in the higher-order coefficients are compatible with zero: the fit does not significantly improve). Note also that at angles with larger than its mean value (), 10 out of the 12 data points are above the average flux, while at angles with , 18 out of the 24 data points are below the average. The probability for a uniform distribution to produce this large or a larger fluctuation is . Even in directions pointing to the galactic disk and the galactic centre, EGRET data on -rays above 1 GeV show an excess over the expectation from galactic cosmic-ray production of ’s (Pohl & Esposito 1998). Electron bremsstrahlung in gas is not the source of the 1–30 MeV inner-Galaxy -rays observed by COMPTEL (Strong et al. 1997), since their galactic latitude distribution is broader than that of the gas. These findings also imply that inverse Compton scattering may be much more important than previously believed (Strong & Moskalenko 1998; Moskalenko and Strong, 2000; Dar et al. 1999).
Thus, it appears that the EGRET data advocates a local (as opposed to cosmological) origin for the GBR. Indications of a large galactic contribution to the GBR at large latitudes were independently found by Dixon et al. (1998) by means of a wavelet-based “non-parametric” approach that makes no reference to a particular model. Strong & Moskalenko (1998) and Moskalenko & Strong (2000) also found that the contribution of inverse Compton scattering of galactic cosmic ray electrons to the diffuse -ray background is presumably much larger than previously thought.
2. Galactic Origin of the GBR: In recent publications we went one step further (Dar et al. 1999; Dar & De Rj́ula 2000) and explored in detail the possibility that the diffuse gamma-ray background radiation at high galactic latitudes could be dominated by inverse Compton scattering of cosmic ray (CR) electrons on the cosmic microwave background radiation and on starlight from our own galaxy. We made three very simple assumptions: (1) The locally-measured electron spectrum, shown in Fig. 4, which is well fitted, from to TeV by,
| (2) |
is representative of its average form throughout the Galaxy and its extended CR halo. (2) Above a few GeV the acceleration of CR electrons is in equilibrium with their cooling by inverse Compton scattering (ICS) on starlight and on the microwave background radiation. (3) The GBR is produced by ICS of CR electrons on CBR and starlight photons in our Galaxy and in external galaxies.
Assumptions (1) and (2) allow us to derive directly, the GBR spectral index from the observed electron index: . It agrees with the GBR index as observed by EGRET, . This index is universal, independent of whether the ICS took place in our Galaxy or in external galaxies.
The two dominant contributions to the GBR within our model are inverse Compton scattering of Galactic CR-electrons off the cosmic background radiation and starlight. There is a small additive effect of ICS from sunlight. The contribution from external galaxies, is also sub-dominant. The ICS spectrum –a cumbersome convolution (Felten & Morrison 1966) of a CR power spectrum with a photon thermal distribution– can be approximated very simply (Dar & De Rújula 2000) by
| (3) |
where is the Thomson cross section, are the mean photon energies of starlight and of the CBR and are the effective CR electron column density resulting from the convolution of the space distribution of CR electrons with those of starlight and of the CBR in the direction (b,l). Simple analytical expressions for them are given in Dar & De Rújula (2000).
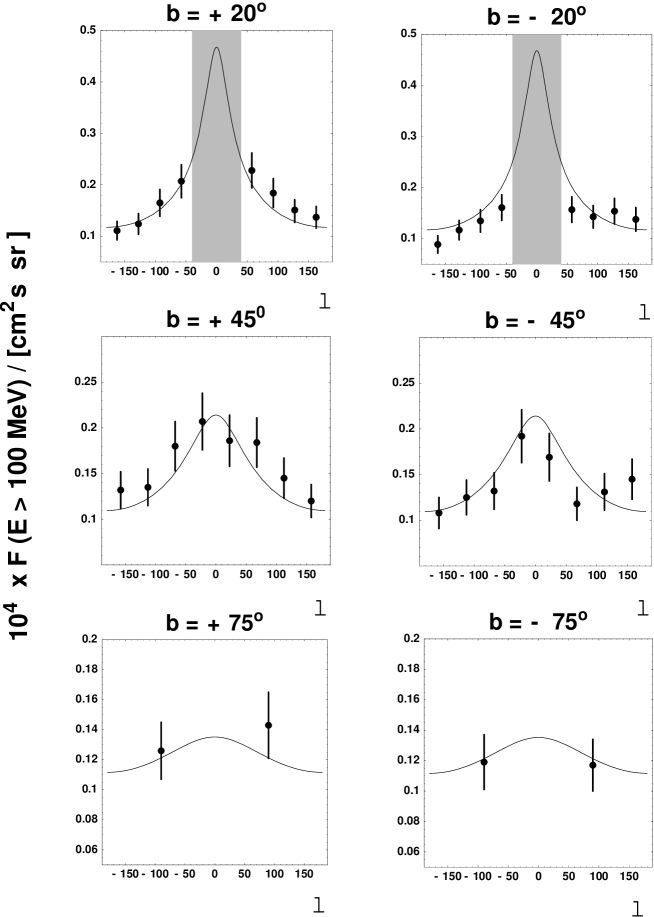
Our predictions of the intensity and the angular dependence of the GBR are shown in Figs. 5, 6. Like that for the spectral index, they are in excellent agreement with those observed for the alleged extragalactic GBR, leading to the conclusion that the GBR could be dominated by the emission from our own galaxy.
The only non-conventional aspect of our model is that, in order to reproduce the observed intensity of the GBR, we must assume the scale height of our galaxy’s CR-electron distribution to be almost twice the traditionally-accepted upper limit. Such a large scale height is not in contradiction with radio synchrotron-emission from our galaxy if the galactic disk and its magnetic field are embedded in a larger magnetic halo with a much weaker field.
3. Predictions: The main predictions specific to our scenario are:
(1) The GBR should reflect the
asymmetry of our off-centre position in the Galaxy.
(2) Very nearby star-burst Galaxies, such as M82,
and radio galaxies with presumably large CR production rates, such as
Cygnus A, may be visible in gamma rays.
(3) The GBR spectrum should not have the sharp cutoff,
above GeV,
expected (Salamon & Stecker 1998) for cosmological sources.
But it should nonetheless steepen around 10–100 GeV, because of
the anticipated “knee” in the electron spectrum and of the
energy-dependence of the Klein-Nishina cross section.
These features of our scenario should be testable when the next generation of cosmic-ray and -ray satellites (AMS-02 and GLAST) are operational, hopefully by 2005.
ACKNOWLEDGEMENTS
This talk is based on a research done in collaboration with A. De Rújula.
It was supported in part
by the Helen Asher Fund for Space Reseach and by the
V.P.R. Fund - Steiner Research Fund at the Technion.
REFERENCES
Barwick S. W. et al., 1998, ApJ, 498, 779
Bignami G. et al., 1979, ApJ, 232, 649
Cohen A., De Rújula A., Glashow S. L., 1998, ApJ, 495, 539
Dar A., De Rújula A., Antoniou N., 1999, astro-ph/9901004, in press
Dar A., De Rújula A., astro-ph/0005080, MNRAS in press
Dixon D. D. et al., 1998, New Astron. 3, 539
Evenson P., Meyers P., 1984, J. Geophys. Res., 89 A5, 2647
Felten J. E., Morrison P., 1966, ApJ, 146, 686
Ferrando P. et al., 1996, A&A 316, 528
Golden R. L. et al., 1984, ApJ, 287, 622
Golden R. L., et al., 1994, ApJ, 436, 739
Hartmann D. H., 1995, ApJ, 447, 646
Kazanas D., Protheroe J. P., 1983, Nature, 302, 228
Moskalenko I. V., Strong A. W., Reimer O., 1998, astro-ph/9811221
Moskalenko I. V., Strong A. W., 2000, ApJ, 528, 357
Nishimura J. et al., 1980, ApJ, 238, 394
Page D. N., Hawking S. W., 1976, ApJ, 206, 1
Pohl M., Esposito J. A., 1998, ApJ, 507, 327
Prince T. A., 1979, ApJ, 227, 676
Rudaz S., Stecker F. W., 1991, ApJ, 368, 40
Salamon M. H., Stecker F. W., 1998, ApJ, 493, 547
Silk J., Srednicki M., 1984, PRL, 53, 264
Sreekumar P. et al., 1998, ApJ, 494, 523
Stecker F. W., Salamon M. H., 1996, ApJ, 464, 600
Stecker F. W., Morgan D. L., Bredekamp J., 1971, PRL, 27, 1469
Strong A., Moskalenko I. V., 1998, ApJ, 509, 212
Strong A. W. et al., 1997, in Proceedings of the 4th Compton
Symposium, AIP, 410, 1198
Strong A. W., Moskalenko I. V., Reimer O., 1998, astro-ph/9811296
Tang K. K., 1984, ApJ, 278, 881
Thompson D. J., Fichtel C. E., 1982, A&A, 109, 352

 |
 |
| (a) | (b) |
 |
 |
| (c) | (d) |
 |

|
| (a) | (b) |
 |

|
| (c) | (d) |