Hydrodynamic simulations of merging clusters of galaxies
Abstract
We present the results of high-resolution AP3M+SPH simulations of merging clusters of galaxies. We find that the compression and shocking of the core gas during a merger can lead to large increases in bolometric X-ray luminosities and emission-weighted temperatures of clusters. Cooling flows are completely disrupted during equal-mass mergers, with the mass deposition rate dropping to zero as the cores of the clusters collide. The large increase in the cooling time of the core gas strongly suggests that cooling flows will not recover from such a merger within a Hubble time. Mergers with subclumps having 1/8th of the mass of the main cluster are also found to disrupt a cooling flow if the merger is head-on. However, in this case the entropy injected into the core gas is rapidly radiated away and the cooling flow restarts within a few Gyr of the merger. Mergers in which the subcluster has an impact parameter of 500kpc do not disrupt the cooling flow, although the mass deposition rate is reduced by . Finally, we find that equal mass, off-centre mergers can effectively mix gas in the cores of clusters, while head on mergers lead to very little mixing. Gas stripped from the outer layers of subclumps results in parts of the outer layers of the main cluster being well mixed, although they have little effect on the gas in the core of the cluster. None of the mergers examined here resulted in the ICM being well mixed globally.
keywords:
methods: numerical - hydrodynamics - cooling flows - X-rays : galaxies : clusters1 Introduction
In the Cold Dark Matter scenario, clusters of galaxies form through a succession of mergers of smaller subclusters and groups. Major mergers can be the most energetic events in the Universe since the Big Bang, with hydrodynamic shocks dissipating much of the kinetic energy of the collision ( ergs) into the Intracluster Medium (ICM). The theoretical picture is supported by X-ray observations, which suggest that many clusters of galaxies are either undergoing mergers or have experienced merger events in the recent past. ROSAT observations generally focussed on distortion of the X-ray isophotes (e.g. White, Briel & Henry 1993) and the presence of X-ray substructure (Forman & Jones 1994; Buote & Tsai 1996), while evidence for shocks in the ICM was seen in temperature maps created from ASCA observations (e.g. Arnaud et al. 1994). The launch of Chandra and XMM-Newton has provided a wealth of observational data, including high-resolution temperature maps of shocks in merging clusters (Markevich & Vikhlinin 2001) and the surprising discovery of sharp surface brightness discontinuities between the hot cluster gas and moving “cold fronts” (Vikhlinin, Markevitch & Murray 2001), which are thought to be the cores of subclusters which have survived the merger process (Markevitch et al. 2000).
Modern cosmological simulations (Bertschinger 1998 and references therein; see also Frenk et al. 1999) are capable of following the evolution of large volumes of the universe from early times until the present day, but are not particularly suited to modeling mergers as the resolution of individual clusters is limited unless techniques such as resimulation (e.g. Eke, Navarro & Frenk 1998) are used. Cosmological simulations are also hard to analyse as the cluster does not necessarily have time to return to hydrostatic equilibrium between mergers, making it hard to separate one merger from the next. An alternative is to study the merger of idealized systems, which, while less realistic than the full cosmological approach, have a number of advantages. Firstly, the objects participating in the merger are fully formed, and so there is no need to simulate the large volumes of space necessary to capture the evolution of a cluster of galaxies from high redshift. We can therefore use a smaller volume in which the merging systems are well resolved, and this also has implications for our hydrodynamic scheme; this is discussed in Section 2. As we are studying a single merger event between two objects which are initially in hydrostatic equilibrium changes in the final object are easily quantified, and the controlled initial conditions allow parameter space to be explored. While full cosmological simulations are ultimately more realistic, the simplified picture represents the best chance of understanding the physics underlying the merger process.
Several authors have presented results from such simulations. Head-on mergers between King-model clusters of unequal mass containing gas and dark matter were studied by Roettiger, Burns & Loken (1993) and Roettiger, Loken & Burns (1997, hereafter RLB97) using a finite-difference code to model the hydrodynamics and an -body code to model the evolution of the gravitational potential, while Schindler & Müller (1993) used a similar approach, although with less controlled initial conditions. However, these simulations treated the baryonic component as being massless, limiting the results to very gas-poor clusters. Pearce, Thomas & Couchman (1994, hereafter PTC94) examined head-on mergers of systems containing gas and dark matter using an adaptive particle-particle, particle-mesh (AP3M; Couchman 1991) code with the gas being modeled using Smoothed-Particle Hydrodynamics (SPH; Monaghan 1992), with their results focusing mainly on the evolution of the core of the cluster rather than the observable properties of the merger.
More recently Roettiger, Stone & Mushotzky (1998) have used a hydrodynamic code based on the Piecewise-Parabolic Method (PPM; Collela & Woodward 1984) coupled to a Particle-Mesh -body code to examine the evolution of the cluster A754, suggesting that its unusual X-ray morphology (e.g. Henry & Briel 1995) is the result of a recent (Gyr), slightly off-centre merger. Ricker (1998) also used PPM to simulate off-centre cluster mergers, although these simulations do not include the dark matter which typically dominates the dynamics of clusters and can make a significant difference to the end state of the merger process (PTC94; see also Section 3.2). Finally, Takizawa (1999; 2000) carried out simulations of merging clusters using SPH, with gravitational forces calculated using a tree algorithm (Barnes & Hut 1986). The simulations of PTC94 and Takizawa (1999) are the most similar to our own and provide a useful comparison, although both were carried out at lower resolution than the results described here.
In this paper we present results from high-resolution (131072 particle) simulations of the merger of idealized clusters of galaxies containing both dark matter and gas, using an AP3M+SPH code. Off-centre mergers and mergers between unequal-mass systems are also examined, with reference to the observable properties of clusters of galaxies. The layout of the paper is as follows; in Section 2 we describe our hydrodynamic scheme and the generation of initial conditions, while results are described in Section 3. The significance of the results are discussed in Section 4, and conclusions are drawn in Section 5.
2 Method
| Run no. | |||||||||
| E1 | 131072 | 1. | 0. | 7.99 | 3.31 | ||||
| E2 | 131072 | 1. | 2.5 | 7.01 | 3.17 | ||||
| E3 | 131072 | 1. | 5. | 5.01 | 2.80 | ||||
| E4 | 131072 | 1. | 10. | 2.59 | 1.86 | ||||
| U1 | 73728 | 8. | 0. | 2.26 | 1.71 | ||||
| U2 | 73728 | 8. | 2.5 | 1.95 | 1.55 | ||||
| U3 | 73728 | 8. | 5. | 1.52 | 1.32 | ||||
| C1 | 131072 | 1. | 0. | 4.94 | 4.34 | ||||
| C2 | 73728 | 8. | 0. | 2.18 | 1.83 | ||||
| C3 | 73728 | 8. | 2.5 | 1.09 | 1.08 | ||||
| R1 | 32768 | 1. | 0. | 5.01 | 3.34 | ||||
| R2 | 8192 | 1. | 0. | 3.60 | 2.94 |
The simulations described here have been carried out using HYDRA111This code is in the public domain and can be downloaded from http://hydra.sussex.ac.uk/ or http://hydra.mcmaster.ca/. (Couchman, Thomas & Pearce 1995), an -body, hydrodynamics code which combines an AP3M -body algorithm (Couchman 1991) with SPH. Tests of our code can be found in Couchman et al. (1995), Thacker et al. (2000) and Ritchie & Thomas (2001).
In SPH, the equations of motion for a compressible fluid (e.g. Landau & Lifshitz 1959) are solved using a Lagrangian formulation in which the fluid is partitioned into elements, a subset of which are represented by particles of known mass and specific energy 222The specific energy is related to the gas temperature by , where is Boltzmann’s constant, is the mass of the hydrogen atom and is the relative molecular mass.. Continuous fields are represented by interpolating between particles using a smoothing kernel, which is normally defined in terms of a sphere containing a fixed number of neighbours, centred on the particle in question. The radius of the smoothing sphere is adjusted so as to keep the neighbour count approximately constant, making SPH adaptive in both space and time. The particle nature of SPH means that there is no grid to constrain the geometry or dynamic range of the system being studied, and allows SPH to be easily integrated with many -body solvers. However, unlike PPM, SPH requires an artificial viscosity to convert relative motion to heat; we use a pairwise artificial viscosity (Monaghan & Gingold 1983) as described by Thacker et al. (2000).
SPH is often criticised for capturing shocks poorly in comparison with modern high-order Godunov-type schemes, and for having poor resolution in low-density regions, which are represented by relatively few particles. While both of these criticisms can be true, they are of limited importance for the simulations considered here. Steinmetz & Müller (1993) find that the shock capturing ability of SPH is closely linked to the number of particles in the system being modeled, with SPH giving accurate results if in excess of particles are used to model three-dimensional problems. This figure is out of reach of most cosmological simulations, but is easily achievable with our simplified approach, and the initial conditions are generated with the constraints of Steinmetz & Müller (1993) in mind. We will not be able to follow the propagation of shocks into the lower-density outer regions of the cluster as well as finite-difference methods, but the X-ray luminosity of such regions will be low and so the limitations of our hydrodynamical method will not impact any potentially observable properties of the system.
Radiative cooling is implemented in our code by adding a sink term to the Energy equation, where is the emissivity (the emission rate per unit volume), interpolated from the cooling function of Sutherland & Dopita (1993). Cooling during shock-heating (see Hutchings & Thomas 2000) is minimized by applying the artificial viscosity prior to the gas being allowed to cool. The cooling is assumed to occur at constant density, with the time-step ensuring that this condition is approximately satisfied, as described in Thomas & Couchman (1992). Particles which have cooled to 104K, the temperature at which the cooling function drops to zero, are converted to collisionless ‘star’ particles to avoid a build-up of cold gas that can cause the SPH algorithm problems (Pearce et al. 2001; Ritchie & Thomas 2001). We neglect the effect of thermal conductivity, which is known to be strongly suppressed in clusters of galaxies (e.g. Fabian, Nulsen & Canizares 1991; Vikhlinin et al. 2001).
2.1 Initial Conditions
Our idealized clusters initially have gas and dark matter density profiles given by a Hubble profile
| (1) |
where is the central mass density and is the cluster core radius. This is similar to the gas density profile deduced from the X-ray surface brightness of clusters of galaxies, and has been widely used by other authors simulating cluster mergers (e.g. PTC94; RLB97; Ricker 1998; Takizawa 1999). -body simulations (e.g. Moore et al. 1999) suggest that the dark matter is more centrally concentrated than that given by Equation 1, and Ricker & Sarazin (2001) have recently carried out simulations in which the dark matter density follows the Navarro, Frenk & White (1997) profile
| (2) |
where and are a scaling density and radius that are dependent on the halo mass. They find that in their simulations the morphological changes, temperature jumps and gas velocities that are similar to previous work in which the dark matter density is given by Equation 1, although the peak X-ray luminosity is higher.
In our simulations, we truncate the density profile at , a numerical compromise which allows the core to be well resolved yet be located well within the outer boundary of the system. To set up the density profile, we first place gas particles randomly within a cubical simulation volume, which is then evolved at constant temperature until spurious fluctuations arising from the initial particle distribution have died away. Particles are then ordered in terms of their distance from the centre of the box and are translated radially to match the desired mass profile, ensuring that the gas starts off close to a relaxed state. Finally, collisionless dark matter particles with 9 times the gas mass are placed on top of each gas particle.
Once particles have been placed, particle velocities must be set. Dark matter velocities are drawn from a 3–D Gaussian distribution of width in each direction, where is determined by solving the Jeans equation
| (3) |
Gas particles have their initial velocities set to zero and are given a temperature equivalent to , so that
| (4) |
with particle densities set from Equation 1. The sound crossing time for the cluster is
| (5) |
Figure 1 shows the evolution of the density profile over a period of 20 sound crossing times for an isolated system set up with the density profile specified by Equation 1. Some expansion in the outer region due to the initially-truncated density profile is visible, but these fluctuations are small and settle down within a couple of sound crossings. Our initial conditions for simulations of equal mass mergers simply take two such spheres, displaced by a distance equal to the impact parameter in the -direction and a distance in the -direction. The initial relative velocity in the -direction is equal to the circular speed
| (6) |
at the edge of the cluster, where is the mass of each cluster and as above. This corresponds to a parabolic orbit but, once energy is dissipated in the encounter, leads to a bound system. The effect of varying the encounter velocity is discussed in PTC94.
Mergers between systems of different mass are set up by using fewer particles in the lower-mass cluster (i.e. the mass per particle is kept constant) and scaling the second cluster to match the desired radius and velocity dispersion profile. We use the same impact parameter and relative velocity as in the equal mass encounters.
2.2 Simulations
Details of the simulations are listed in Table 1. With the exception of the simulations carried out in Section 3.6, which examine the effect numerical resolution has on our results, all simulations of equal-mass mergers presented here use 32768 particles each of gas and dark matter in each cluster (i.e. an equal-mass merger simulation contains a total of 131072 particles). In simulations of unequal-mass mergers the particle mass is kept constant, so that the subcluster contains fewer particles, where is the ratio of cluster masses. We are not attempting to simulate the evolution of clusters in a cosmological context, and therefore our simulations use a non-expanding volume with vacuum boundary conditions. Particles leaving the simulation volume are removed, although the size of the box is such that very few particles escape by the end of the simulation. We use a gravitational softening , which is above the particle separation in the core. This choice of softening is discussed in detail in Pearce, Thomas & Couchman (1993).
We use a gas particle mass of and a dark matter mass , giving a total cluster mass of and virial temperature keV. The subclusters used in simulating unequal mass mergers have a mass of and virial temperature keV. We take the core radius to be 100kpc, giving a central gas density cm-3, similar to that used by RLB97. The bremsstrahlung cooling time
| (7) |
(Sarazin 1986), where and erg cm3 s-1, is therefore in excess of a Hubble time in the core of the cluster. While this might suggest that radiative cooling will have little impact on the results of our simulations, cooling times can drop below a Hubble time when the density of the core gas increases as the cores collide and radiative cooling makes a significant (20—40%) difference to our results; this is discussed further in Section 3.3. In addition, we perform some simulations with a higher core density cm-3 (see Section 3.4) in which the cooling time is much less than a Hubble time, although remains greater than the sound crossing time in all of our simulations. We therefore apply radiative cooling to all the simulations performed here.
All of the simulations described here were carried out on a 700MHz Intel Pentium-3 workstation. The simulations of mergers between equal mass, low core density clusters take around 1800 timesteps and 15 hours of CPU time, while simulations of mergers between high core density clusters take around 2500 timesteps and 21 hours of CPU time.
3 Results

|
3.1 Morphology
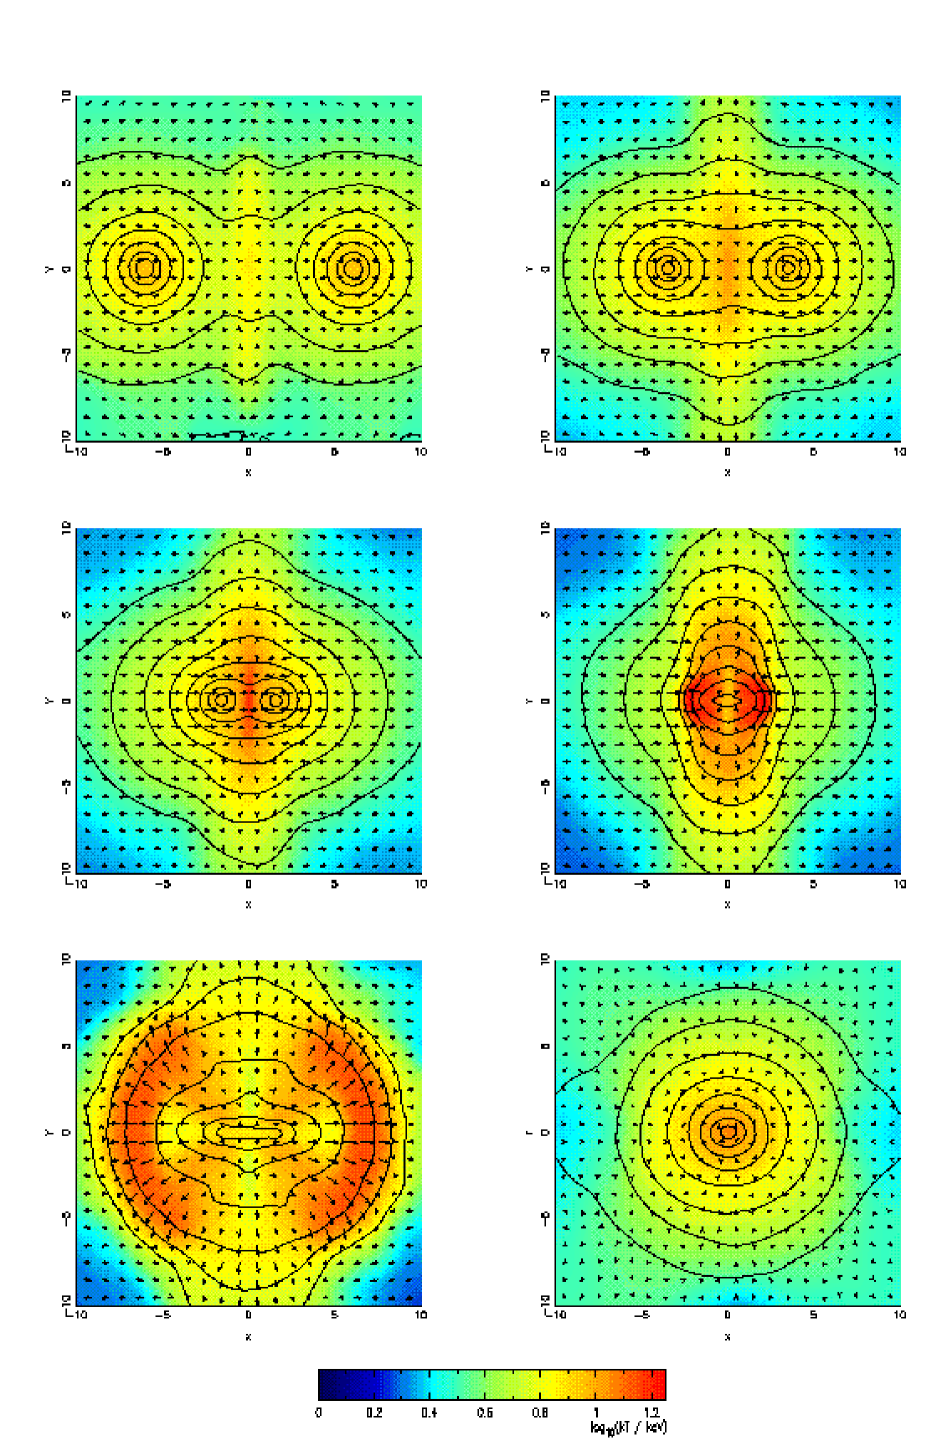
Figure 2 shows a sequence of snapshots of the emission-weighted gas temperature (colours), X-ray surface brightness (contours) and velocity fields (arrows) during the head on merger between two systems with a masses of (run E1). The merging sequence is similar to that seen in other simulations (e.g. Ricker 1998; Takizawa 2000), and is therefore only described briefly here.
As the outer layers of the two clusters start to interact a weak shock forms (panels 1 & 2), and gas is driven outwards in the plane perpendicular to the collision axis with the gas velocity increasing as it accelerates down the pressure gradient. As the cluster cores approach this shock strengthens (panel 3), as does the outflow of gas in the plane of the collision. The increase in gas temperature between the two cores has become clearly visible in temperature maps of the system, but as the bulk of the X-ray emission is coming from the cores of the two clusters the shock still makes only a minor contribution to the integrated emission-weighted temperature of the system (see Section 3.3). As the cluster cores collide (just before panel 4), a strong arc-shaped shock is driven into the outer layers of the cluster (visible in panel 4, and more clearly in panel 5). Meanwhile, gas in the core of the merged cluster goes through a period of expansion driven by the dark matter, cooling adiabatically to slightly less than the pre-collision temperature with the X-ray isophotes forming a bar shape along the collision axis, as noted by RLB97. Finally, the dark matter turns around and recollapses to form a spherically symmetric final object (panel 6). Material ejected in the earlier stages of the merger can be seen falling back towards the core of the cluster.
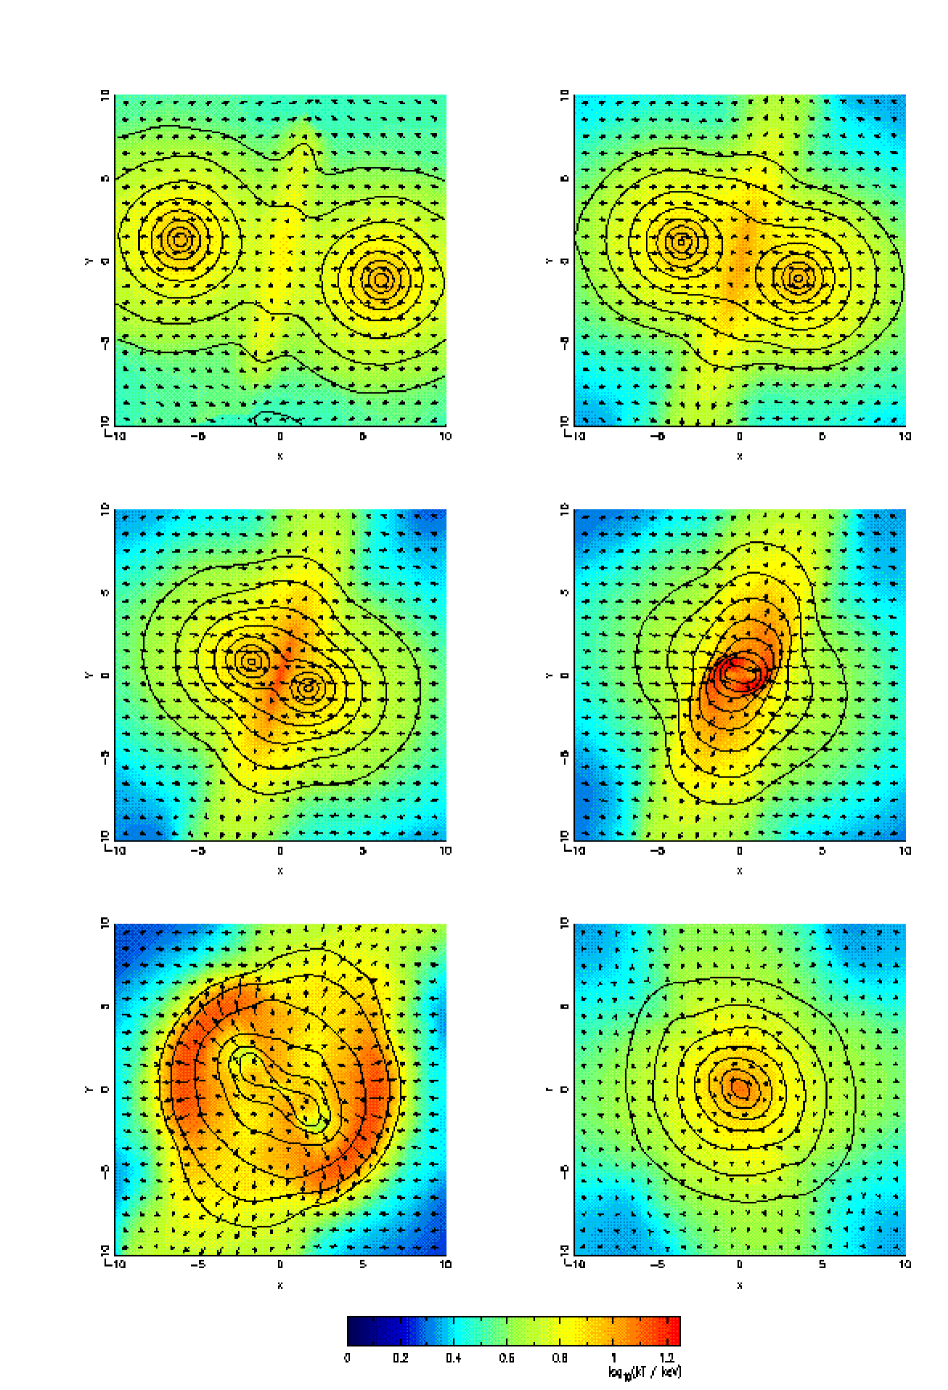
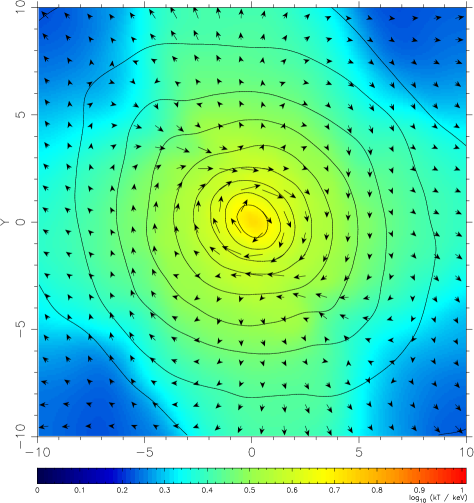
An off-centre merger with impact parameter (run E3) is shown in Figure 3. As before, the clusters have equal masses, and the behaviour is similar to that seen in Figure 2. The shock that forms as the outer layers of the clusters interact is now oblique, but the shock and outflow is otherwise similar to the head-on merger. The picture changes somewhat as the cluster cores interact, with the merger shock generated as the cores collide now propagating with a spiral pattern, and the cores partially surviving their first approach (clearly visible in panel 5), completing most of an orbit before recollapsing and merging completely. The final state of the cluster looks similar to that in the head-on case, although there is now significant rotation of the core, shown in more detail in Figure 4.
3.2 The structure of the merger remnant

|
| Run no. | (kpc) | ||
|---|---|---|---|
| Initial | - | 108 | 1 |
| E1 | 0 | 125 | 0.85 |
| E2 | 2.5 | 135 | 0.65 |
| E3 | 5 | 157 | 0.46 |
Figure 5 shows the radial gas density profiles of the merger remnant for three mergers with impact parameters and 5 (runs E1—E3) ten sound crossing times after the merger, when the gas has returned to hydrostatic equilibrium and the profile has stopped evolving. The core density is normalized to , and the initial density profile is also plotted for reference. Best-fit values of the core radius and core density are listed in Table 2. The merging process has the effect of increasing the core radius and decreasing the core density, with a trend towards a lower core density for the mergers with a non-zero impact parameter, with the core gas receiving additional rotational support.

|
The enlargement of the core is a result of an increase in the entropy of the core gas during the merger, which can be seen in Figure 6. Here, we plot the mean value of the entropy-related parameter
| (8) |
of the 250 particles initially closest to the the core of one of the clusters during two head-on mergers, one in which the clusters have equal masses (run E1) and one in which the second cluster has one eighth of the mass of the first (run U1). The cluster cores start to interact at , and the entropy is normalised so that it is equal to 1 at Gyr. Initially the entropy decreases slowly as a result of radiative cooling but jumps sharply at due to the strong shock formed as the cores collide. The equal mass merger then experiences a second, larger, jump in entropy at Gyr as the dark matter cores of the subclusters turn around and recollapse (see PTC94 for a detailed discussion of this effect, which is absent in their gas-only simulations), while the unequal mass merger experiences only one shock. The increase in core entropy at late times is due to the dissipation of oscillations as the core settles down after the collision.
3.3 X-ray Luminosity, Temperature, and the Relationship
X-ray observatories allow precise measurement of the bolometric X-ray luminosities () and emission-weighted temperatures () of clusters of galaxies, which are observed to be correlated with approximately (Edge & Stewart 1991; David et al. 1993). This relationship is in conflict with theoretical models that assume clusters form through a self-similar gravitational collapse, which predict (Horner, Mushotzky & Scharf 1999) and (Scharf & Mushotzky 1997) where is the redshift at which the cluster forms, indicating that the ICM does not share the self-similarity seen in dark-matter only models. More recent work shows signs of a convergence between theory and observation, as correcting the observations for the effects of cooling flows flattens the relationship at high temperatures (Markevitch 1998; Allen & Fabian 1998), while more realistic numerical simulations including radiative cooling steepen the theoretical predictions (Muanwong et al. 2001). In principle, the dependence on means that the observed relationship contains information about the evolution of clusters. However, while the observed relationship contains significant scatter (Allen & Fabian 1998), some of this is due to physical processes in the ICM such as radiative cooling (Pearce et al. 2000; Muanwong et al. 2001) and possibly preheating (e.g. Lloyd-Davies, Ponman & Cannon 2000) which are not yet well understood. In addition merger shocks will also alter the observed luminosity and temperature of clusters, and we examine these effects here. Throughout this section, we calculate the bolometric luminosity of the merging cluster as
| (9) |
where the subscript denotes the sum over all gas particles, which have temperatures , densities and masses . We assume a mean molecular mass g, and an emissivity tabulated by Sutherland & Dopita (1993) with a metallicity , where is the solar value. The emission-weighted temperature is calculated as
| (10) |

|
Figure 7 plots the evolution of the bolometric X-ray luminosity during simulations E1—E4, which follow the merger of two equal-mass clusters at a range of impact parameters. Times are scaled so that corresponds to the maximum brightening during the head-on merger. The peak luminosity occurs when the cores of the two clusters interact, and, in the case of head-on and nearly head-on impacts, a large increase in luminosity is apparent, with increasing to more than 5 times its precollision value over a period of roughly one sound crossing time. Prior to this time no increase in the total X-ray luminosity is apparent, despite there being clear evidence for a merger being in progress in temperature maps of the cluster (e.g. Figure 2, panel 3). After , the core of the cluster undergoes a period of expansion driven by the dark matter, leading to a decrease in the core density and a large () decrease in X-ray luminosity, before experiencing a small secondary bounce (which occurs at for the head-on merger, and slightly later for the simulations with a non-zero impact parameter) and settling into hydrostatic equilibrium. The final X-ray luminosity is lower than the sum of the emission from the two sub-clusters due to the increase in the entropy of the core gas during the merger. This conflicts with the results of Ricker (1998), who find an increase in the final luminosity after the merger, but this is likely to be an artifact of the lack of dark matter in those simulations, and results from Ricker & Sarazin (2001) appear to be close to those presented here. The total X-ray luminosity of the merger remnant is greatest in the head-on merger, with a trend towards a lower final luminosity with increasing impact parameter in keeping with the increase in core entropy with impact parameter seen in Section 3.2.

|
The effect of including radiative cooling can be seen in Figure 8, which plots the evolution of the bolometric X-ray luminosity in run E1 against an identical merger in which radiative cooling is not included. Radiative cooling increases the peak bolometric luminosity during the merger by roughly 20%, and leads to the gas in the core of the post-merger cluster having slightly lower entropy and consequently being more luminous than the gas in the simulation without radiative cooling.

|
Figure 9 plots the emission-weighted temperature of the cluster during the same set of simulations. Like the X-ray luminosity, the emission-weighted temperature increases significantly during the merger with the effect once again being particularly marked for mergers with a small impact parameter, for which increases by a factor of approximately 3.5. Adiabatic cooling during the core bounce is clearly visible, with the cluster then settling down at a higher temperature as would be expected given the higher virial mass of the remnant.

|
The large changes in the X-ray luminosity and emission-weighted temperature of the cluster during the merger has implications for the and relationships. Figure 10 plots the evolution of the cluster in the plane during two equal mass mergers, one head-on and the other off-centre with . The dashed line in Figure 10 represents a power-law fit to the relationship in the simulations of Muanwong et al. (2001). The net movement on the plane is not that great, given that the initial luminosity plotted in Figure 10 is twice the value for an individual subcluster. The cluster becomes hotter due to the increased virial mass, but the injection of entropy into the core limits any increase in the luminosity of the system. However there are large movements when the subcluster cores merge, with the system initially following a track with as the core gas is compressed adiabatically with the track steepening as the gas shocks at , and during this time the cluster appears to be much hotter and more luminous than its pre-merger state. The cluster subsequently returns to a constant entropy track as the core expands after the merger, with both the luminosity and temperature dropping below their pre-merger values before the core recollapses. The implications for the relation are also significant. The simulations of Muanwong et al. (2001) find that , and so a mass determination for the cluster based upon this relationship would vary by a factor of depending on when the observation was taken. The strong variations in temperature and luminosity are relatively short lived, taking place on a timescale of around a sound crossing time, but for large clusters this can still represent years or more.

|
While equal-mass mergers will cause large fluctuations in the X-ray luminosity and the emission-weighted temperature of a cluster of galaxies, they are rare events. Unequal mass mergers will be much more common, and the increase in and during these events may prove to be a significant source of scatter in the relationship. Figure 11 plots the evolution of the cluster in the plane during the merger of two systems with masses in the ratio 8:1. The maximum increase in luminosity is smaller than that seen in the equal-mass mergers, as would be expected, but can still double during a head-on event. The lower post-merger luminosity indicates that there is still an injection of entropy into the core of the larger cluster, while the emission-weighted temperature of the cluster increases by as much as 2keV during the head-on merger.
3.4 Cooling Flows
The simulations in Section 3.3 are concerned with clusters with relatively low central densities (cm-3) and correspondingly long cooling times. However in of observed clusters the central gas has a radiative cooling time less than a Hubble time (Edge, Stewart & Fabian 1992; White, Jones & Forman 1997). This short cooling time leads to a slow inflow of gas to maintain pressure support known as cooling flow (Fabian 1994), in which as much as 1000 yr-1 can cool out of the ICM (Allen et al. 1996). There is a significant anticorrelation between substructure in clusters and the presence of cooling flows (Buote & Tsai 1996) which are almost never associated with very irregular clusters (Edge et al. 1992), but the widespread nature of cooling flows suggests that they cannot be easily disrupted by minor mergers, which occur relatively frequently.
The short cooling times and high X-ray luminosities in the cores of cooling flow clusters imply high gas densities. To assess the effects of this, we have carried out a second series of simulations of mergers of clusters containing cooling flows. These simulations are set up in a similar way to that described in Section 2.1, but with the core radius reduced to 40kpc to give a higher core density. The outer density cutoff remains 1.6Mpc from the centre of the cluster, and so now . This density profile is no longer static as the cooling time is now comparable to the timescale of our simulations, and so we allow the clusters to evolve in isolation until an approximately steady state is reached (i.e. the density profile in the core has stopped evolving) before bringing them together prior to merging. The density profile of these ‘cooling flow’ clusters after this initial period of relaxation is shown in Figure 12, with the core density being approximately 0.02cm-3 and the central cooling time being around years. Prior to the merger the cooling flow is depositing mass at a steady rate of just over .

|

|
The evolution of the bolometric X-ray luminosity with time, shown in Figure 13, is noticeably different from the low core density mergers examined in the previous section. The two X-ray brightness curves have been normalized to their luminosity at Gyr for comparison, as the cooling-flow cluster otherwise has a much higher luminosity due to its higher core density. Unlike the low core density cluster, the cooling flow cluster brightens only briefly, although the peak luminosity is only slightly lower than in the low density simulation. In addition, the second core bounce happens much more rapidly, and the cluster dims by a factor of more than 30 between bounces. These effects are a result of the different density profiles of the two clusters. The X-ray luminosity of the two clusters is dominated by emission from the densest core gas, and will increase when that gas is compressed. The strongly-peaked density profile of the cooling-flow cluster will therefore increase its luminosity when the very centre of the two clusters interact, whereas the flat, constant density core of the low-density cluster will experience a much more prolonged increase in luminosity. In addition, the more centrally concentrated mass distribution in the cooling flow cluster will relax more efficiently, leading to a shorter time between core bounces (the same effect can be seen in Pearce et al. 1993, who examine mergers between collisionless systems having Hubble density profiles with =2, 3 and 4). The path of the cooling flow cluster in the plane is similar to that seen in the previous section, although there is continuing evolution at late times as the dense core gas radiates away the energy gained in the merger.

|
The unequal-mass merger in which the major cluster has a high density core show little evolution in the plane. The head-on merger (run C2) shows a very brief increase in luminosity of roughly a factor of two and an increase in the emission-weighted temperature of around 1.5keV, while an off-centre merger with (run C3) shows only a small () increase in luminosity and a barely-noticeable increase in the emission-weighted temperature (keV). The implication is that these unequal-mass mergers have only a small effect on the core gas of cooling flow clusters, especially when the merger is off-centre, and this can be clearly seen in Figure 14, in which the evolution of the entropy of the gas in the core of the cooling flow cluster is plotted. In the head-on equal-mass merger the core gas receives a large increase in entropy, suggesting that the whole core has been disrupted, and the cooling time in the core jumps to around years. The actual mass deposition rate, measured from the number of gas particles cooling to K each timestep, drops to zero as the cores of the two clusters collide, increasing slowly after the merger, although even after 10Gyr the mass deposition rate is still less than . However, the apparent mass deposition rate derived from the luminosity and temperature within the cooling radius
| (11) |
(Fabian 1994) increases briefly during the merger and does not provide an accurate estimate of the mass cooling out of the ICM until the cluster has returned to hydrostatic equilibrium.
The head-on unequal-mass merger also shows a jump in entropy, and although the cooling time of the core gas doubles to around years the energy injected into the core rapidly starts to be radiated away. The mass deposition rate again drops sharply during the merger, but recovers to around within 4–5 Gyr. In contrast to the head-on mergers, the unequal-mass off-centre merger does not display any signs of the core gas being shocked, indicating that the bow-shock around the infalling subclump cannot have penetrated all the way into the core of the cluster. However the entropy of the core gas is decreasing more slowly after the merger, reflecting a slight increase in the cooling time to around years accompanied by a drop of around in the mass deposition rate. The increase in the central cooling time is a result of ram pressure from the infalling subcluster displacing gas from the core of the cluster (Fabian & Daines 1991; Gomez et al. 2000). Ram pressure also accounts for the bulk of the disruption to the head-on, unequal-mass merger, as the increase in core entropy alone is insufficient to account for the doubling of the cooling time in the cluster core.
The robustness of high-density cores to the effects of what should be a relatively common merger event is of interest to the survival of cooling flows in clusters of galaxies. Our simulations suggest that a major merger between clusters of equal mass will completely disrupt any cooling flow activity, but cooling flows, once established, may prove resilient to mergers with lower-mass subclumps, especially if they are off-centre. While the cooling time in the low core density simulations remains greater than a Hubble time during almost all of the merger process, dipping below years only during the maximum compression of the cores, the cooling time in the high-core density clusters remains below a Hubble time throughout the process. In the case of the equal-mass merger the increase in core entropy and cooling time is large, and is enough to both disrupt the cooling flow and to prevent it from restarting soon after the merger, while the increase in the cooling times in the unequal-mass mergers are much less, and would indicate that the cooling flows would either experience minimal disruption or would rapidly be reestablished.
3.5 Mixing
Observations of the abundance of metals in the ICM suggest that negative radial metallicity gradients are common in clusters of galaxies (Irwin & Bregman 2001 and references therein). Significant gradients are most common in clusters containing cooling flows, while clusters with no cooling flow also tend to have a flat metallicity gradient, although this is not universal. The metallicity gradient is thought to be a result of either galactic winds or the stripping of metal-enriched gas from galaxies, and Irwin & Bregman (2001) suggest that the non-cooling-flow clusters have experienced a merger that both disrupted the cooling flow and mixed the ICM, thus erasing the metallicity gradient.
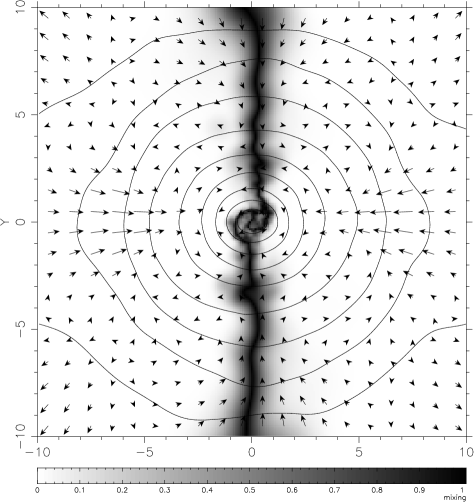
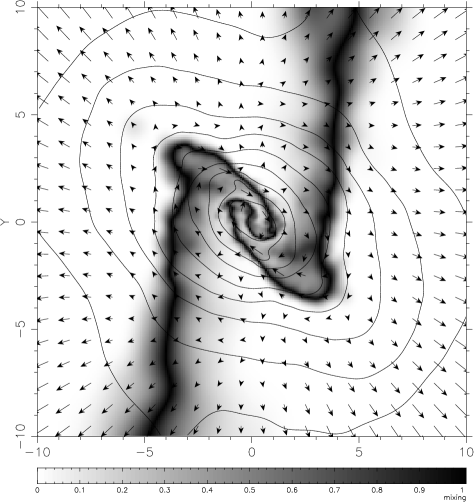
We examine the degree of mixing in the merger remnant in our simulations by smoothing the gas particle distribution on to a grid, and measuring a quantity in each cell, where
| (12) |
and and are the number of particles in the cell which were in cluster 1 and 2 respectively at the start of the simulation. The cell size is set so that each cell will, on average, contain at least ten particles, with the cells in the core containing more than this number, although this is not always true in the low-density outer regions of the cluster which are represented by relatively few particles. In a well-mixed cell and will be equal and so , while in a cell in which no mixing has occurred .
|
|
The degree of mixing 5Gyr after a head-on, equal-mass merger is shown in Figure 15. Very little mixing of the ICM has taken place, with the mixing in the centre of the cluster only appearing at around Gyr, apparently driven by the infall of material back along the merger axis rather than by the merger itself. Much more mixing is visible in Figure 16, which shows the state of an off-centre merger with . This is also plotted at Gyr, although in this case the cluster is still settling back to a steady state, as can be seen in the distortion of the X-ray isophotes. The angular momentum in the system means that the core of the merger remnant is well mixed, although there is still little mixing of the ICM at .
|
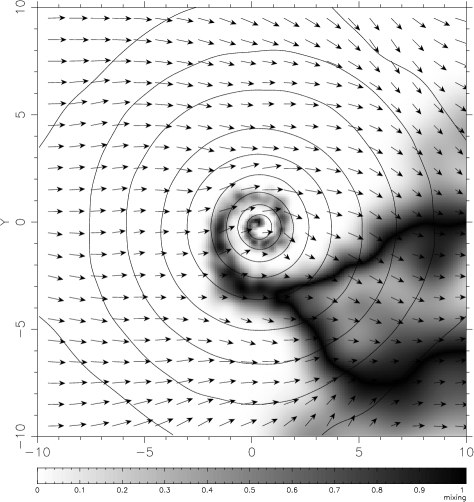
Finally, Figure 17 shows the degree of mixing during an off-centre merger in which the main cluster has a mass eight times that of the infalling subcluster. In this case, low-density gas is rapidly stripped from the subcluster and mixing occurs throughout the outer layers of the main cluster. However, the subcluster core is less efficiently stripped, and can be seen spiraling all the way into the core of the main cluster. There is a clear difference between the final states of the equal mass and unequal mass mergers. Very little mixing occured in the outer layers of the cluster during the equal mass mergers, although the off-centre mergers mixed the cores efficiently, while the unequal mass merger caused very little mixing in the core but lead to significant mixing in the outer regions of the cluster.
While none of these mergers mixed the ICM globally, our simulations suggest that mergers of the magnitude necessary to disrupt a cooling flow can efficiently mix the cores of clusters on the scales accessible to X-ray observations (in general of the virial radius) if the merger is off-centre. In contrast, the unequal mass merger was unable to mix the core gas efficiently, but may cause locally increased abundances such as that seen by Arnaud et al. (1994) in the Perseus cluster and are consistent with the presence of a cooling flow, which will not necessarily be disrupted during a minor merger.
3.6 Numerical Resolution
| Run no. | |||
|---|---|---|---|
| E1 | 131072 | ||
| R1 | 32768 | ||
| R2 | 8192 |
Quantifying the effects of limited resolution is always important in numerical simulations. To assess the impact that resolution has on the results presented here, we have carried out two further simulations of head-on mergers between equal mass systems in which the total number of particles have been reduced by a factor of 4 (run R1) and 16 (run R2), giving a total of 32768 and 8192 particles respectively, with the cluster properties kept constant by increasing the mass of the remaining particles. Details of the simulation parameters are shown in Table 3.

|
The evolution of the clusters in the plane during these simulations is shown in Figure 18. The convergence between runs is good, with the evolution of the system being similar in all three simulations. The main effect of lowering the resolution is a systematic decrease in the luminosity of the merger remnant. In our low-resolution runs less energy is deposited in the halo gas than in the full runs and the core gas is shocked to a greater extent, leading to a broader, higher-entropy core in the final cluster, a result also seen in the resolution testing carried out in PTC94. The differences in the emission-weighted temperature are small.
If the particle number is reduced further then the agreement between simulations worsens, and we would agree with the conclusions of PTC94 that 1000 gas particles per cluster represent a minimum for modelling the bulk properties of a merging system. However, more than gas particles per cluster are required to produce well-resolved temperature and X-ray surface brightness maps such as those shown in Figures 2 and 3, in agreement with Steinmetz & Müller (1993).
We conclude that the effects of resolution are of limited significance in our simulations. The evolution of the cluster in the plane has converged to a consistent result, differing only in detail as the resolution is increased. Equally, we have sufficient resolution to follow the propagation of shocks in the ICM acceptably, although here our resolution is closer to the minimum required for the problem.
4 Discussion
It is clear from the results presented here that mergers can alter the global properties of clusters of galaxies. During a merger, hydrodynamic shocks dissipate much of the kinetic energy of the impact into the ICM, leading to a departure from hydrostatic equilibrium that can last for several Gyr. Mergers lead to many potentially observable effects, including strong temperature gradients across shocks, distortion in the X-ray isophotes, multiple peaks in the X-ray surface brightness and high-velocity bulk flows in the ICM. Despite this, identifying merging clusters is not necessarily easy, as both projection effects and the limits of X-ray observations can serve to mask many of the signs of an ongoing merger. While X-ray substructure is clearly visible both before and after a merger when viewed perpendicular to the merger axis (as can be seen in Figures 2 and 3), the X-ray isophotes appear spherically symmetric throughout the merger when viewed along the merger axis. Equally, the shocks so apparent in temperature maps when viewed perpendicular to the merger are not obvious when viewed along the merger axis, with the cluster just appearing to have a steep temperature gradient as the cores of the two subclusters merge. While this departure from isothermality is itself a good indicator of a merger, it requires that the temperature profile is both sufficiently well resolved for it to be apparent and is not unduly affected by the effects of the merger, as the X-ray deprojection method (e.g. Arnaud 1988) assumes that the cluster is spherically-symmetric and in hydrostatic equilibrium. Temperature maps, derived directly from the X-ray hardness ratio, will therefore be a better indicator of an ongoing merger than deprojected temperature profiles. If the cluster is poorly resolved, it will simply appear to be well relaxed, hot and luminous, although evidence for a merger will still be seen in the distribution of the peculiar velocities of the galaxies in the two clusters, which can be expected to be significantly bimodal during a merger. At intermediate angles, projection effects will serve to smooth distortions in the X-ray isophotes and reduce the visibility of the merger in the X-ray waveband, although the effects are still apparent.
The merging process has major implications for statistical studies of clusters. As we have shown in Section 3.3, even relatively minor () mergers can introduce a significant scatter in the observed relationship, while estimates of the mass of clusters based on the relationship (Horner et al. 1999) will suffer large uncertainties during and immediately after a merger. Mass estimates based on assumptions of hydrostatic equilibrium (e.g. Fabricant, Lecar & Gorenstein 1980) will also be strongly affected as the departures from equilibrium can last for several Gyr after the merger, during which time many of the readily-observed signs of the merger have faded, and Roettiger et al. (1996) estimate that errors in the mass estimate may reach 50% in the 2Gyr following a merger. Edge et al. (1992) suggest that clusters will typically undergo a merger every 2-4Gyr, similar to the timescale for our clusters to return to hydrostatic equilibrium, implying that truly relaxed clusters may be uncommon. The large increase in X-ray luminosity during a merger will also introduce strong selection effects into cluster surveys, and the clusters found at high redshift may not be a representative sample. The increases in X-ray luminosity and temperature during a major merger will strongly influence the statistics of the hottest and most luminous clusters of galaxies. This has been confirmed by Chandra temperature maps of two of the hottest clusters known, 1E 0657-56 (Tucker et al. 1998) and A2163 (David et al. 1993; Markevitch & Vikhlinin 2001), both of which show strong merger shocks. In addition, unusual clusters like A851, which is cooler and less luminous than it’s richness would suggest, may be undergoing the post-merger core expansion (Schindler & Wambsganss 1996).
The situation is more complex when cooling flow clusters are considered. We find that major mergers will almost certainly disrupt cooling flows to the extent that they cannot restart within a Hubble time, consistent with the lack of cooling flows in irregular clusters (Edge et al. 1992), but our unequal mass mergers have less of an effect on the cooling flow. A head-on merger still disturbed the cooling flow, although it restarted within a relatively short period, while an off-centre merger had little impact on the flow. The survival of the cooling flows during minor mergers is supported by a growing body of observations of cooling flow clusters that also show evidence for a late-stage merger (e.g. A2142; Markevitch et al. 2000), as well as merging clusters with small cooling flow cores (e.g. A2065; Markevitch et al. 1999) which suggest that the cooling flow has been disturbed but has survived, at least until the present day.
Finally, we examined the degree to which mergers can mix the ICM. While the ICM is never well-mixed globally, our simulations suggest that major off-centre mergers can efficiently mix the core gas, although there was very little mixing during a head-on merger. Equal mass mergers will also disrupt any cooling flow in the cluster, and may explain why metallicity gradients are rare in clusters without a cooling flow (Irwin & Bregman 2001). The unequal mass merger introduced a high degree of mixing in the outer layers of the main cluster as the low-density gas in the subclump is rapidly stripped away, but had little effect on the core gas.
A feature of unequal-mass mergers that we have not touched on in this paper is the survival of the cores of subclusters during mergers. Sharp surface brightness discontinuities have been observed by Chandra in merging clusters of galaxies such as Abell 2142 (Markevitch et al. 2000) and Abell 3667 (Vikhlinin et al. 2001), and it has been suggested that these features, termed “cold fronts”, are low-entropy gas from the core of a subcluster that had so far survived the merging process (Markevitch et al. 2000). We find that subcluster cores can survive off-centre mergers, and result in features very similar to those observed by Chandra ; this will be examined further in a subsequent paper.
5 Conclusions
We have presented results from high-resolution AP3M+SPH simulations of merging clusters of galaxies. Our principle conclusions are;
-
1.
Mergers lead to many potentially observable effects, including strong temperature gradients across shocks, distortion in the X-ray isophotes, multiple peaks in the X-ray surface brightness and high-velocity bulk flows in the ICM.
-
2.
An increase in the entropy of the core gas during the merger leads to a broader, lower-density core in the post-merger cluster. In addition, off-centre mergers can give the core additional rotational support.
-
3.
The compression and shocking of the core gas during a merger can lead to large increases in the bolometric X-ray luminosity and the emission-weighted temperature of the cluster. This will have a significant impact on statistical studies of galaxy clusters. Immediately after the cores of the subclusters interact, the core of the cluster undergoes a period of expansion driven by the collisionless dark matter, cooling adiabatically and decreasing in luminosity by more than an order of magnitude, before the cores turn around and recollapse.
-
4.
Radiative cooling leads to an increase of in the X-ray luminosity during and after a merger when compared to simulations without cooling, even if central densities are relatively low (cm-3) and the cooling times in the pre- and post-merger objects are greater than a Hubble time.
-
5.
In a major merger the cluster can be out of hydrostatic equilibrium for several Gyr, during which time the clear observational signs of a merger will become less apparent. Brief departures from hydrostatic equilibrium were also seen in simulations of unequal mass mergers.
-
6.
Cooling flows will be completely disrupted during major mergers, and are unlikely to be able to restart within a Hubble time. However, minor mergers had less of an effect on a cooling flow, which was either unaffected by the merger or was able to restart rapidly. Ram pressure is more effective at disturbing the cooling flow in minor mergers than the merger shock. During a merger the mass deposition rate inferred from observations is a poor estimate of the actual mass cooling out of the ICM.
-
7.
Major off-centre mergers effectively mixed the gas in clusters within a radius roughly equal to , the impact parameter. Head on mergers and unequal-mass mergers had little effect. None of the mergers examined here effectively mixing the ICM globally.
Acknowledgments
BWR acknowledges the support of a PPARC postgraduate studentship. PAT is a PPARC Lecturer Fellow. We thank the referee for helpful comments that have improved this paper.
References
- [\citeauthoryearAllen & Fabian1998] Allen S.W., Fabian A.C., 1998, MNRAS, 297, L57
- [\citeauthoryearAllen et al. 1996] Allen S.W., Fabian A.C., Edge A.C., Bautz M.W., Furuzawa A., Tawara Y., 1996, MNRAS, 283, 263
- [\citeauthoryearArnaud1988] Arnaud K.A., 1988, in Fabian A.C., ed., Cooling Flows in Clusters of Galaxies, Klewer, Dordrecht, p. 31
- [\citeauthoryearArnaud et al. 1994] Arnaud K.A. et al. , 1994, ApJ, 436, L67
- [\citeauthoryearBarnes & Hut1986] Barnes J., Hut P., 1986, Nature, 324, 446
- [\citeauthoryearBertschinger1998] Bertschinger, E., 1998, ARA&A, 36, 599
- [\citeauthoryearBuote & Tsai1996] Buote D.A., Tsai J.C., 1996, ApJ, 458, 27
- [\citeauthoryearCollela & Woodward1984] Collela P., Woodward P.R., 1984, J. Comp. Phys., 54, 174
- [\citeauthoryearCouchman1991] Couchman H.M.P., 1991, ApJ, 368, 23
- [\citeauthoryearCouchman, Thomas & PearceCouchman et al. 1995] Couchman H.M.P., Thomas P.A., Pearce F.R., 1995, ApJ, 452, 797
- [\citeauthoryearDavid et al. 1993] David L.P., Slyz A., Jones C., Forman W., Vrtilek S.D., Arnaud K.A., 1993, ApJ, 412, 479
- [\citeauthoryearEdge & Stewart1991] Edge A.C., Stewart G.C., 1991, MNRAS, 252, 414
- [\citeauthoryearEdge, Stewart & FabianEdge et al. 1992] Edge A.C., Stewart G.C., Fabian A.C., 1992, MNRAS, 258, 177
- [\citeauthoryearEke, Navarro & FrenkEke et al. 1998] Eke V.R., Navarro J.F., Frenk C.S., 1998, ApJ, 503, 569
- [\citeauthoryearFabian1994] Fabian A.C., 1994, ARA&A, 32, 277
- [\citeauthoryearFabian & Daines1991] Fabian A.C., Daines S.J., 1991, MNRAS, 252, 17
- [\citeauthoryearFabian, Nulsen & CanizaresFabian et al. 1991] Fabian A.C., Nulsen P.E.J., Canizares C.R., 1991, A&AR, 2, 191
- [\citeauthoryearFabricant, Lecar & GorensteinFabricant et al. 1980] Fabricant D., Lecar M., Gorenstein P., 1980, ApJ, 241, 552
- [\citeauthoryearForman & Jones1994] Forman W., Jones C., 1994, in Seitter W.C., ed., Cosmological Aspects of X-Ray Clusters of Galaxies, Klewer, Dordrecht, p. 39
- [\citeauthoryearFrenk et al. 1999] Frenk C.S. et al. , 1999, ApJ, 525, 554
- [\citeauthoryearGomez et al. 2001] Gomez P.L., Loken C., Roettiger K., Burns J.O., 2001, ApJ in press (astro-ph/0009465)
- [\citeauthoryearHenry & Briel1995] Henry J., Briel U., 1995, ApJ, 443, L9
- [\citeauthoryearHorner, Mushotzky & ScharfHorner et al. 1999] Horner D.J., Mushotzky R.F., Scharf C.A., 1999, ApJ, 520, 78
- [\citeauthoryearHutchings & Thomas2000] Hutchings R.M., Thomas P.A., 2000, MNRAS, 319, 721
- [\citeauthoryearIrwin & Bregman2001] Irwin J.A., Bregman J.N., 2001 ApJ, 546, 150
- [\citeauthoryearLandau & Lifshitz1959] Landau L.D., Lifshitz E. M., 1959, Fluid Mechanics, Pergamon, Oxford
- [\citeauthoryearLloyd-Davies, Ponman & CannonLloyd-Davies et al. 2000] Lloyd-Davies E.J., Ponman T.J., Cannon D.B., 2000, MNRAS, 315, 689
- [\citeauthoryearMarkevitch1998] Markevitch M., 1998, ApJ, 504, 27
- [\citeauthoryearMarkevitch & Vikhlinin2001] Markevitch M., Vikhlinin A., 2001, ApJ in press (astro-ph/0105093)
- [\citeauthoryearMarkevitch, Sarazin & VikhlininMarkevitch et al. 1998] Markevitch M., Sarazin C.L., Vikhlinin A., 1999, ApJ, 521, 526
- [\citeauthoryearMarkevitch et al. 2000] Markevitch M. et al. , 2000, ApJ, 541, 542
- [\citeauthoryearMonaghan1992] Monaghan J.J., 1992, ARA&A30 543
- [\citeauthoryearMonaghan & Gingold1983] Monaghan J.J., Gingold R.A., 1983, J. Comp. Phys., 52, 375
- [\citeauthoryearMoore et al. 1999] Moore B., Ghigna S., Governato F., Lake G., Quinn T., Stadel J., 1999, ApJ, 524, L19
- [\citeauthoryearMuanwong et al. 2001] Muanwong O., Thomas P.A., Kay S.T., Pearce F.R., Couchman H.M.P, 2001, ApJ, 552, L27
- [\citeauthoryearNavarro, Frenk & WhiteNavarro et al. 1997] Navarro, J.F., Frenk C.S., White S.D.M., 1997, ApJ, 490, 493
- [\citeauthoryearPearce, Thomas & CouchmanPearce et al. 1993] Pearce F.R., Thomas P.A., Couchman H.M.P., 1993, MNRAS, 264, 497
- [\citeauthoryearPearce, Thomas & CouchmanPearce et al. 1994] Pearce F.R., Thomas P.A., Couchman H.M.P., 1994, MNRAS, 268, 953 (PTC94)
- [\citeauthoryearPearce et al. 2000] Pearce F.R., Thomas P.A., Couchman H.M.P., Edge A.C., 2000, MNRAS, 317, 1029
- [\citeauthoryearPearce et al. 2001] Pearce F.R. et al. , 2001, MNRAS,326,649
- [\citeauthoryearRoettiger, Burns & LokenRoettiger et al. 1993] Roettiger K., Burns J.O., Loken C., 1993, ApJ, 407, L53
- [\citeauthoryearRoettiger, Burns & LokenRoettiger et al. 1996] Roettiger K., Burns J.O., Loken C., 1996, ApJ, 473, 651
- [\citeauthoryearRoettiger, Loken & BurnsRoettiger et al. 1997] Roettiger K., Loken C., Burns J.O., 1997, ApJS, 109, 307 (RLB97)
- [\citeauthoryearRoettiger, Stone & MushotzkyRoettiger et al. 1998] Roettiger K., Stone J.M., Mushotzky R.F., 1998, ApJ, 493, 62
- [\citeauthoryearRicker1998] Ricker P.M., 1998, ApJ, 496, 670
- [\citeauthoryearRicker & Sarazin2001] Ricker P.M., Sarazin C.L., 2001, ApJ in press (astro-ph/0107210)
- [\citeauthoryearRitchie & Thomas2001] Ritchie B.W., Thomas P.A., 2001, MNRAS, 323, 743
- [\citeauthoryearSarazin1986] Sarazin C.L., 1986, Rev. Mod. Phys., 58, 1
- [\citeauthoryearScharf & Mushotzky1997] Scharf C.A., Mushotzky R.F., 1997, ApJ, 485, L65
- [\citeauthoryearSchindler & Müller1993] Schindler S., Müller E., 1993, A&A, 272, 137
- [\citeauthoryearSchindler & Wambsganss1996] Schindler S., Wambsganss J., 1996, A&A, 313, 113
- [\citeauthoryearSteinmetz & Müller1993] Steinmetz M., Müller E., 1993, A&A, 268, 391
- [\citeauthoryearSutherland & Dopita1993] Sutherland R.S., Dopita M.A., 1993, ApJS, 88, 253
- [\citeauthoryearTakizawa1999] Takizawa M., 1999, ApJ, 520, 514
- [\citeauthoryearTakizawa2000] Takizawa M., 2000, ApJ, 532, 183
- [\citeauthoryearThacker et al. 2000] Thacker R., Tittley E.R., Pearce F.R., Couchman H.M.P., Thomas P.A., 2000, MNRAS, 319, 619
- [\citeauthoryearThomas & Couchman1992] Thomas P.A., Couchman H.M.P., 1992, MNRAS, 257, 11
- [\citeauthoryearTucker et al. 1998] Tucker W. et al. , 1998, ApJ, 496, L5
- [\citeauthoryearVikhlinin, Markevitch & MurrayVikhlinin et al. 2001] Vikhlinin A., Markevitch M., Murray S.S., 2001, ApJ, 551, 160
- [\citeauthoryearWhite, Jones & FormanWhite et al. 2001] White D.A., Jones C., Forman W., 1997, MNRAS, 292, 419
- [\citeauthoryearWhite, Briel & HenryWhite et al. 2001] White S.D.M., Briel U.G., Henry J.P., 1993, MNRAS, 216, L8