New Nuclear Reaction Flow during r-Process Nucleosynthesis
in Supernovae:
Critical Role of Light Neutron-Rich Nuclei
Abstract
We study the role of light neutron-rich nuclei during r-process nucleosynthesis in supernovae. Most previous studies of the r-process have concentrated on the reaction flow of heavy unstable nuclei. Although the nuclear reaction network includes a few thousand heavy nuclei, only limited reaction flow through light-mass nuclei near the stability line has been used in those studies. However, in a viable scenario of the r-process in neutrino-driven winds, the initial condition is a high-entropy hot plasma consisting of neutrons, protons, and electron-positron pairs experiencing an intense flux of neutrinos. In such environments light-mass nuclei as well as heavy nuclei are expected to play important roles in the production of seed nuclei and r-process elements. Thus, we have extended our fully implicit nuclear reaction network so that it includes all nuclei up to the neutron drip line for Z , in addition to a larger network for Z . In the present nucleosynthesis study, we utilize a wind model of massive SNeII explosions to study the effects of this extended network. We find that a new nuclear-reaction flow path opens in the very light neutron-rich region. This new nuclear reaction flow can change the final heavy-element abundances by as much as an order of magnitude.
aDepartment of Astronomy, School of Science, University of Tokyo,
Hongo, Bunkyo-ku, Tokyo 113-0033, Japan
bNational Astronomical Observatory, and
Graduate University for Advanced Studies,
Osawa, Mitaka, Tokyo 181-8588, Japan
cInstitute of Physical and Chemical Research (RIKEN),
Hirosawa, Wako, Saitama 351-0198, Japan
dNumazu College of Technology,
Ooka, Numazu, Shizuoka 410-8501, Japan
eDepartment of Physics and Center for Astrophysics, University of Notre Dame,
Notre Dame, IN 46556, U.S.A.
1 Introduction
The r-process is responsible for roughly half of the abundance of nuclei heavier than iron. However, the astrophysical site for this nucleosynthesis process is still a mystery which remains as a major focus of nuclear astrophysics.
Recent detections of the r-process elements in several metal-deficient halo stars (Sneden et al. 1996, 1998, 2000) have indicated that the observed abundance pattern of heavy elements is very similar to that of the solar r-process abundance (Kppeler et al. 1989, Arlandini et al. 1999) for the mass region A. This finding suggests that the r-process occurs in a specific environment such that the abundance pattern is completely independent of the metallicity of the progenitor stars. It is generally believed that the r-process occurs under explosive conditions at high neutron density and high temperature. It has been discussed, for sometime, that core-collapse supernovae (type II or type Ib) could provide the most likely environment for such r-process nucleosynthesis. In a supernova explosion, it is now commonly accepted that massive Fe cores do not readily explode in a purely hydrodynamical way, but that they require help from neutrino heating [the so-called delayed explosion (Bethe Wilson 1985)]. The r-process occurs in the region between the surface of the newly-formed neutron star and the outward moving shock wave (Meyer et al. 1992). In this region, the entropy is so high that the NSE favors abundant free neutrons and alphas rather than heavy nuclei. This is an ideal site in that it naturally satisfies the observed metallicity independence of the r-process yields.
Woosley et al. (1994) have performed an r-process simulation based on a delayed explosion model, from which an excellent fit to the solar r-process abundance pattern was obtained. However, the required high entropy in their supernova simulation has not been duplicated by other numerical calculations (Witti et al. 1994, Takahashi et al. 1994). Furthermore all those calculations used a limited network for light nuclei and they did not consider neutrino interactions. Since neutrinos can completely dominate the environment just outside a newly born neutron star, their effects must be included in nucleosynthesis calculations. Neutrino-nucleus interaction processes during the r-process have been considered by several authors (Meyer et al. 1992, Meyer 1995, Fuller Meyer 1995, Qian et al. 1997, McLaughlin et al. 1996). These studies have shown that, among other things, neutrino processes tend to hinder the r-process by decreasing the neutron-to-seed abundance ratio although they can help to smooth the final abundance pattern.
These results may restrict the supernova explosion model. However, Cardall Fuller (1997), Qian Woosley (1996), Otsuki et al. (1999), and Sumiyoshi et al. (2000) have shown that a short dynamic-time-scale model plus general relativistic effects can lead to a successful r-process. This is because the temperature and density decrease very fast. Therefore, charged-particle reactions to make seed nuclei do not proceed efficiently, and only a small amount of seed nuclei are produced. Thus, the neutron-to-seed abundance ratio becomes large enough for heavy r-process nuclei to be synthesized.
The seed nuclei in the neutrino-driven wind are produced early in the expansion by alpha-capture processes. When the temperature and density become low and charged-particle reactions almost cease, the r-process starts from these seed nuclei. This is believed to be a general scenario for r-process nucleosynthesis. Thus, in most previous studies of the r-process, interest was paid mainly to heavy nuclei. Although a few thousand heavy nuclei were included in the nuclear reaction network, only a limited number of light-mass nuclei were selected near the -stability line. However, the success of wind-models with a short dynamic time scale requires that attention be given to the reactions of light neutron-rich nuclei in a very neutron rich environment. Light-mass nuclei as well as heavy nuclei are expected to play important roles in the production of seed nuclei and r-process elements. Indeed, it has been noted (Cameron 2001) that alternate reaction flow paths involving neutron-rich light nuclei may be important for -process nucleosynthesis.
In order to study quantitatively the role of light neutron-rich nuclei, we have therefore extended the nuclear reaction network. We have added about 40 unstable nuclei for Z to a larger network for Z . We find that a new nuclear reaction paths open in the very light neutron-rich region. We also find that these new nuclear reaction paths can change the heavy element abundances by as much as an order of magnitude, while still keeping the prominent three peaks of the r-process elements as well as the hill of the rare-earth elements. In the present nucleosynthesis study, we have analyzed the effect of this expanded network in the framework of a numerical simulation of the neutrino-driven wind.
2 Reaction Network
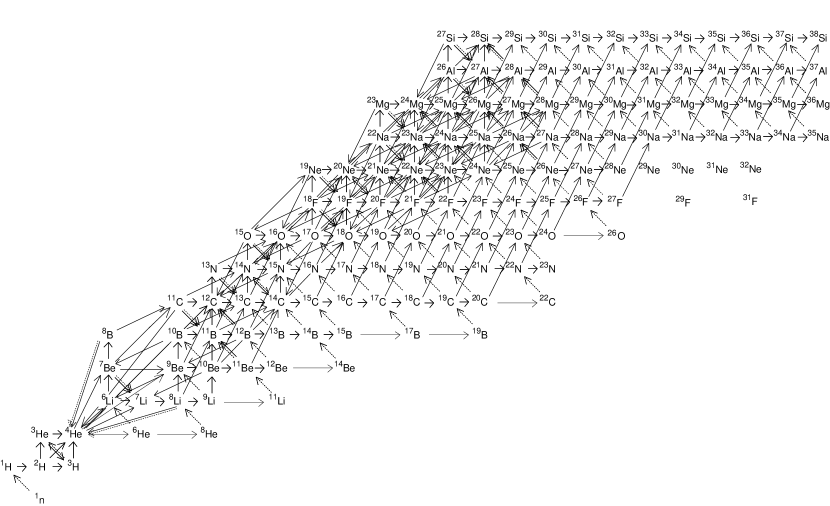
The nuclear reaction network used in Meyer et al. (1992) and Woosley et al. (1994) is probably adequate for simulating the nucleosynthesis of intermediate-to-heavy mass nuclei. However, in the mass region Z, this network is limited to only a few neutron-rich unstable nuclei in addition to the stable ones (see Table 1). Charged-particle reactions, which assemble -particles into heavier nuclei (i.e. -process), are fast at high temperature T9 in the early stage of the expanding neutrino-driven winds. Therefore, the following reactions (and their inverse) linking the light elements up to 20Ne were identified to be most important: , , , , , , , . On the other hand, the onset of the r-process is thought to be delayed until the temperature drops to below T. By this time many seed nuclei in the range of have been produced by charged-particle reactions. This is the reason why the light-mass neutron-rich nuclei were presumed to be unimportant in the -process as well as the r-process. However, as we will discuss later in more detail, light nuclei can be important in the extremely neutron-rich environment of neutrino-driven winds (Otsuki et al. 2000, Sumiyoshi et al. 2000, Kajino et al. 2001) where they play a significant roles in the production of both seed and r-process nuclei.
We have therefore extended and improved the reaction network so that it covers all radioactive nuclei up to the neutron-drip line for , as shown in Figure 1. Although information is limited on the rates for reactions, we did consider nuclei which are unbound after an (n,) reaction, i.e. 6He, 8He, 11Li, 14Be, 17,19B, 22C, etc. Our extended network thus includes more than 63 nuclides for and more than 200 reactions among them, while the network used in Woosley et al. (1994) includes only 27 nuclides, most of which are stable. We included all charged-particle reactions for A, in order to study both the -process and the neutron-capture flow, as well as their competition in the production of seed nuclei. We take the rates of charged-particle reactions from those of Kajino et al. (1990ab), Orito et al. (1997), and the NACRE compilation (Angulo et al. 1999). The -decay lifetimes are from Tachibana et al. (1990, 1995). We also added many heavier, neutron-rich nuclei for Z from -stability to the neutron-drip line in addition to our extended network code. The total number of nuclides up to Americium isotopes is . We refer to this hereafter as the ”full network”. We believe we have included all possible relevant reactions in this network.
We also used another smaller network which is similar to the ones used in Meyer et al. (1992) and Woosley et al. (1994). This network includes only a few light neutron-rich nuclei. We shall refer to this as the ”small -network”. Details on the difference between the ”full network” and the ”small -network” are shown in Table 1 and Figure 1.
Except for the above modifications and extension of our network, the calculation is essentially the same as that of Meyer et al. (1992) and Woosley et al. (1994). Our ”full network” includes (,n) reactions and their inverse up to Z . Neutron captures, their inverse reactions, and -decays are included for all isotopes. Rates for these reactions are taken from Caughlan & Fowler (1988), Woosley et al. (1978), and OAP-422 (Woosley et al. 1975). Neutron capture rates for the heavier nuclei were taken from experiment where known, and otherwise are from Holmes et al. (1976) and Woosley et al. (1978). The -decay rates were taken from Klapdor et al. (1984). We include -delayed neutron emission of up to three neutrons (Thielemann et al. 1983). We use the nuclear-mass table from Hilf et al. (1976).
As for neutrino interactions, we include electron-type neutrino capture () for all nuclei (Qian et al. 1997), and free neutrons (), and electron-type antineutrino capture () for free protons. These latter two neutrino interactions predominantly control the electron fraction, Ye, during r-process nucleosynthesis. Neutron emission after neutrino-induced excitations can occur. For very neutron-rich nuclei, up to several neutrons can be emitted. We also included these processes following the method of Meyer et al. (1998).
It is noteworthy that the previous r-process calculations of Meyer et al. (1992), and Woosley et al. (1994) had the additional complexity that the seed abundance distribution was first calculated by using a smaller network for light-to-intermediate mass elements, and then the result was connected to another r-process network in a different set of calculations. This separation was imposed because it was thought to be numerically more efficient to run the -process and the r-process separately. However it was perhaps more difficult to interpret the whole nucleosynthesis process. Our nucleosynthesis calculation is completely free from this complexity. We have exploited a fully implicit single network code which is applied to the whole sequence from NSE to the -process to the r-process.
3 Neutrino-Driven Wind Model
3.1 Hydrodynamic Simulation
Our present purpose is to illustrate the differences between calculations in our extended network and those of the generally employed smaller network. For purposes of this illustration the details of the wind model employed are not particularly important. We choose a model, however, which is both derived from a ”realistic“ hydrodynamic simulation and one which exemplifies the possible effects.
As a model for the expanding material, we employ results from the numerical simulation of the neutrino-driven winds of Sumiyoshi et al. (2000). After the supernova core bounce, the proto-neutron star emits an intense flux of neutrinos during a Kelvin-Helmholtz cooling phase. Some of those neutrinos heat the surface material of the proto-neutron star. The surface is gradually ejected from the neutron star, forming a neutrino-driven wind. Qian and Woosley (1996) and Otsuki et al. (2000) have studied such winds above the proto-neutron star by solving the steady-state hydrodynamical equations including neutrino heating and cooling. Otsuki et al. (2000) have included a general-relativistic treatment. They obtained the time evolution of the ejected material for a series of different neutrino luminosities and proto-neutron-star models. They deduced that the wind models with a short dynamic time scale lead to successful r-process nucleosynthesis even for an entropy of S/kB . This is less than that required by Woosley et al. (1994). Sumiyoshi et al. (2000) have confirmed this finding in their fully general-relativistic hydrodynamical simulations without the approximation of steady-state flow for the neutrino-driven wind.
The adopted wind model in the present illustration will consist of a single trajectory which produces significant heavy-element abundances. It thus, has a very short expansion time scale, s, because of the intense neutrino flux assumed and general relativistic effects. The average energy of electron-type neutrinos is set equal to MeV. For electron-type antineutrinos it is MeV, and for - and -neutrinos and anti-neutrinos it is MeV. This is the same as has been adopted in previous simulations (Qian and Woosley 1996; Otsuki et al. 2000). The total neutrino luminosity is taken to be erg s-1.
Regarding our adopted time scale, it has been proposed, e.g. Meyer & Brown (1997) that for a sufficiently fast time scale in the wind, the neutrons and protons may not completely reassemble to form alpha particles. The -process might then be facilitated by proton captures instead of beta decay. We note that the time scale considered here is still sufficiently slow that no significant proton abundance contributes to the r-process. A study of this effect would require a time scale at least of order 5 times faster than the one adopted here. Such a study would also require the implementation of many proton capture reactions for intermediate-mass nuclei which is beyond the scope of the present network calculation.
3.2 Neutron-Star Mass
Nucleosynthesis in the r-process is strongly dependent on the gravitational mass of the proto-neutron star (Wanajo et al. 2001). Therefore, one can think of the neutron star mass as a parameter to be adjusted to give good r-process yields. A short expansion time is required to obtain a large neutron-to-seed ratio at moderate entropy. In our trajectory this expansion time is obtained by adopting a large neutron-star gravitational mass () and a neutron-star radius of km. Although, this mass is large compared with the ”standard” model, an ideal condition for successful r-process could also have been obtained with relatively rapid expansion time scale being preserved, for example, by altering the outer boundary conditions in the hydrodynamic model. Hence, one should not be too dismayed at this large neutron-star mass.
Furthermore, although a neutron-star mass of is large, there are established equations of state (Shen et al. 1998, Weber 1999, Sumiyoshi et al. 1995) which can stabilize neutron stars having masses up to . This is also still consistent with observed constraints on the maximum neutron star mass ranging (Thorsett et al. 1993). There is also other observational evidence supporting the existence of massive neutron stars. Massive supernovae are believed to have massive iron cores and to leave massive remnants (Turatto 1998). SN1994W and SN1997D are presumed to be due to massive progenitors because the detected 56Ni abundance is low (Sollerman et al. 1998, Turatto 1998).
Incidentally, a large dispersion in the heavy element abundances of halo stars has been observed (McWilliams et al. 1995, Ryan et al. 1996). Using an inhomogeneous galactic chemical-evolution model, Ishimaru and Wanajo (1999) have shown that this observed dispersion could be a natural consequence of r-process nucleosynthesis in supernovae of massive progenitors. Such progenitors could conceivably have large core masses.
3.3 r-Process Initial Conditions
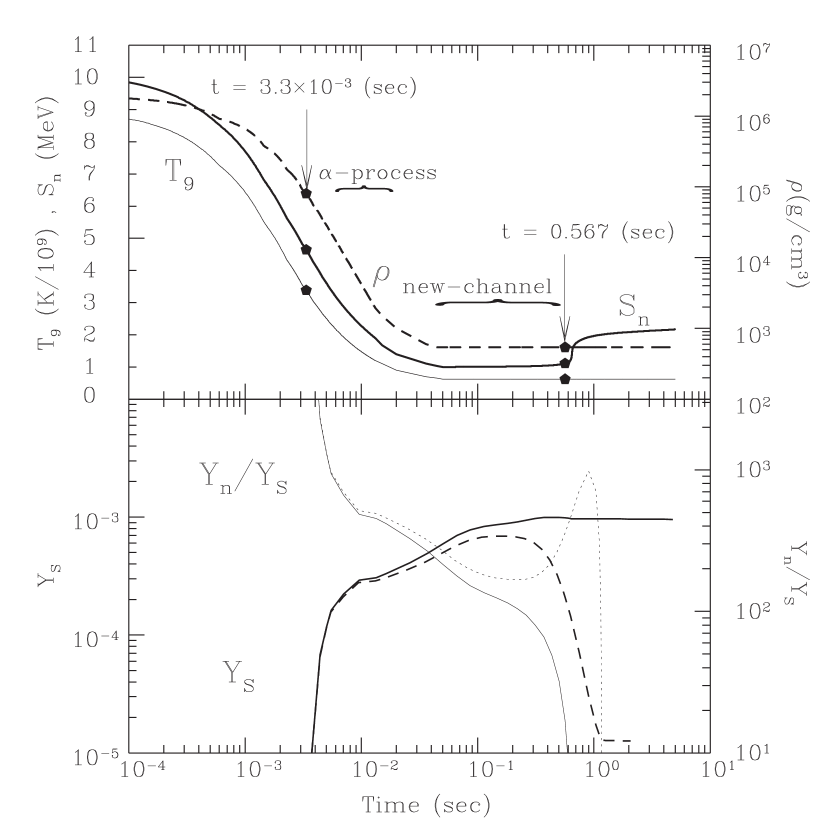
We start the r-process network calculation at a time when the temperature has dropped to T. We display the time variation of the temperature (thin solid curve) and mass density (dashed curve) in the top panel of Figure 2. Time t s refers to the time at which T. From this point the temperature drops very rapidly and then becomes almost constant at around T. The initial composition of the material is taken to be free neutrons and protons with an electron fraction of Ye () = . This was taken from the hydrodynamical simulation of Sumiyoshi et al. (2000).
4 Results
Once equilibrium between (n, ) and (, n) reactions is obtained, the neutron-capture flow path runs through nuclei with almost the same Sn-value along the nuclear chart. The r-process path strongly depends on what Sn-value is favored by the neutrino-driven winds. The optimal single-neutron separation energies, Sn, assuming (n, ) equilibrium, are given by
| (1) |
where is the total mass density of material in the expanding neutrino-driven wind (in units of g cm-3), and Yn is the neutron number fraction. The calculated Sn value along r-process path is shown by the thick solid curve in the top panel of Figure 2. We take the time evolution of T9 and from the wind model of Sumiyoshi et al. (2000), and the Yn-value is calculated using the present ”full network” code. A typical Sn-value at freezeout is in the literature. However, in the present wind-model analysis, the calculated Sn-value is MeV (Figure 2). This is because the expansion model has a short dynamic time scale and the material in the neutrino-driven wind is very neutron rich.
Since T9(t), (t) and Yn(t) depend on time, Sn also varies with time. Sn first decreases rapidly due to the expansion of the wind while the -process operates at high temperatures 2 T9. The arrow at t = s indicates a typical time at which the + n or triple reaction produces seed nuclei. It eventually reaches S 1 MeV at around t 20 ms, and stays almost constant until the r-process freezes out, i.e. when the time scale for neutron capture becomes longer than that of the -decay. After the freezeout at t 0.7 s, free neutrons are exhausted, and the nuclear reaction flow -decays towards the stability line. Therefore, Sn quickly rises though the temperature remains almost constant.
We show the calculated seed abundance, YS, and the neutron-to-seed abundance ratio, Y, as a function of time in the lower panel of Figure 2. YS is defined as the sum of the number abundance fractions of intermediate-to-heavy mass elements Y YA (). The solid and dashed curves respectively display the results calculated in the ”full network” and the ”small -network” codes. We also show in Figure 3 the calculated final abundance yields of the r-process elements for this trajectory. Also shown for comparison are the relative solar r-process abundances from Kppeler et al. (1989).
When we use the ”full network” code, this particular trajectory happens to more or less reproduces the r-process abundance peaks near A 80, 130 and 195. In the case of the ”small -network” code, light-mass elements with A 150 are underabundant. The purpose of this illustration, however, is not to argue that this is a better model for the r-process. Indeed, in most models the challenge has been to provide enough neutrons per seed. Here we see that the flow to heavier nuclei is considerably diminished in the expanded network. Thus, for most r-process models, this expanded reaction network, as necessary as it may be, may actually make a bad situation worse.
This contrast between the two calculated results can be traced to drastic changes in the seed production. As shown in the lower panel of Figure 2, YS is continuously supplied at 10 ms t in the ”full network” calculation. In the ”small -network” calculation, however, the seed production tends to diminish after 300 ms and completely stops well before freezeout. This suggests that a new nuclear reaction flow to seed material must exist in the ”full network” which manifests itself at late times. This new channel sustains a high abundance level of seed elements and dominates the reaction flow throughout the r-process even up to the freezeout time.
5 Reaction Flows
Having identified that the production of seed material is quite a bit different in the two network calculations it is important to now analyze the critical reaction flows in detail as a fluid element expands through the wind. For this analysis we consider two times during the evolution. One corresponding to the process conditions early in the wind, and one corresponding to the later -process conditions. These two selected times are indicated by arrows and dots on the top panel of Figure 2.
Figure 4 shows the nuclear reaction flow at t = s. ¿From the lower panel on Figure 2 one can see that the seed abundance is just starting to form at this time in the wind. This is the start of -process. This is to be compared with Figure 5 which shows the flow at t = s corresponding to near the end of the r-process as identified on the bottom panel of Figure 2.
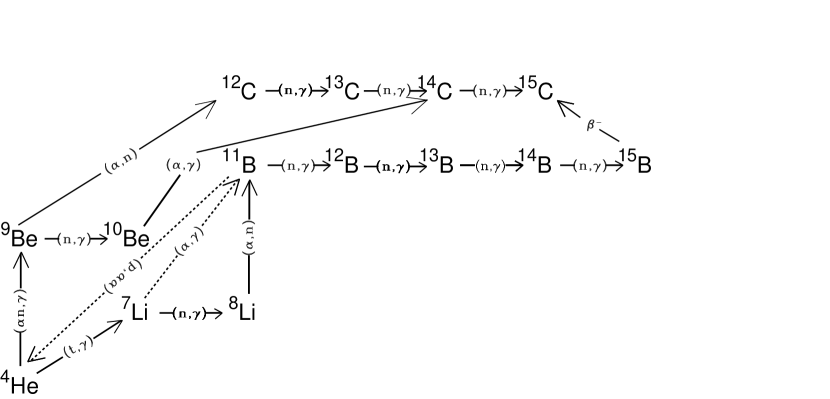
In Figures 4 and 5, the relative abundances for Z in the N-Z plane are shown by circles whose diameters are proportional to the logarithm of the abundance yields Y as indicated. Small dots denote the network range adapted in the present study: The ”full network” is used in the calculated results shown in the upper panels (a) of Figures 4 and 5, and the ”small -network” in the lower panels (b). The main reaction paths are indicated by arrows. For further clarification, the critical reaction flows to produce carbon isotopes are shown in Figure 6. Once formed, these carbon isotopes quickly convert to heavier seed nuclei. Figure 7 shows the relative abundances of neutrons , protons and alpha particles .
5.1 -Process
¿From Figure 2 we see that the start of the -process conditions of Figure 4 (at t = s) corresponds to T, and g cm-3. At this point the nuclear statistical equilibrium is just shifting to produce a large abundance of particles, as evidenced on Figure 7. At early times up to nearly s, the flow through the large and small networks are quite similar. In both Figures 4(a) and 4(b) that there are abundant nuclei around the -stability line even in our ”full network” calculations and the main path resides inside the network range of the ”small -network” for Z (see Figure 4(b)).
For -process conditions the main reaction flow is triggered by the upper path in Figure 6, i.e. the or C reaction. The importance of this path was pointed out by Woosley and Hoffman (1992) and Woosley et al. (1994). Although the side flows of and also involve appreciable nuclear reaction flow, the subsequent reaction returns this flow back into -particles as indicates by the dashed arrows in Figure 6. Thus, although there are plenty of protons as well as neutrons and -particles present at this time (cf. Figure 7), three-body and alpha-capture reactions of stable nuclei are more efficient than neutron captures at this relatively high temperature T. This is generally the case in the early epoch of the trajectory because both the temperature and density are still high enough for these reactions to occur. Therefore, we find very similar reaction paths in the two different network ranges shown in Figures 4(a) and 4(b). A few new paths are evident in the full network, e.g. 9Be)10BeC, and 14CC(O. These, however, make very little difference.
We have included the possible three body two-neutron capture reactions (Efros et al. 1996) such as 4HeHe and 6HeHe, and so on as shown in Figure 1. No significant flow was observed through this channel either at this time or later in the evolution. However, some two-neutron channels may important in heavier nuclei as described below.
5.2 -Process
Once seed material has begun to assemble by s (cf. Figure 2) some production of -process nuclei begins. As the temperature and density of a fluid element diminish, charged-particle reactions become progressively slower and eventually neutron capture becomes more important. A classical r-process-like flow, i.e. (n,) and ,n) reactions followed by beta decay, starts.
Differences in the reaction flow between the two networks become apparent immediately. One can identify two characteristic features of the light element abundances on Figure 7. One is that the alpha abundance is almost the same, but is a little lower in the full network calculation (by about 1 percent). Since alpha particles are the most abundant nucleus, this small difference of Y has an influence on heavy element production. The other is that the neutrons are exhausted earlier in the full network calculation. The flow at t = s shown in Figures 5(a) and 5(b) corresponds to just before freezeout at the end of the -process when the material in the wind has cooled to T, and the density decreased g cm-3.
The differences between the two network calculations can be traced to the fact that in the full network the main path runs through very neutron-rich nuclei on the N-Z plane (cf. Figure 5a). The added flow paths mean that both neutrons and alphas are more efficiently converted to seed, as shown in Figure 7. This process is prohibited in the small network (cf. Figure 5b). Hence, their abundance along the trajectory is lower. The presence of more seed material means that neutrons are more quickly exhausted in the wind.
In addition to the -induced reaction chains , there are two main flow paths to form carbon seed present at this time. They are almost equally important. These are the Be-isotope chain and the Li-B chain (see Figure 6). As for the Be-isotope chain, when the reaction is switched off, the reaction flow changes to . We have also studied what happens if the reaction is switched off. In this case, neutron capture on leads to which decays back to . It is to be noted, however, that the results obtained by switching off either new chain are similar to those calculated in the full network. This is because either the Be-isotope chain or the Li-B chain is still very active even if the other chain is turned off. When both new chains are turned off, however, the result is almost the same as that calculated in the small network. The presence of the two new chains in the full network is therefore the main difference between two networks.
As a final remark we point out that we have also studied the time-integrated nuclear-reaction flows. This identifies the most important main flow paths. We carried out numerical calculations in which the thermonuclear reaction rates times number abundances of interacting nuclei were integrated from time zero to the freezeout time of the r-process. These quantities give the total intensity of the nuclear reaction flow passing through each nucleus. We find that the main flow paths are almost the same as those indicated by the arrows in Figure 5 which displays a snap shot at the time t = s. We thus conclude that the main flow paths identified in Figure 5 (a) indicate the significance of the new reaction channels for the production of the final r-process abundance yields.
5.3 Effects of Wind Time Scale and Neutrino Interaction
In a realistic supernova simulation one expects that the expansion time in the wind will differ as the proto neutron star cools and the bubble expands. To identify the conditions at which the expanded full network is important we have run simulations in the full and small network for different expansion time scales. The final abundances calculated by using the full network (solid curve) and the small -network (dashed curve) are summarized in Figure 8. The different time scales of , , and ms correspond to different trajectories obtained in the hydrodynamic supernova model of Sumiyoshi et al (2000). Here we see that there is little difference between the two networks when the expansion time scale is slow. For both networks, the seed build up is too efficient and there is little production of elements for .
We have also studied the effects of neutrino processes (Meyer et al. 1992, Meyer 1995, Fuller Meyer 1995, Qian et al. 1997, McLaughlin et al. 1996) in our full network calculations. Among three wind models which have different time scales ( and ms), only the fastest wind with ms leads to successful r-process nucleosynthesis. The specific neutrino-nucleon collision time scale is given (Qian et al. 1997) by
| (2) |
where is the neutrino luminosity for each species in units of erg/s, is the average neutrino energy, r km is the typical radius of the wind at which the neutrino interactions occur most efficiently in the present model calculations, and is the neutrino-nucleon interaction cross section. Only the fastest wind satisfies , while the other two do not. Because of this fact, the r-process for the wind model with ms is not hindered by the neutrino processes, especially the charged-current interaction process . We can thus conclude that a short dynamic-time-scale model can lead to a successful r-process, as has already been discussed in the literature (Cardall Fuller 1997, Qian Woosley 1996, Otsuki et al. 1999, and Sumiyoshi et al. 2000).
5.4 Comment on Reaction Rates
Although the previous estimate of the cross section for the three-body reaction was presumed to only be good to one order of magnitude (Kajino et al, 2000) due to the two unresolved channel contributions from n and , a recent measurement (Utsunomiya et al. 2001) has confirmed that our adopted cross section (Angulo et al. 1999) in the present calculations is correct to within a factor of two. An exclusive measurement of the cross sections has also been carried out by Mizoi et al. (2000), and a large contribution from the processes producing excited bound states of 11B∗ (Boyd et al. 1992, Gu et al. 1995) have been confirmed. For available nuclear reaction data, reaction rates of (n,) for the other neutron-rich Z nuclei are generally larger than the (,n) and (,) rates, except for and .
Abundance yields of extremely neutron-rich nuclei, 15B, 18C, 23N, 24O, 27F, 28Ne, 35Na, 36Mg, 41Al, 42Si, 43P, etc., exhibit the largest abundances among isotopes for each atomic number Z in the neutron-rich environment of Figure 5(a). These nuclei, except for 18C and 36Mg, are on or near the neutron-drip line (We know that 28Ne is not the most neutron-rich nucleus at Z, however in this mass formula it is). 17B is known to be stable against particle decay, and 19B also is suggested to be stable theoretically, while 16,18B are unstable. 29F and some heavier elements beyond the network range adopted in the present studies are predicted to be particle bound in some theoretical nuclear models. Quite recently, the neutron drip line up to fluorine has been studied by the projectile fragmentation experiments and 31F has proved to be particle stable, while 24,25N, 25-28O (except for 26O) and 30F are unstable (Sakurai et al. 1999). Radiative two-neutron capture reactions, i.e. , may play a significant role in the r-process. In the present calculations we assumed that the (n,) and (,n) reactions are in thermal equilibrium for the first neutron and then the second neutron is subsequently captured. Although inclusion of the (2n,) reactions did not change drastically the final result, these rates are presumed to be lower limit. More elaborated theoretical calculation of the (2n,) reaction has suggested that the di-neutron correlation may increase these cross sections (Kamimura 2001). Photodisintegration reactions of 6He and 8He and their electromagnetic structure also have been studied experimentally (Aumann et al. 1999; Iwata et al. 2000). Extensive measurements of the nuclear properties of heavier neutron-rich nuclei near the drip line, including 17,19B and 29,31F, are yet to be carried out.
At T and g cm-3 in Figure 5(a), most of nuclei on the neutron-drip line satisfy Eq. (1) approximately. However, for carbon and magnesium isotopes, two abundant nuclei 18C and 36Mg are not on the neutron-drip line. The neutron separation energy of 19C is smaller than the value of Eq. (1) for sustaining the steady-state flow at this temperature and neutron density. As a result, even at this low temperature, T, the reaction becomes faster than . Likewise, is faster than . For this reason, the (n,)A() r-process flow is broken before reaching the neutron-drip line. This approximately satisfies the condition represented by Eq. (1) at this time t = s. Precise experimental studies of the reaction rates for the two competing processes vs. and vs. would be highly desirable.
Recent progress at radioactive nuclear beam facilities has provided a remarkable opportunity to study the nuclear structure and reactions of extremely neutron-rich radioactive isotopes. The neutron separation energy of along with its electric dipole distribution has been measured by using the Coulomb dissociation method (Nakamura et al. 1999). A precise determination of this quantity is important because 18C is at a branching point between the and reactions as discussed above. The same technique was applied to find a large deformation of 32Mg (Motobayashi et al. 1995). At t s (in Figure 4(a)), the main nuclear reaction flow still stays near the stability line and does not reach 32Mg. However, by the time t s (in Figure 5(a)), neutron captures by magnesium isotopes form a side flow together with the strongest flow along the sodium isotopes. (See the abundance of magnesium isotopes). At some intermediate time between s and s, this side flow plays an important role. Therefore, a phase transition to large deformation at 32Mg may have a non-negligible effect on the production of seed abundances.
A new magic number N = 16 has recently been found near the neutron drip line (Ozawa et al. 2000), which may also affect strongly the seed abundance distribution because 23N, 24O, and 25F are some of the most abundant nuclei on the main flow path in Figure 5(a). The reaction cross section has been precisely measured from thermal to about 350 keV neutron energies (Wagemans et al. 2001). This study indicates a cross section that is lower by a factor of 23 than that of previous measurements. All of these new experimental studies, as well as future work, will be important in order to clarify the role of light neutron-rich nuclei in the high-entropy r-process.
Before closing this section, we should emphasize that our findings are based on the r-process nucleosynthesis models in neutrino-driven winds with a short dynamic time scale. For example, if we calculate the r-process abundance patterns using the trajectories with the relatively long dynamic time scale adapted by Woosley et al. (1994), the final patterns are almost the same for both the full and small networks. We can understand the reason for this by comparing the dynamic time scale, , with the time scale for the alpha-capture process, . As the value of becomes larger than , there is enough time to make seed nuclei by the alpha-process. Thus, seed nuclei are mainly produced by -captures, and the reactions of light neutron-rich nuclei are unimportant. In the alpha-process, the reaction is the key to make heavy nuclei. Therefore, the value of is regulated by the reaction and is given (Meyer et al. 1992) by
| (3) |
where Yα and Yn are the yields of alphas and neutrons, and is the rate of the reaction. At a typical temperature for the alpha-process, T, we have calculated the values of /. In the short dynamic time scale model, /, whereas / for the model of Woosley et al. (1994) (trajectory 40). Thus, the alpha-process is relatively efficient in the model of Woosley et al. (1994).
6 Summary
We have extended the network for Z nuclei including almost all possible charged and neutron-capture reactions out to the neutron drip line. We have studied the role of the reactions of light neutron-rich nuclei in the r-process, utilizing a wind model of massive SNeII explosions. We find that a new path for the r-process opens in these neutron-rich nuclei from the ”full network” calculations in models with a short dynamic time scale. In our model calculation, the third r-process peak at A is lower, while nuclei around A are more abundant than in the ”small -network” calculations. This is because the available neutrons to make heavy nuclei are diminished by neutron captures on the light seed nuclei from the -stability line to the neutron-drip line. Note that these results are restricted to models with a short dynamic time scale in which the temperature drops rapidly and the alpha-process is relatively unimportant. This result shows that light neutron-rich nuclei could be important in other very neutron-rich situations as well, such as a prompt explosion (Sumiyoshi et al. 2001) or binary-neutron-star mergers.
Thus, we find that light neutron-rich nuclei can play an important role in r-process nucleosynthesis in models with a short dynamic time scale. The yields of even the most neutron-rich isotopes can be abundant along the r-process path.
References
- Angulo et al. (1999) Angulo, C. et al. 1999, Nucl. Phys. A656, 3
- (2) Arlandini, C., Kppeler, F., Wisshak, K., Gallino, R., Lugaro, M., Busso, M., and Straniero, O. 1999, ApJ, 525, 886
- (3) Aumann, T. et al. 1999, Phys. Rev. C59, 1252
- Bethe and Wilson (1985) Bethe, H.A. and Wilson, J.R. 1985, ApJ,295,14
- (5) Boyd, R. N. et al. 1992, Phys. Rev. Lett., 68, 1283
- Cameron (2001) Cameron, A. G. W, Proc. 32nd Annual Lunar & Planetary Science Conf., Abstract No. 1035 (2001)
- Cardall and Fuller (1997) Cardall, C.Y. and Fuller, G. 1997, ApJ, 486, L111
- (8) Caughlan, G. R., and Fowler, W. A. 1988, Atomic Data Nucl. Data, 40, 283
- (9) Efros, V. D., Balogh, W., Herndl, H., Hofinger, R., Oberhummer, H. 1996, Z. Phys. A 355,101-105
- (10) Fuller, G. M. and Meyer, B. S. 1995, ApJ, 453, 792
- (11) Gu et al. 1995, Phys. Lett. B343, 31
- Hilf et al. (1976) Hilf, E. R., von Groote, H. and Takahashi, K. 1976, in Proc. 3rd Int. Conf. on Nuclei far from Stability (Geneva: CERN) 76-13, 142
- (13) Holmes, J. A., Woosley, S. E., Fowler, W. A., and Zimmerman, B. A. 1976, Atomic Data Nucl. Data, 18, 305
- Ishimaru and Wanajo (1999) Ishimaru, Y., and Wanajo, S. 1999, ApJ, 511, L33
- (15) Iwata, Y. et al. 2000, Phys. Rev. C62, 064311
- (16) Kajino, T., and Boyd, R. N. 1990a, ApJ, 359, 267
- (17) Kajino, T., Mathews, G. J., and Fuller, G. M. 1990b, ApJ, 364, 7
- (18) Kajino, T., Otsuki, K., Wanajo, S., Orito, M., and Mathews, G. J. 2000, Few-body Systems Suppl., 12, 80
- (19) Kajino, T., Wanajo, S., and Mathews, G. J. 2001, Nucl. Phys. A, in press
- (20) Kamimura, N. 2001, private communication
- (21) Klapdor, H. V., Metzinger, J., and Oda, T. 1984, Atomic Data Nucl. Data, 31, 81
- Käppeler, Beer, and Wisshak (1989) Käppeler, F., Beer, H., and Wisshak, K. 1989, Rep. Prog. Phys., 52, 945
- (23) McLaughlin, G. C., Fuller, G. M., and Wilson, J. R. 1996, ApJ, 472, 440
- McWilliams et al. (1995) McWilliam, A., Preston, G. W., Sneden, C., and Searle, L. 1995, Astron. J., 109, 2757.
- (25) Meyer, B. S. 1995, ApJ. Lett., 449, 55
- (26) Meyer, B. S. & Brown, J. S. 1997, ApJS, 112, 199
- (27) Meyer, B.S., Mathews, G.J., Howard, W.M., Woosley, S.E., and Hoffman, R.D. 1992, ApJ, 399, 656
- Meyer, McLaughlin, and Fuller (1998) Meyer, B.S., McWilliam, A., and Fuller, G. M. 1998, Phys. Rev. C58, 3696
- (29) Mizoi, Y. et al. 2000, Phys. Rev. C62, 065801
- (30) Motobayashi, T. et al. 1995, Phys. Lett. B346, 9
- (31) Nakamura, T. et al. 1999, Phys. Rev. Lett. 83, 1112
- (32) Orito, M., Kajino, T., Boyd, R. N., and, Mathews, G.J. 1997, ApJ, 488, 515
- Otsuki et al. (2000) Otsuki, K., Tagoshi, H., Kajino, T., and Wanajo, S. 2000, ApJ, 533, 424
- Ozawa et al. (2000) Ozawa, A., Kobayashi, T., Suzuki, T., Yoshida, K., and Tanihata, I. 2000, Phys. Rev. Lett. 84, 5493
- (35) Qian, Y.-Z., Haxton, W. C., Langanke, K., and Vogel, P. 1997, Phys. Rev. C55, 1532
- Qian and Woosley (1996) Qian, Y.Z., and Woosley, S.E. 1996, ApJ, 471, 331
- Ryan et al. (1996) Ryan, S. G., Norris, J. E., and Beers, T. C. 1996, ApJ, 471, 254.
- (38) Sakurai et al. 1999, Phys. Lett. B 448, 180
- Shen et al. (1998) Shen, H., Toki, H., Oyamatsu, K., and Sumiyoshi, K. 1998, Nucl. Phys. A637, 435
- (40) Sneden, C., McWilliam, A., Preston, G., Cowen, J. J., Burris, D., and Armosly, B. J. 1996, ApJ, 467,819
- (41) Sneden, C., Cowen, J. J., Debra, L. B., and Truran, J. W. 1998, ApJ, 496, 235
- (42) Sneden, C., Cowen, J. J., Ivans, I. I., Fuller, G. M., Burles, S., Beers, T. C., and Lawler, J. E. 2000, ApJ, 133, 139
- Sollerman, Cumming, and Lundqvist (1998) Sollerman, J., Cumming, R.J., and Lundqvist, P. 1998, ApJ, 493, 933
- (44) Sumiyoshi, K., Oyamatsu, K. and Toki, H. 1995 Nucl. Phys. A, 595, 327
- Sumiyoshi et al. (2000) Sumiyoshi, K., Suzuki, H., Otsuki, K., Terasawa, M. and Yamada, S. 2000, Publ. Astron. Soc. Japan 52, 601
- (46) Sumiyoshi, K., Terasawa, M., Kajino, T., Mathews, G. J., Yamada, S. and Suzuki, H. 2001, submitted to ApJ
- (47) Tachibana, T., Yamada, M. and Yoshida, Y. 1990, Prog. Theor. Phys. 84, 641
- (48) Tachibana, T., Yamada, M., Proc. Inc. Conf. on exotic nuclei and atomic masses, Arles, 1995, eds. M. de Saint Simon and Sorlin, O. 1995, p.763
- (49) Thielemann, F.-K., Metzinger, J., and Klapdor, H. V. 1983, A & A, 123, 162
- (50) Takahashi, K., Witti, J., and Janka, H.-Th. 1994, A & A, 286, 857
- Thorsett et al. (1993) Thorsett, S. E., Arzoumanian, Z., McKinnon, M. M., and Taylor, J. H. 1993, ApJ, 405, L29
- Turatto et al. (1998) Turatto, M., et al. 1998, ApJ, 498, L129
- (53) Utsunomiya, H. et al. 2001, Phys. Rev. C63, 018801
- (54) Wagemans, J., Wagemans, C., Goeminne, G., Kajino, T., Orito, M., Serot, O., Loiselet, M., and Gaelens, M. 2001, in preparation.
- Wanajo et al. (2000) Wanajo, S., Kajino, T., G. J. Mathews, and Otsuki, K. 2001, ApJ, 554, 578 (2001)
- (56) Weber, F. 1999, J. Phys. G: Nucl. Part. Phys., 25, R195
- (57) Witti, J., Janka, H.-Th., and Takahashi, K. 1994, A & A, 286, 841
- (58) Woosley, S. E., Fowler, F. A., Holmes, J. A. and Zimmerman, B. A. 1975, Tables of Thermonuclear Reaction Rate Data for Intermediate Mass Nuclei (OAP-422), unpublished.
- (59) Woosley, S. E., Fowler, W. A., Holmes, J. A., and, Zimmerman, B. A., 1978, Atomic Data Nucl. Data, 22, 371
- Woosley and Hoffman (1992) Woosley, S.E. and Hoffman, R.D. 1992, ApJ, 395, 202
- (61) Woosley, S. E., Wilson, J. R., Mathews,G. J., Hoffman, R. D., and Meyer, B. S. 1994, ApJ, 433, 229
| Z | Amin | A | A |
|---|---|---|---|
| H | 1 | 3 | 3 |
| He | 3 | 4 | 4 |
| Li | 6 | 7 | 9 |
| Be | 7 | 9 | 12 |
| B | 8 | 11 | 15 |
| C | 11 | 14 | 20 |
| N | 13 | 15 | 23 |
| O | 15 | 18 | 24 |
| F | 18 | 20 | 27 |
| Ne | 19 | 28 | 28 |
| Na | 22 | 35 | 35 |
| Mg | 23 | 38 | 38 |
| Al | 26 | 41 | 41 |
| Si | 27 | 42 | 42 |
| Am | 241 | 279 | 279 |