Haifa 32000, Israel
2. Theory Division, CERN, CH-1211 Geneva 23, Switzerland
On the Optical and X-ray Afterglows of Gamma Ray Bursts
Abstract
We severely criticize the consuetudinary analysis of the afterglows of gamma-ray bursts (GRBs) in the conical-ejection fireball scenarios. We argue that, instead, recent observations imply that the long-duration GRBs and their afterglows are produced by highly relativistic jets of cannonballs (CBs) emitted in supernova explosions. The CBs are heated by their collision with the supernova shell. The GRB is the boosted surface radiation the CBs emit as they reach the transparent outskirts of the shell. The exiting CBs further decelerate by sweeping up interstellar matter (ISM). The early X-ray afterglow is dominated by thermal bremsstrahlung from the cooling CBs, the optical afterglow by synchrotron radiation from the ISM electrons swept up by the CBs. We show that this model fits simply and remarkably well all the measured optical afterglows of the 15 GRBs with known redshift, including that of GRB 990123, for which unusually prompt data are available. We demonstrate that GRB 980425 was a normal GRB produced by SN1998bw, with standard X-ray and optical afterglows. We find that the very peculiar afterglow of GRB 970508 can be explained if its CBs encountered a significant jump in density as they moved through the ISM. The afterglows of the nearest 8 of the known-redshift GRBs show various degrees of evidence for an association with a supernova akin to SN1998bw. In all other cases such an association, even if present, would have been undetectable with the best current photometric sensitivities. This gives strong support to the proposition that most, maybe all, of the long-duration GRBs are associated with supernovae. Though our emphasis is on optical afterglows, we also provide an excellent description of X-ray afterglows.
Key Words.:
gamma rays bursts, supernovae, optical afterglow, X-ray afterglow1 Introduction
Our information about the once totally mysterious gamma-ray bursts (GRBs) has increased spectacularly in the past few years. The rapid directional localization of gamma-ray bursts by the satellites BeppoSAX (e.g. Costa et al. 1997), Rossi (e.g. Levine et al. 1996) and by the Inter-Planetary Network (IPN) of the spacecrafts Ulysses, Konus-Wind and NEAR (e.g. Cline et al. 1999) led to a flurry of progress: the discovery of long-duration GRB afterglows (Costa et al. 1997; Van Paradijs et al. 1998); the discovery of the GRBs’ host galaxies (Sahu et al. 1997a); the measurement of their redshifts (Metzger et al. 1997b) that verified their cosmological origin (e.g. Paczynski 1986; Meegan et al. 1992); the identification of their birthplaces —mainly star formation regions in normal galaxies (e.g. Paczynski 1998; Holland and Hjorth 1999)— and the first evidence for a possible association between GRBs and supernova explosions (Galama et al. 1998a).
The enormous isotropic energies inferred from the redshifts and fluences of GRBs and their short-time variability have indicated that the GRBs must be produced by gravitational stellar collapse (Goodman et al. 1987, Dar et al. 1992). The prevalent belief is that they are generated by synchrotron emission from relativistic fireballs produced by mergers of compact stars (Paczynski 1986; Goodman 1986; Goodman et al. 1987), by hypernova explosions (Paczynski 1998), or by relativistic “firecones” (e.g. Rhoads 1997, 1999) from collapsars or failed supernovae (Woosley 1993; Woosley & MacFadyen 1999; MacFadyen & Woosley 1999; MacFadyen et al. 2001). But various observations, including in particular the ones we shall extensively discuss here, strongly suggest that most of the long-duration GRBs are produced in supernova events (Dar & De Rújula 2000a and references therein) by highly collimated superluminal jets (e.g. Shaviv & Dar 1995; Dar 1997; Dar & Plaga 1999).
Various authors (e.g. Rhoads 1997, 1999; MacFadyen and Woosley 1999; Sari et al. 1999) have merged the notion that GRBs are produced by highly relativistic jets (e.g. Brainerd 1992; Woosley 1993; Shaviv & Dar 1995; Dar 1997; Dar 1998a; Dar & Plaga 1999) with the popular fireball models of GRBs (see, e.g. Piran 1999 and references therein) to morphe the concept of “firecones” or similar denominations. Firecone considerations are used to analyze “breaks” in GRB afterglows (Rhoads 1997, 1999; Sari et al. 1999; Frail et al. 2001) and to extract properties of the GRB engine and ejecta (Frail et al. 2001, and references therein). The fireball idea that all radiation from GRBs originates from colliding shocks is certainly interesting and worth studying. But, concerning the evolution of AGs, the idea remains essentially untested, given the cavalier treatment it has received in much of the recent literature. In Section 2 we explain this harsh opinion.
In recent papers the idea of jetted, supernova-associated GRBs was made entirely explicit with the introduction of a relativistic cannonball (CB) model of GRB production in supernova explosions (Dar & De Rújula 2000a, 2000b, 2001a, 2001b, hereafter DD2000a, etc.). The CB model is completely different from the firecone scenarios, as we explain in Section 2. The CB model, we contend, explains the main observed features of long-duration GRBs and of their afterglows. In particular, in DD2000b, we have demonstrated that the CB model predicts the temporal and spectral properties of the bursts of -rays correctly.
In this paper we derive the detailed predictions of the CB model for the GRB optical afterglows (AGs), which we only sketched in DD2000a. We compare the predictions, which are analytic in fair approximations, with the observed optical AG of all the GRBs with known redshift. We show that the CB model describes remarkably well these optical AGs, as well as the measured X-ray AGs of these GRBs.
Our detailed analysis of the AGs allows us to show how the nearest eight GRBs with measured redshift show varying degrees of evidence of an association with a supernova (SN) akin to SN1998bw: superimposed on the smooth AG of these GRBs one can discern the light curve of SN1998bw, adequately translated and red-shifted in luminosity distance, time-dependence and spectrum (e.g. Dar 1998b; DD2000a). In all other cases, either there are no late-time measurements of the optical AG, or the SN contribution is too dim to be resolved from the late GRB afterglow or the host galaxy light, even by the HST or the most powerful ground-based telescopes.
In spite of the fact that we use similar vocabulary in what concerns the GRB engine (which is quite irrelevant to the AG properties discussed here) the CB model is completely different from the collapsar model of GRBs (Woosley 1993; Woosley & MacFadyen 1999; MacFadyen and Woosley 1999; MacFadyen et al. 2001). The crucial differences are explained in DD2000a and DD2000b. One of them is that we use empirical facts as our guiding line, rather than the results of simulations that fail to explode SNe and lack a proper treatment of features that are no doubt relevant (relativistic dynamics, angular momentum and its transport, magnetic fields). Concerning AGs, the CB model does have a predecessor, the “plasmoid model”, of Chiang & Dermer (1997). The CB model, however, differs in many crucial details; it is more complete and, unlike the plasmoid model, it is very successful in describing the observations.
We devote sections 3 to 6, to make the paper self-contained, to a brief review of the CB model. The novel theoretical core of the paper is in sections 7 to 10. We propose there, in particular, a simple mechanism governing the pace of radial expansion of a CB. The mechanism naturally explains the fact, observed in quasar and microquasar ejections, that cannonballs, faithful to their name, essentially stop expanding at some point of their voyage. We also derive predictions, which turn out to be in disagreement with observations, for the case of CBs that would continuously expand in an inertial manner. The remaining sections are devoted to the description of the AG data in the CB model, to a detailed comparison with observations, which turns out to be extremely successful, and to the extraction of conclusions.
Three GRBs deserve special mention in their CB model interpretation. GRB 980425 turns out to be entirely “normal”, it is uncommonly near () but its emitted CBs are observed at an unusually large angle, giving it a normal -ray fluence. This interpretation (DD2000a) is strengthened by the fact that we successfully predict its optical AG (dominated up to 20 months by SN1998bw) from its X-ray AG, which is entirely due to the CBs, and normal. GRB 970508 has an extremely peculiar AG light curve, which can be easily explained, but only if its CBs encountered a significant jump in density as they moved through the ISM. There are uncommonly early data on the optical AG of GRB 990123, which fit the expectations for CBs that are moving through the wind of the parent star, in its Wolf-Rayet phase.
2 Uses and abuses of fireballs
In this section we place the CB model of GRB afterglows in the perspective of the generally accepted views on the subject, which are based on the “fireball” model and on modifications thereof. This serves a double purpose: it clarifies how completely different the CB model is from the fireball ones, and it shows how unconvincing a fraction of the fireball literature is.
In the fireball model, reviewed in Piran (1999, 2000) and Meszaros (2001), both the -rays and the AG of a GRB are made by synchrotron radiation in inward- and outward-moving shocks, which are produced as relativistically expanding shells collide with each other and with interstellar material. The attitude is often espoused that the actual engine producing these colliding ejecta need not always be explicitly discussed. The possibility that the ejecta may not be spherically distributed has been repeatedly studied in the literature, but, in the fireball model, this was not done in detail prior to the influential papers of Rhoads (1997, 1999), who predicted abrupt breaks in the power law of the AG light curves. With the advent of GRB 990123, with its record equivalent spherical energy (see Table I) and an AG light curve through which it is possible to draw a broken power law (e.g. Figs. 1–4 of Holland et al. 2000a) the fireball advocates (see, e.g. Frail et al. 2001) adopted the arguments in favour of collimated GRBs (e.g. in the case of GRBs from quasars, Brainerd 1992; in the case of a funnel in an explosion, Meszaros & Rees 1992; and in the case of jets in gravitational collapses, Shaviv & Dar 1995, Dar 1997, Dar 1998a; Dar & Plaga 1999, DD2000a and references therein). So have fireballs evolved into “collimated fireballs”, “firecones” or “conical fireball jets”, while maintaining the “fire” lineage.
Consider first a proper (i.e. spherical) fireball expanding in a homogeneous (or spherically symmetric) medium. A conical section of this fireball would expand as a fixed-angle cone: a firecone. Consider next material that is ejected with a conical distribution. If the cone expands laterally at a transverse velocity , its opening angle, as viewed from the origin of the ejecta, increases with time. As illustrated in Fig. (1a) the edges of the material describe a trumpet-shaped curve, not a fixed-aperture cone, as some of the names given to it may induce one to think. We call these “firecones” or “conical fireball jets” firetrumpets, since, for , that is what they are.
Let be the Lorentz factor of the ejecta, that diminishes with time as they collide with ambient material. The light emitted by an element of a firetrumpet’s surface is collimated by its motion into an angle of aperture . If were constant, the firetrumpet’s opening angle would vary as:
| (1) |
At the time at which , the angle of emission of light becomes broader than the angle of the cone (Rhoads 1997, 1999). Thereafter the forward light-collimation is less efficient, an on-axis observer would see up to the edge of the cone, and no longer an increasing fraction of the ejecta (Meszaros et al. 1999). At early times , the lateral expansion of the firetrumpet may not be important and the ejecta’s deceleration as it plunges through constant-density material results —as it would for a fixed-angle cone— in , with the travelled distance, while at later times . Rhoads assumes that these two transitions occur at the same time () and that they are abrupt, leading to a break: a sudden increase in the index of an AGs’ power-law evolution, . The break-time is estimated as the time at which a cone which is not laterally expanding decelerates to .
Sari et al. (1999) change some of the parameters used by Rhoads (notably to ) and invert to obtain :
| (2) |
where is the local density in cm-3 and is the ejecta’s energy in erg units.
While these theoretical developments were taking place, more than a dozen (mainly R-band) optical AGs were being observed. They did not have abrupt breaks. The observers (GRB 990123: Fruchter et al. 1999a, Castro-Tirado et al. 1999b, Kulkarni et al. 1999; GRB 990510: Stanek et al. 1999, Harrison et al. 1999, Israel et al. 1999; GRB 990705: Masetti et al. 2000; GRB 991208: Castro-Tirado et al. 2001; GRB 991216: Halpern et al. 2000a; GRB 000301c: Sagar et al. 2000b, Jensen et al. 2000; GRB 000418: Berger et al. 2001; GRB 000926: Fynbo et al. 2001, Sagar et al. 2001a; GRB 010222: Masetti et al. 2001, Stanek et al. 2001) fitted the slow steepening of AG fluences to phenomenological formulae such as:
| (3) |
which interpolate between two power laws with a tunable “abruptness” , often set at . The values of extracted from these fits, and their distributions, have no clear meaning, since different groups use different parametrizations, and none of them is theoretically justified.
Moderski et al. (2000), Huang at al. (2000a,b), Kumar & Panaitescu ( 2000) and Panaitescu & Kumar (2001) have modelled the light emitted by a firetrumpet without some of the approximations introduced by Rhoads. The evolution of the ejecta’s deceleration is treated continuously. The emission is computed from isochronous points in the firetrumpet, so that light simultaneously received is light that had been simultaneously emitted (lifting the prior “approximation” that the speed of light is infinite). Not having an abrupt break put in by hand, no abrupt break is predicted. The fair conclusion is that the light curves are too smooth to allow for a determination of a break time (Moderski et al. 2000).
All the firetrumpet advocates place the observer precisely on the jet’s axis, as in Fig. (1a), for no stated reason. It is obvious that the viewing angle is a relevant parameter that cannot be unceremoniously dismissed. In particular a non-vanishing viewing angle would contribute to erase even further any trace of a sharp break. Moreover, a distribution of viewing angles would completely erase a possible meaning to the distribution of specific values extracted from expressions such as Eqs. (2) and (3).
The hypothetical firetrumpet ejecta behave in a different way from most of the highly relativistic jets observed in quasars (e.g. radio jets: Bridle 2000; optical jets: Cranc et al. 1993; X-ray jets: Wilson et al. 2000) and microquasars (e.g. Mirabel & Rodriguez 1994, 1999). The ejecta of the real jets, as seen from their emission point up to the point where they eventually stop and expand, generally subtend angles that decrease with time, exactly the opposite of the assumed firetrumpet behaviour of Eq. (1) and Fig. (1a). In the analysis of these real objects (e.g. Pearsons & Zensus 1987; Mirabel & Rodriguez 1994, 1999; Ghisellini & Celotti 2001) it is the angle of observation —and not the angle subtended by the ejecta— that plays a key role.
Frail et al. (2001) use the published values of —fit to expressions such as Eq. (3)— to extract a set of values of . In so doing they use a modified Eq. (2), in which the dependence on redshift and on the efficiency of light production are not overlooked. In this way they reach a series of conclusions that their analysis does not justify.
The firetrumpet model may, to some extent, be correct. We have seen that, alas, the consequences of its basic assumptions have not been properly extracted. In particular, the “anthropo-axial” view that the ejecta of the observed AGs always point to the observer has not been shown to be a fair approximation.
In Fig. (1b) we illustrate the geometry of the CB model. In the AG phase, the CBs are expanding very slowly, or not at all (DD2000a), like the observed ejecta in quasars and microquasars. In contradistinction to the firetrumpet case of Eq. (1), the angle with which the CBs are viewed from the origin decreases with time. But this angle is irrelevant, and negligible relative to the opening angle of the emitted light. The angle at which the ejected CBs are viewed is obviously relevant and we do not set it to zero by fiat.
3 The cannonball model of GRBs
In the CB model, long-duration GRBs and their AGs are produced in core collapse supernovae by jets of highly relativistic “cannonballs” that pierce through the supernova shell. The detailed model is based essentially on the following analogies, hypotheses and explicit calculations:
3.1 Relativistic jets in astrophysics
Astrophysical systems, such as quasars and microquasars, in which periods of intense accretion onto a compact massive object occur, emit highly collimated relativistic jets of plasma. The Lorentz factor of these jets ranges from mildly relativistic: for GRS 1915+105 (Mirabel & Rodriguez 1994, 1999), to quite relativistic: for typical quasars (e.g. Ghisellini et al. 1993), and even to highly relativistic: for PKS 0405385 (Kedziora-Chudczer et al. 1997). These jets are not continuous streams of matter, but consist of individual blobs, or “cannonballs”. (e.g. Kraft et al. 2001). The mechanism producing these surprisingly energetic and collimated emissions is not understood, but it seems to operate pervasively in nature (In Section 7 we propose a mechanism capable of collimating CBs). We assume the CBs to be composed of ordinary “baryonic” matter (as opposed to pairs), as is the case in the microquasar SS 433, from which Lyα and metal Kα lines have been detected (e.g. Margon 1984, Kotani et al. 1996).
3.2 The GRB/SN association
There is mounting evidence for an association of supernova explosions of type Ib/Ic and GRBs (DD2000a). The first example was GRB 980425 (Soffitta et al. 1998; Kippen et al. 1998), within whose error circle SN1998bw was soon detected optically (Galama et al. 1998a) and at radio frequencies (Kulkarni et al. 1998a). The chance probability for a spatial and temporal coincidence is less than (e.g. Galama et al. 1998a), or much smaller if the revised BeppoSAX position (e.g. Pian et al. 1999) is used in the estimate (we shall show that the observed X-rays originate in the CBs of this GRB, and not on the associated SN). The unusual radio (Kulkarni et al. 1998a; Wieringa et al. 1999) and optical (Galama et al. 1998a; Iwamoto et al. 1998) properties of SN1998bw support this association. The exceptionally small fluence and redshift of GRB 980425 make this event very peculiar, though not in the CB model (DD2000a). The energy supply in a SN event similar to SN 1998bw is too small to accommodate the fluence of cosmological GRBs, unless their -rays are highly beamed. SN 1998bw is a peculiar supernova, perhaps because it is observed close to the axis of its GRB emission.
Evidence for a SN1998bw-like contribution to a GRB afterglow (Dar 1999a; Castro-Tirado & Gorosabel 1999) was first found by Bloom et al. (1999a) for GRB 980326, but the unknown redshift prevented a quantitative analysis. The AG of GRB 970228 (located at redshift ) appears to be overtaken by a light curve akin to that of SN1998bw (located at ), when properly scaled by their differing redshifts (Dar 1999b; Reichart 1999; Galama et al. 2000). Evidence of similar associations was found for GRB 990712 (Hjorth et al. 2000a; Sahu et al. 2000; Bjornsson et al. 2001), GRB 980703 (Holland et al. 2000b), GRB 000418 (DD2000a), GRB 991208 (Castro-Tirado et al. 2001) and GRB 990510 (Sokolov et al. 2001a). For the remaining cases in Table I, corresponding to GRBs with larger redshifts, either no late observations of the AG are available, or the expected SN bump is an unobservably small effect. These conclusions will be strengthened by our detailed analysis of AGs in the CB model. All of the nearest GRBs with measured redshifts show various degrees of evidence for a supernova in their AG, suggesting the possibility of an association of all the long-duration GRBs with core-collapse SNe.
3.3 The SN/GRB association
By a SN/GRB association —as opposed to the GRB/SN association we have discussed— we mean the converse statement to that ending the last subsection: that most SNe of certain relatively frequent types may be associated with GRBs. This appears at first sight to be entirely untenable. The total rate of type II/Ib/Ic SNe has been estimated from their observed rate in the local Universe (e.g. Van den Bergh & Tammann 1991) and the star formation rate as function of redshift, to be , or , in the observable Universe (Madau et al. 1998), while the observed rate of GRBs is a mere (see, for example, Lamb 2001).
The bolometric energy fluence from a CB moving with a Lorentz factor and seen by a stationary observer at an angle relative to the CB’s direction of motion (e.g. DD 2000a) is:
| (4) |
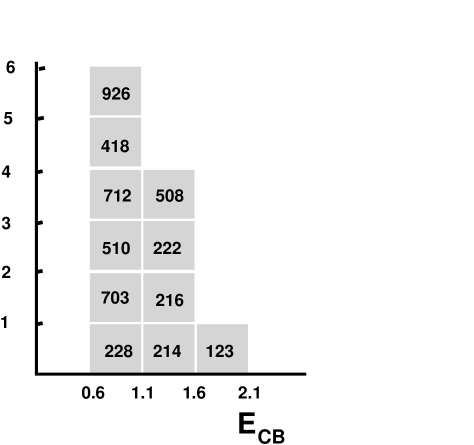
Barring the case of GRB 980425 (whose exceptionality and interpretation we shall discuss) the equivalent spherical energies of the GRBs with measured redshifts, as listed in Table I, range between, approximately, erg (GRB 990123) and erg (GRB 970508). The dependence is the steepest parameter dependence of the CB model (DD2000b). It is therefore reasonable to attribute the range of observed equivalent spherical energies mainly to the dependence (as if GRBs were otherwise approximately standard candles). The observed spread in equivalent energy then corresponds, according to Eq. (4), to a spread of viewing angles between and . Thus the geometrical fraction of GRBs which are observable (with the current or past sensitivity) is approximately , where we have taken two jets of CBs per event. Compare and to conclude that an approximately one-to-one GRB/SN association would require beaming into a solid angle that is a fraction of . For CBs moving with , : precisely the required beaming factor. That is, for a one-to-one SN/GRB association:
| (5) |
in agreement with observation. Moreover, if the recent claims that the dependence of the star formation rate continues to (Fenimore & Ramirez-Ruiz 2000; Ramirez-Ruiz and Fenimore 2000; Reichart et al. 2001) were correct, SN of types Ib/Ic would by themselves suffice to explain the observed GRB rate. Thus, relativistic beaming solves the energy crisis of GRBs and may allow an approximately one-to-one SNIc/GRB association (Dar 1999b; Dar & Plaga 1999; DD2000a). The above considerations leading to a GRB/SN association that may be as biunivocal as indicated by Eq. (5) are weakened by the fact that we have not taken into account effects such as the efficiency of GRB identification as a function of fluence. It is clear, however, that for the high beaming factors we have advocated, the GRB and SN rates are quite comparable. In the CB model, the “special” character of SN 1998bw is due to the fact that it is observed very close to the GRB axis.
Previous analyses of GRB/SN associations, except that in DD2000a, were based on a power-law extrapolation to late times of the early-time GRB afterglows. Here we shall use the CB model, instead, to calculate the GRB-afterglow light curves at all times. This procedure leads, as we shall see, to a much better exposition of the GRB/SN association.
3.4 The GRB engine
We assume that in core-collapse SN events a fraction of the parent star’s material, external to the newly-born compact object, falls back in a time very roughly of the order of one day (De Rújula 1987, DD2000a). Given the considerable specific angular momentum of stars, it settles into an accretion disk and/or torus around the compact object. The subsequent sudden episodes of accretion —occurring with a time sequence that we cannot predict— result in the emission of CBs. These emissions last till the reservoir of accreting matter is exhausted. The emitted CBs initially expand in the SN rest system at a speed , with presumably of the same order as the speed of sound in a relativistic plasma (), or smaller. The solid angle a CB subtends is so extremely small that presumably successive CBs do not hit the same point of the outgoing SN shell, as they catch up with it. These considerations are illustrated in Fig. (2).
3.5 The GRB
From this point onwards, the CB model is not based on analogies or assumptions, but on processes whose outcome can be approximately worked out in an explicit manner. The violent collision of the CB with the SN shell heats the CB (which is not transparent at this point to ’s from decays) to a surface temperature that, by the time the CB reaches the transparent outskirts of the SN shell, is eV, further decreasing as the CB travels (DD2000b). The resulting CB surface radiation, Doppler-shifted in energy and forward-collimated by the CB’s fast motion, gives rise to an individual pulse in a GRB (DD2000b). The GRB light curve is an ensemble of such pulses, often overlapping one another. The energies of the individual GRB -rays, as well as their typical total fluences, indicate CB Lorentz factors of (103), as the SN/GRB association does (DD2000a). In the CB model, unlike in the shocked-fireball models, the photons of the GRB proper are not made by synchrotron radiation which, as we shall see, is subdominant at this stage of the evolution of a CB.
4 Afterglow components
In the CB model, the persistent radiation in the direction of an observed GRB has three origins: the ejected CBs, the concomitant SN explosion, and the host galaxy. These components are usually unresolved in the measured “GRB afterglows”, so that the corresponding light curves and spectra refer to a cumulative energy flux density:
| (6) |
with .
The emission of the GRB’s host galaxy is usually determined from measurements at times late enough for the CB’s afterglow and the SN light to have become comparatively weak (e.g. Sokolov et al. 2001b and references therein). This assumes that the host galaxy’s emission is steady on periods of a few months. There is no indication of GRB host-galaxy variability on such time scales.
Core-collapse supernovae (SNII/Ib/Ic) are far from being standard candles. But if their explosions are fairly asymmetric —as they would be if a fair fraction of them emitted jets of CBs— much of the variability could be a reflection of the varying angles from which we see their non-spherically expanding shells. Exploiting this possibility to its extreme, we shall use SN1998bw as an ansatz standard candle, associated with every GRB of known (Dar 1999b; DD2000a). The adequacy of this bold hypothesis can be judged from its rather surprising success.
Let the energy flux density of SN1998bw be . For a similar SN placed at a redshift :
| (7) | |||||
where is the luminosity distance111The cosmological parameters we use in our calculations are: km/(s Mpc), and . and is the extinction along the line of sight. The extinction in our Galaxy is reasonably well measured, but for the GRBs’ environments it must be estimated from the spectra of each particular AG and host galaxy.
The contribution of CBs to the GRB afterglows requires a much more detailed discussion.
5 Times and frequencies
Four “clocks” ticking at different paces and three different scales of frequency need be considered in the cannonball model of GRBs and their afterglows.
Let be the Lorentz factor of a CB, which diminishes with time as the CB hits the SN shell and as it subsequently ploughs through the interstellar medium. Let be the local time in the SN rest system, the time in the CB’s rest system, the time measured by a nearby observer viewing the CB at an angle away from its direction of motion, and the time measured by an earthly observer viewing the CB at the same angle, but from a “cosmological” distance (). Let x be the distance travelled by the CB in the SN rest system. The relations between the above quantities are:
| (8) |
where the Doppler factor is:
| (9) |
and its approximate expression is valid for and , the domain of interest here. Notice that for large and not large , there is an enormous “relativistic aberration”: , and the observer sees a long CB story as a film in extremely fast motion.
The frequency of the photons radiated by a CB in its rest system, , their frequency in the direction in the local SN system, , and the photon frequency measured by a cosmologically distant observer, are related by:
| (10) |
with as in Eq.(9).
6 The cooling of CBs
As a CB pierces through the SN shell, its surface is heated by the collisions with the shell’s constituents, and cools down from an early maximum temperature because of the decreasing density of the shell’s material it collides with (a detailed description of the CB–shell collision can be found in DD2001b). At this early point of a CB’s avatars, the internal radiation pressure is very large. Thus, in studying the properties of the rays (DD2000b), we assumed the CBs to expand (in their rest system and at early times) at a speed comparable to that of sound in a relativistic plasma (). This fast expansion implies that it is a good approximation to treat CBs, in their rest system, as spherical objects.
Let be the baryon or electron number of the ensemble of CBs in a jet, which we have estimated to be (e.g Eq. (5) of DD2001b, for ), which is close to that of the Earth (). On average, GRBs consist of 5 to 10 significant pulses, so that a single CB may have one order of magnitude fewer constituents. As they exit the shell and enter the interstellar medium (ISM), CBs become transparent to their enclosed radiation when they reach a radius:
| (11) |
where cm2 is the Thomson cross section. We can use Eqs. (8) to conclude that, if the CBs are expanding at a fraction of the speed of light222The quantity is nearly identical to , the transverse speed as the CB exits the SN shell, introduced in our previous work on the CB model (e.g. DD200a,b)., they reach a size in an observer’s time:
| (12) |
For the reference value of in Eq. (11), and , CBs become transparent in a mere s.
The GRB is emitted by the CBs from a distance of radiation length from the exterior of the SN shell, when their temperature is eV and their radius, for our typical parameters, is cm (DD2000b, DD2001b). Soon thereafter, travelling in a thin environment and expanding fast, the CBs should cool in an approximately adiabatic way. Their temperature at is then:
| (13) |
¿From about one third of onwards, the CBs would appear to be “collisionless” to the ISM hadrons piercing through them333ISM particles that get entangled in the CB’s magnetic field would not be collisionless after such a very short time., since the high-energy nucleon–nucleon cross section ( cm2) is about one order of magnitude smaller than and the condition for “transparency” to the ISM particles is, up to a numerical factor of , analogous to Eq. (11).
7 The expansion of CBs
When a CB, in a matter of (observer’s) seconds, becomes transparent to radiation, it loses its internal radiation pressure. If it has been expanding up to that moment at a speed comparable to that of relativistic sound, should it not inertially continue to do so? The fact that it is collisionless makes the conclusion seem unavoidable. But the CBs emitted by many quasars appear, within the resolution of the observations, not to expand laterally for most of their trajectory, before their forward motion nearly stops. What may the reason be?
The ISM the CBs traverse has been previously partially ionized by the forward-beamed GRB radiation. The neutral ISM fraction is efficiently ionized by Coulomb interactions as it enters the CB. In analogy to processes occurring in quasar and microquasar ejections, the bulk of the swept-up ionized ISM particles are multiply scattered, in a “collisionless” way, by the CBs’ turbulent magnetic fields. As illustrated in Fig. (3), in the rest system of the CB these particles are isotropically re-emitted into the ISM. In the rest system of the parent SN they are forward collimated and boosted to an energy (Dar 1998b). The isotropic re-emission implies an inwards force on the CB’s surface. Assume that the bulk of the ISM particles are not re-energized by the CB’s turbulent fields. Let be the CB’s radius and let be the proton ISM number density. The rate at which the ISM protons impinge on the CB is , with the ISM proton density seen from the CB’s rest system. The momentum (or, for large , the energy) of these protons isotropically leaving the CB is, per unit surface,
| (14) |
During the first hours after the GRB time, the CBs are still fully ionized and cooling rapidly by expansion and bremsstrahlung (DD2001a). Their full constituency of relatively cold ions, electrons, cosmic rays and entangled magnetic fields is electromagnetically coupled, and subject to the very large inwards pressure of Eq. (14). This stabilizes the CB’s radius to an asymptotic value . To estimate it, since the initial expansion velocity is not fully relativistic (), we may use Newton’s equation:
| (15) |
with as in Eq. (14), and integrate, to obtain, for a constant444A density distribution falling with distance to the progenitor star as (in a certain distance-domain) gives similar results, but in terms of more parameters. It suffices for the moment to use a constant value representing an average density close to the progenitor, particularly at the considerable distances from the progenitor at which the value of is reached. :
| (16) |
where we have approximated by its initial value because the asymptotic radius, as we shall see, is reached much before the CB has had the time to decelerate significantly. For a value of the ISM density close to the progenitor, , , Eq. (16) gives cm [ cm] for [].
The interval (in the CB’s rest system) between the times when the CB has radius and radius can be deduced from Eqs. (14) and (15) to be:
| (17) |
The observer’s time is shorter by a factor . In Fig. (4) we invert Eq. (17) to show the CB’s radius as a function of observer’s time (in minutes), for , , and the other typical parameters quoted in the previous paragraph, for two choices of . The CB is seen to expand linearly at a speed close to the initial , and then to settle fast into an approximately constant radius. To a good approximation the steady radius is reached in an observer’s time:
| (18) |
which yields minutes for [], the examples in Fig. (4). Thus, typically, a few observer’s minutes after the GRB, the CBs are expanding very very slowly.
To estimate the internal magnetic field of the CB after it stopped expanding, we conjecture that the bulk of the kinetic energy of the CB’s expansion after it becomes transparent is converted to internal magnetic energy. Since and (by hypothesis) , this means:
| (19) |
which, upon substitution of Eq. (16), yields:
| (20) |
The very large field of Eq. (20) is consistent with the fact that, in order to be able to sustain the inwards pressure of the isotropically re-emitted protons that it ejects, the magnetic field within the CB must have a pressure (or energy density) comparable to the pressure of Eq. (14). The condition exactly reproduces Eq. (20). We could also have added the building-up magnetic pressure to Eq. (14), to obtain a result for differing from that of Eq. (20) by . This affects our conclusions insignificantly and, in any case, we cannot pretend to have a detailed understanding of the magnetohydrodynamics of turbulent plasmas.
We have argued that the re-emission of the ISM protons, isotropic in the CB’s rest frame, is what makes CBs stop expanding at a speed that ab-initio was semirelativistic. This may also explain the surprising quasar and microquasar observations. There may be other reasons —such as Coulomb-interaction ram pressure from the ambient material— for CBs to stop expanding significantly at some point of their voyage. The strength of our conclusion that CBs expand slowly —or not at all— during the AG phase should be judged from the ability of the CB model to describe the AG observations.
8 The dominant afterglow mechanisms
In the CB model the GRB emission in rays is mainly of thermal origin (although it does not have a thermal spectrum) and, in a fixed energy interval, it decreases exponentially with time (DD2000b). A few seconds after the last GRB pulse (the last CB), this pseudothermal emission becomes a subdominant effect. For the next few hours, the evolution of a CB is interestingly complicated. In particular, its originally ionized material should recombine into hydrogen and emit Lyman- lines that are seen Doppler-boosted to keV energies (DD2001a). Later, the CBs settle down to a much simpler phase, which typically lasts for months, till the CBs finally stop moving relativistically.
Because of the CBs’ large Doppler factors, radio emission in their rest frame is boosted to optical light in the observer’s frame while their emitted optical light is boosted to the soft X-ray band. Radio emission from astrophysical plasmas at eV temperatures is mainly due to synchrotron radiation from relativistic electrons, whereas their optical glow is usually due to bremsstrahlung and line emission. For parameters in the general vicinity of the ones we have argued to be “typical” of the CB model, the X-ray AG is initially dominated by thermal bremsstrahlung (and line emission) and by synchrotron radiation thereafter, while the optical AG, generally observed later, is dominated by synchrotron radiation. In this section we analyse these two dominant mechanisms, relegating to Appendix 1 the discussion of various subdominant ones.
9 Thermal bremsstrahlung: the early X-ray AG
When it becomes transparent, a CB cools down mainly by thermal-electron bremsstrahlung (TB) in collisions and by expansion. The comoving TB emission rate (e.g. Peebles 1993) is:
| (21) |
where , is the electron density of the CB and, here and in the rest of this section, is its temperature in Kelvin and the remaining quantities are in c.g.s. units. Thus, as long as the CB is fully ionized, its total comoving TB energy-loss rate is:
| (22) |
while its thermal energy is:
| (23) |
with Boltzmann’s constant. As long as TB dominates the cooling and for a constant expansion rate , Eqs. (11, 12, 22, 23) yield for :
| (24) |
A distant observer at an angle relative to the CB’s direction of motion receives this radiation in a Doppler-boosted, collimated and time-aberrant form (e.g. DD2000a). At a luminosity distance , the total power (integrated over frequencies) per unit area is:
| (25) |
where is given by Eq. (9) with the initial value, which does not change in the very short time during which TB dominates the X-ray AG. At the transparency radius and reference baryon number of Eq. (11), the temperature is eV K, as in Eq. (13), and for and , the predicted energy flux, per CB, is . This radiation’s spectrum is that of bremsstrahlung (a flat ), typically extending to keV, in the X-ray domain.
For our typical CB parameters, synchrotron emission takes over, as we shall see in the next section, before the CB reaches its asymptotic radius and before the term in Eq. (24) becomes important. During this early phase (for ), the TB emission by the CB’s electrons declines with time, if cooling is dominated by bremsstrahlung losses, as . Should the temperature decrease be dominated by adiabatic cooling (), the substitution results in and in a TB emission declining as . A decline as fast as or has been observed in early X-ray afterglow observations, e.g. GRB 920723: Burenin et al. 1999; GRB 970508: Piro et al. 1998; GRB 970828: Smith et al. 2001; GRB 990510: Pian et al. 2001; GRB 010222: In ’t Zand et al. 2001. In less than a minute of observer’s time, this emission mechanism is overtaken by synchrotron radiation, whose decline is much slower, as we proceed to discuss.
10 Synchrotron radiation: the optical afterglow
In this section we study the various effects resulting from the interaction of a CB’s entangled magnetic field with the ISM particles that it sweeps as it travels. The CBs lose momentum by sweeping the nuclei of the ionized ISM, and re-emitting them isotropically (in the CB’s rest system) at an energy comparable to their incoming one. This allows us to predict the law of CB deceleration: the behaviour of its decreasing Lorentz factor . The incoming electrons, suffering collisions with the magnetic domains, and losing energy effectively by synchrotron radiation, acquire a predictable power-law energy spectrum, which implies a given distribution of the emitted photons. The emitted energy rate is equal to the rate at which the ISM electrons bring energy into the CB in its rest system; this provides the absolute normalization of the AG light curve. The dynamical time for the energy supply by the swept-up ISM electrons is much longer than the time it takes the electrons to acquire a power-law energy distribution and to emit synchrotron radiation, justifying a quasi-steady-state analysis.
The rate at which the energy of the ISM electrons enters the CB (in its rest frame) is:
| (26) |
where the incident ISM electron energy is , and the extra power of originates in the Lorentz contraction of the ISM electron density, . An observer at a luminosity distance and at an angle relative to the CB’s direction of motion receives a total power per unit area (integrated over frequencies):
| (27) |
At the very early time of CB transparency, for cm, cm-3, and for , , the above expression yields erg/(cm2 s), which is comparable to the bremsstrahlung emission of Eq. (22). But, as we shall see anon, the synchrotron radiation has a much softer spectrum than that of bremsstrahlung, and the latter mechanism dominates at early times in the X-ray domain. We have seen that in a matter of minutes the asymptotic radius of Eq. (16) is reached, so that thermal bremsstrahlung has decreased by more than three orders of magnitude, while the synchrotron radiation has increased by two or more orders of magnitude, to become the dominant emission mechanism at all frequencies.
To estimate a “dynamical time”, , for the energy deposited by electrons in the CB, we forestall that the observed afterglow fluences are the ones expected in the CB model. We can then use Eqs. (26) and (27) to deduce a total typical erg and to conclude:
| (28) |
for cm and cm-3.
In the CB’s rest frame, the light crossing time for the asymptotic radius is s. The time for electrons that enter a CB to redistribute their energy as they bounce off a few magnetic “sub-domains” is a fraction of ; this is much shorter than , so that a cosmic-ray-like “source” distribution of electrons (a power law in energy) is steadily generated. The synchrotron cooling time of electrons in the CB’s rest system is :
| (29) |
In the above equation, we have distinguished (the Lorentz factor of an electron in the CB, in the CB’s rest system) from (the CB’s bulk-motion Lorentz factor). Even for , . The Larmor radius of electrons in a Gauss magnetic field is , so that even for very high energies, the residence time of the electrons in the CB is much longer than . The above inequalities imply that for electrons of all energies, a spectrum of “Fermi-accelerated”, radiation-loss-modulated electrons is steadily generated.
The incoming ISM particles are Fermi-accelerated by the turbulent magnetic fields inside the CBs to a comoving “cosmic-ray” spectral distribution , with , as indicated by simulations (Bendarz & Ostrowski 1998), analytical estimates and the interpretation of the observations of cosmic rays (e.g. Dar & Plaga 1999). The acceleration being due to deflections by magnetic fields, the spectral shape of the “source” distributions of protons and electrons ought to be the same: . The index of the equilibrium electron spectrum, modulated by radiation losses, is one unit higher: (Dar & De Rújula 2001). The emitted synchrotron radiation has a power spectrum with index , so that:
| (30) |
The spectrum of Eq. (30) should roughly extend between two cutoff frequencies, and , that reflect the energy of the incoming electrons and of the maximally accelerated ones. The integrated spectrum of Eq. (27) is proportional to and where is the electrons’ Lorentz factor above which they are in radiative equilibrium. Since the individual frequencies and the limiting frequency all refer to the CB’s rest frame, and are Doppler-shifted by its motion () as in Eqs. (10), the non-frequency-integrated version of Eq. (27) —that is, the predicted spectral energy density for a GRB with a number of CBs— is:
| (31) |
where we used the explicit form of , Eq. (9), is the density along the CB’s trajectory , and the overall normalization is obtained by assuming that relativistic electrons are in radiative equilibrium. The predicted normalization for a GRB is just an estimate, for part of the energy deposited in the CB by ISM protons, as well as a fraction of its magnetic energy, may also be emitted as synchrotron radiation555At very low frequencies, such as those corresponding to radio waves in the observer’s frame, Eq. (31) is expected to break down for a variety of reasons: a deviation of the low-energy electron spectrum from a universal power-law, inverse synchrotron and inverse bremsstrhalung self-absorption, plasma frequency cutoff and the effect of competing mechanisms other than synchrotron radiation which all depend on the exact density profile and ionization state of the CB..
When a “typical” CB, within a minute or two after the end of its GRB, reaches its final radius cm, and for cm-3, , and , Eq. (31) yields erg/(cm2 s), of which erg/(cm2 s) () is in the 2–10 keV X-ray range and erg/(cm2 s) () is in the visible range ( Å Å) corresponding to a spectral flux density of 2 Jansky (8 magnitude!) in the R band. For the next few hours does not change significantly and the X-ray and optical AGs vary as . This variation should in general be a decline, since the CBs are departing from a dense region. Such a decline may have been observed both in the optical band in the case of GRB 990123 (Akerlof et al. 1999), which rose above th magnitude tens of seconds after the GRB’s onset, not far from our estimate with “typical parameters” (this GRB, whose early optical AG we shall discuss in detail, is at , but its initial and are very large, see Table III).
There may be an energy below which the synchrotron cooling time of the electrons in the CB is longer than their acceleration time. If so, the electron spectrum has an index and the synchrotron radiation below a certain frequency would have an index . We have implicitey assumed that this frequency is below the smallest optically observed ones, an assumption that the data generally support.
The flux of Eq. (31) depends on as , roughly the 10-th root of it. The actual value of is therefore quite irrelevant to the optical and X-ray AGs discussed here. In our study of radio AGs (Dado et al. 2002) we find that, in the CB model, is actually the characteristic synchrotron frequency emitted by the electrons that enter the CB with a Lorentz factor (in the CB’s rest frame) , that is , with the Larmor radius in the CB’s magnetic field. The spectral index gradually changes from to at this frequency. For a spectrum with this transition in its power law, Eqs. (31) are to be modified as follows:
| (32) |
The difference between Eqs. (31) and (32) is only relevant to the spectral shape of some very early optical AGs, and to the ensemble of the radio AGs (Dado et al. 2002).
10.1 The density of the Inter-Stellar Medium
The density of ISM protons very close to a GRB progenitor plays a role in determining the asymptotic radius, , of a CB, see Eq. (16). The density of ISM protons along a CB’s trajectory controls, as we shall see, the evolution in time of the CB’s Lorentz factor . This function, and the density of interstellar electrons along the CB’s trajectory, determine, via Eq. (31), the AG properties. Clearly, we must discuss these densities in some detail.
An analysis of historical SNe in the Galaxy (e.g. Higdon and Lingenfelter, 1980), of SNe in the LMC (e.g., Dune et al. 2001) and of SNe in late-type galaxies (Kennicut et al. 1989; van Dyke et al. 1996; Higdon et al. 1998) indicates that % of SNe occur in superbubbles (e.g., Lingenfelter et al. 2001). These are spaces of typical size 0.1 to 0.5 kpc, surrounding star-formation regions, that extend all the way into the galactic halo, and from which the ISM has been swept away by massive-star winds and previous SNe, resulting in an ISM with a low density ( to cm-3) comparable to that in a galactic halo.
At their Wolf-Rayet phase, massive stars that finally produce SNeII/Ib/Ic emit strong winds with typical velocities, , close to , at a typical mass-loss rate a few , over the last yr before the SN event. The density close to an imminent SN is governed by the recent Wolf-Rayet wind and ejections, and declines roughly quadratically with distance as:
till pc, where the density becomes that of the surrounding superbubble (e.g., Ramirez-Ruiz et al. 2000 and references therein).
10.2 Complications simplified
To predict the explicit time-dependence of the AG from a CB, one needs to know , and the ISM density profile, , along the CB’s trajectory. Moreover, the various CBs that produce the different pulses in a single GRB have slightly different physical parameters (baryon number, Lorentz boost) that lead to the differences between the individual -ray pulses of a given GRB. The large powers of the Lorentz and Doppler factors in Eq. (31) favour the contribution of CBs with the largest . Given the extremely small fraction of solid angle that a CB spans as viewed from the SN centre, we do not expect consecutive CBs to hit the SN shell on the same spot (DD2000a). But it is in principle possible that the initial expansion and slowing down of the CBs by the SN shell and the ISM merges several of them into a single leading CB in the AG phase. One seems to be faced with a plethora of parameters and possibilities.
We shall find it sufficient to characterize the various ISM densities that the CB encounters by two constant densities. One of them is the average proton density very close to the parent star, that determines the fast-reached asymptotic radius of the CB. For its reference value we adopt cm-3. The other is the proton or electron density in the superbubble and in the galactic halo, for which we adopt as reference cm-3.
All other putative complications previously quoted are eased by the fact that the times over which AGs extend are much longer than the typical intervals between GRB pulses, so that the AG light curve is the sum of temporally unresolved individual CB afterglows. We can therefore characterize, as in Eq. (31), the AG with the parameters of a single CB, whose actual values would represent a weighted average.
10.3 The slow down of a CB
A CB ionizing and ploughing through an ionized ISM of roughly constant density, would lose momentum at a roughly constant rate, independent of whether the ISM constituents are rescattered isotropically in the CB’s rest frame, or their mass is added to that of the CB. Energy-momentum conservation for a highly relativistic CB of initial mass results in the deceleration law (DD2000a):
| (34) |
The element of travelled distance (for ) is, according to Eqs. (8), related to the observer’s time interval as:
| (35) |
The law governing the CB’s expansion rate is the differential version of Eq. (17), to wit:
| (36) |
The above set of three equations can be integrated numerically for any given , and ISM density along the CB’s path .
We limit our discussion to the case of CBs that, having reached their asymptotic radius, are moving through a constant-density medium, a case for which there are useful analytical expressions for the solution of Eqs. (34), (35) and (36). A constant density is a fair approximation, for, in a very short observer’s time, the CB reaches the distance from the SN at which the density is that of the surrounding superbubble. To estimate this brief time, we may use the initial Lorentz and Doppler factors to obtain:
| (37) |
where we used the typical parameters , and . This constant density approximation is also justified a posteriori by the agreement between our predicted AG light curves and the observed ones.
We have argued that CBs reach a steady radius in a few observer’s minutes. To ascertain the CB’s slow-down law for constant radius and constant ISM density, we may substitute Eqs. (9) and (35) into Eq. (34) and integrate, to obtain:
| (38) | |||
where we have distinguished the average density , close to the parent SN (that determines ) from the density in the superbubble or the outer galaxy. The function of interest, , is the real root of the above cubic equation, that is:
| (39) |
The distance travelled by the CB is given by directly integrating Eq. (34):
| (40) |
The characteristic distance over which the Lorentz factor evolves from to is : roughly 1.3 kpc for and the reference value of in Eq. (38).
In Fig. (5) we show, for and various viewing angles , the AG flux predicted by Eq. (31), with and as in Eq. (39) with the reference value of in Eq. (38). For , and particularly for sufficiently large , the AG curve described by Eqs. (31, 39) shows a very interesting behaviour. Since is a decreasing function of time, the Doppler factor first increases with time, reaches a maximum value at and then declines. An observer initially outside the beaming cone (), sees an AG that initially rises with time. As decreases the cone broadens, and around beaming becomes less efficient, the AG declines.
In Fig. (6) we show the AG flux predicted by Eq. (31), with and as in Eqs. (38, 39), for , cm-3, and for various values of the density close to the progenitor SN. For the smaller , the limiting CB’s radius of Eq. (16) is larger. Consequently the CB, subsequently ploughing through the ISM, loses momentum at a faster pace. The figure shows that this may extinguish the AG very soon after the GRB, which would make it much harder to observe. This effect can also be produced by an increase in the ISM density , relative to the reference choice in Eq. (38), so that the AGs of events not occurring in low-density superbubbles would also be hard to observe. These may be (along with extinction) the reasons why, in some 50% of cases, GRBs appear not to have afterglows.
For late times, when , Eq. (38) implies that . According to Eq. (31), then, the AG light curve approaches:
| (41) |
while the dependence stays put at . This is compatible with what is seen in various late-time AG observations (see e.g. GRB 980326: Bloom et al. 1999a; GRB 980519: Halpern et al. 1999; GRB 990123: Holland et al. 2000a; GRB 990510: Stanek et al. 1999, Harrison et al. 1999, Holland et al. 2000a; GRB 991208: Castro-Tirado et al. 2001); GRB 000301c: Masetti et al. 2000, Jensen et al. 2000; GRB 000926: Fynbo et al. 2001, Harrison et al. 2001, Price et al. 2001; GRB 010222: Masetti et al 2001, Stanek et al. 2001, Cowsik et al. 2001a).
11 Comparison with optical observations
We compare our predictions with raw AG observations, i.e. observations not corrected for extinction. The first step in our procedure is to work out what a raw ansatz-standard-candle supernova, SN1998bw, would look like at the location of each GRB. For that, we use the bare (unextinct) SN1998bw deduced by Galama et al. (1998a), we transport it to the GRB location by way of Eq. (7) and correct it for extinction in the host galaxy and in ours. For the extinction in our galaxy we use the estimates of Schlegel et al. (1998). For the correction at the host (at the emitted frequency ) we use the wavelength-dependent extinction estimated by the observers from the AG spectrum and the colours of the host galaxy. The total extinction of the SN contribution for each GRB’s optical AG is given in Table II.
The next step in our procedure is to fit the raw data minus the SN contribution to a fixed host galaxy luminosity plus the CB’s afterglow. We do not correct the latter for extinction, which only affects its fitted normalization. In the fits, the afterglow’s spectral energy density is given by Eq. (31) with and a constant ISM density, that is:
| (42) |
with a normalization factor which is one of the fitted parameters, and with as in Eqs. (38)666Admittedly, our expression for the AG light curve is not as simple as Eq. (3), but it is also analytical. And it is justified.. The contribution of the host galaxy is fixed inside the error range of the photometry measurements at the late times when the CB and the SN have become sufficiently dim.
The parameters to be fit are and in Eq. (42), as well as , and entering the expressions for and as functions of time, Eq. (39). The fit is done with the program MINUIT, checked over and over (in the hunt of false local minima) with different input parameters. The values of , , and for the different GRB afterglows are listed in Table II, the overall normalization will be discussed separately. The results of these fits, which are very good, are shown in Figs. (7) to (24). Most of them refer to R-band observations, which are the most extensive and accurate ones in the optical band, and extend to very late times. In order to test that our best fitted parameters are independent of frequency we have also fitted other bands, when sufficiently accurate data are available, and obtained very similar best fitted parameters. This can be seen in Table II for GRBs 990510 and 990712, for which we also present V-band fits. Before discussing the results in much more detail in section 13, we pay attention to two very peculiar afterglows, and one particularly well measured one.
11.1 GRB 970508, CBs exiting a superbubble?
The optical AG of GRB 970508 is the only one so far that has been seen to rise and fall very significantly. In Fig. (23) we show how miserably a fit to this GRB fails, if it is made in the same way as all of our other fits.
We have argued in Section 10.1 that GRB progenitors are presumably located in super-bubbles of 0.1 to 0.5 kpc size. There may be instances in which the jet of CBs, after travelling for such a distance, does not continue onwards to a similarly low-density halo region, but encounters a higher-density domain. To test whether this may explain the very peculiar shape of this AG, we have made a fit with two values of the ISM particle-number density, instead of one, and a time (or distance from the progenitor) at which the transition occurs. The result is shown in Fig. (24) and it is fairly satisfactory.
The fit parameters correspond to a density increasing by a factor of at day after burst, at which point the CBs have travelled some kpc, a very reasonable radius for a superbubble. The remaining parameters are in the usual range, but for , which, at mrad, is on the large side. Given this large value and , the time at which is reached exceptionally late; this explains the rise and fall of the theoretical curve; see Dar and De Rújula (2000a) for an earlier version of this result. The relatively large is also in accordance with the fact that, in spite of a relatively large , the equivalent spherical energy of this GRB is particularly low, see Tables I and II.
In an earlier version of this paper, we attributed the shape of the AG of GRB 970508 to the effects of gravitational lensing by an intervening star or binary, of mass . That was an error. The required mass for an object placed mid-way to the GRB location is almost three orders of magnitude bigger. An effect of the observed size and shape could also be due to an even heavier object (such as a globular cluster) kiloparsecs away from the source, but the chance probability for that is negligible. The possibility of lensing by stars —which has a few percent probability and would produce amplification effects typically lasting hour— is still interesting. We discuss it in Appendix III.
11.2 GRB 980425, a very special case?
As reported in Table I, this GRB is by far the closest and yet, its measured -ray fluence is not large. We have argued (DD2000a) that in the CB model this is simply due to the fact that it is observed at a very large : the GRB fluence has the same angular dependence as Eq. (4). The association of this GRB with SN1998bw is clear. In fact, the “afterglow” is dominated by the SN. Only the very last measured AG point is significantly above the decay trend of the SN ejecta and would be due to the proper afterglow: that of the CBs (see Fig. 4 of D2000a). With only one point above the SN “background” we cannot make, in the case of GRB 980425, a detailed fit of the sort we have made for the other GRB afterglows. But, as we shall see after we gain confidence on the success of the CB model in describing X-ray afterglows, we can use the X-ray measurements for this GRB to determine its parameters and to show that, after all, it is not at all a very special case.
11.3 GRB 990123, the early optical data
In the case of this GRB, there are good optical data starting exceptionally early: during the -ray activity at s after its detected beginning (Akerlof et al. 1999). The AG rises abruptly to a second point at s, and decreases thereafter. At the earlier stage, the CB is still hot and fully ionized, its thermal bremsstrahlung (free-free) self absorption is very large and fast decreasing, resulting in a fast rising AG that turns into a declining light curve when the CBs become transparent to short radio waves (corresponding to optical light in the observer frame). It is possible to explain the initial rise in detail, but the scarcity of the data and the surplus of parameters make the exercise moot. We choose to describe this AG from s d onwards, the first point shown of the measured decline and of Fig. (25). We can use the relation between local distance and observer’s time, Eq. (35), and the specific values of , and reported in the Tables for this GRB, to conclude that at the start of the optical AG data the CBs are a mere 0.46 pc away from the progenitor star. This is precisely in the domain where the density profile ought to be that of Eq. (10.1), , induced by the parent-star’s wind and ejecta. Since at these early times the CB’s deceleration is negligible, an density profile translates directly into an optical AG that declines as , see Eq. (31).
In Fig. (25) we report the result of a fit to the AG that includes a term proportional to . The parameters of the late ( d) AG remain essentially unchanged relative to the ones used before in constructing Fig. (11). The normalization of the fitted term is very close to that implied by Eqs. (31) and (10.1): the first point of the data is exactly reproduced for a density at that point, at which pc. Thus, the CB model also succeeds in describing this very early AG in magnitude and shape777Even the most adamant defenders of fireballs admit that, in their scenarios, the absence of “windy” AGs is a problem, see, e.g. Piran (2001)..
12 Comparison with X-ray observations
The CBs enter their AG phase when they become transparent to radiation. As we have seen, their X-ray AG is dominated by thermal bremsstrahlung and first declines with time as , as described by Eqs. (24, 25). In a matter of observer’s minutes, for typical parameters, the CB’s radius reaches its limiting value and the synchrotron radiation of Eq. (31), which is proportional to , becomes the dominant AG source in both the X-ray and optical domains: the corresponding lightcurves are approximately proportional. Once again for typical parameters, a CB reaches the galactic halo in just a few hours. The light curves before that time would be hard to model in minute detail, since the ISM density is no doubt changing rapidly. Coincidentally, there are not enough continuous X-ray measurements during the first few hours after the GRBs to reliably extract a density profile.
The previous considerations justify a very simple description of the X-ray light curves. Let be the (constant) ratio of X-ray to R-band optical AGs. We expect:
| (43) |
where is the observer’s time since the ejection of the (last) CB, and is the spectral energy density in the R-band, i.e., Eq. (31), that we have fitted to the R-band AG observations. The two parameters we fit to X-ray light curves are and , resulting in a very good description of the measured X-ray afterglows of the GRBs of known redshift: 970228, 970828, 971214, 980613, 990123, 990510, 000926 and 010222. The cases of GRBs 970508 and 991216 require a non-constant density profile. The fits to the X-ray AGs are shown in Figs. (26-33). GRB 980425 is discussed separately below.
During a GRB the X-ray luminosity fluctuates as the -ray luminosity does, changing abruptly at the end of the GRB into a very fast decline. This is expected in the CB model, in which the two behaviours have slightly different origins: thermal bremsstrahlung from the various CBs’ surfaces during the GRB, thermal bremsstrahlung from the rapidly cooling CBs’ volumes as they become transparent to the radiation they enclose, in a short time —of the order of seconds— at the end of each individual CB. In Figs. (26-33) we have therefore shown our fits to data beginning at the start of the sharp X-ray decline.
The use in Eq. (43) of a more careful treatment of the bremsstrahlung contribution (evolving from to ) is unwarranted: the assumption of a constant ISM density should be inappropriate between and days, and there are no data in that domain except for GRB 991216 and perhaps 970508 that, like the early optical AG of GRB 990123, suggest an initial density variation , resulting in an observed decline. In these cases, we have fitted the data with Eq. (43) for a plus constant density along the CB trajectory. For the particularly interesting case of GRB 970508, shown in Fig. (34), we have also subtracted from the data the contribution of the X-ray line observed before 0.8 d. This reduces the two points observed between 0.2 and 1 day by a factor . The overall result is compatible with an effect that, at late times, is achromatic, since both the late optical and X-ray AGs are proportional to ; see Fig. (24) for the optical counterpart.
In what follows we refer to the initially rapidly-falling part of an X-ray AG, as “early” and to the subsequent much flatter AG as “late”.
We have chosen to write the prediction for X-rays as in Eq. (43) to better expose the expected achromaticity of the late AG. Moreover, the data for late X-ray AGs is generally more sparse than for optical light; it is therefore advisable to exploit the fact that the CB’s parameters are better fit from the R-band data, and to write the late X-ray AG as a rescaling of that data. But the effects of absorption are much less severe for X rays and there is one parameter, the overall normalization, for which it is preferable to use the X-ray fluence in testing the model. The values of , , , and , fit for each GRB to the R-band AG, are sufficient to deduce, via Eq. (31), the shape —but not the normalization— of the expected late X-ray flux in the 2-10 keV domain. This flux depends, via at fixed , on the number of CBs and their individual baryon number, as (the dependence on , via , is extremely weak). Let , for a given GRB, be the ratio of the observed flux to the one expected for our canonical , and for one dominant (largest ) cannonball: . The values of are reported in Table III. They range from to , indicating that the CB model satisfactorily explains the late X-ray AG normalizations and that the total baryon number of the ensemble of CBs that dominate the AG appears to be quite constant.
One can see in Figs. (26) to (33), that the X-ray fluences at the start of the X-ray decline are . These figures for the beginning of the early X-ray AG compare quite favourably with the typical prediction quoted after Eq. (25): for a single CB. Once again, the parameters extracted from fitting the optical AGs are not sufficient to fix case by case the overall early X-ray normalization in Eq. (25), which also depends directly on other parameters (notably , and the radii of the still-growing CBs). Using these degrees of freedom we could fit not only the late, but also the early absolute X-ray fluences. Suffice it to say that the magnitude of the early X-ray afterglow is also the one expected in the CB model.
The fitted values of in Eq. (43) are in fair agreement with the absorption-dependent expectation from the spectrum of Eq. (30). Some examples of values of extracted this way are for GRB 970228 (Frontera et al., 1998), for GRB 970508 (Galama et al. 1998b), for GRB 971214 (Dal Fiume et al. 2000), for GRB 980703 (Vreeswijk et al. 1999) for GRB 990510 (Pian et al. 2001), 0.9 to 1.1 for GRB 000926 (Piro et al. 2001) and for GRB 010222 (In ‘t Zand et al. 2001). However, the inferred values of are affected by large and very uncertain extinctions in the CB and host galaxies. Evidence for large extinction of optical AGs of GRBs in their host galaxies is provided by the large column densities () extracted from the X-ray observations of some GRBs (e.g., GRBs 970228, 970508, 970828, 971214, 980329, 980519: Owens et al. 1998; GRB 980703: Vreeswijk et al. 1999) and from the absorbed spectra of the optical AG of other GRBs (e.g. GRB 990712: Vreeswijk et al. 2000; GRB 991216: Halpern et al. 2000a; GRB 000131: Andersen et al. 2000). In fact, the failure to detect the optical AG of many long duration GRBs with well localized X-ray AG —like GRB 970111, GRB 970616, GRB 970815, and 970828— may be due to strong extinction of their optical AG in the host galaxy (Djorgovski et al. 2001 and references therein).
12.1 GRB 980425 is not exceptional
The -ray fluence of this GRB is not atypical but its redshift, , is extremely small. If it is not intrinsically exceptional, its CBs must be viewed from an atypically large angle (DD2000a). For large the CBs’ afterglow is strongly reduced, as can be seen from Fig. (5), allowing for the possibility that the AG is dominated by the SN. Consequently, the CB parameters cannot be derived from the optical light curve of the blended SN 1998bw/GRB 980425 system. But they can be deduced from the X-ray emission of the system if we assume, unlike the observers do (e.g., Pian et al. 1999; Pian et al. 2001) that it was produced by the CBs and not by the conventional quasi-spherical SN ejecta888We are indebted to E. Pian for discussions on this point.. Indeed, significant X-ray emission from SNe has been detected only at much later times after the event. Moreover, the exceptionally slow decline of the X-ray AG in this GRB is what is expected from the large viewing angle interpretation, see Fig. (5).
Given all of the above, for this GRB we have “reversed” our procedure by first fitting the X-ray AG of the SN 1998bw/GRB 980425 system. The fit is shown in the upper part of Fig. (36) and the fitted parameters are listed in Table II. The data are not very precise and the fit (for which we assumed , as fitted for all other GRBs) is not one of our best, but it inescapably requires a very large viewing angle . The best fitted angle is mrad, corresponding, for the fitted , to an initial Doppler factor . If the CBs of GRB 980425 had been viewed from a typical viewing angle, , the equivalent isotropic energy would have been in the range to erg, like that of all other GRBs.
If we assume that for GRB 980425 the extinction, ISM density, and CB radius were the same as for other GRBs well measured in X-rays, such as GRB 990510 or GRB 010222, we can use Eq. (31) to derive the expected intensity of the X-ray AG plateau of GRB 980425, see Fig. (36), and its caption. The results are , and , both yielding , in agreement with the BeppoSAX observations (Pian, 1999; Pian et al. 2000). The double success in deducing a “normal” GRB equivalent isotropic energy, and the intensity of the X-ray AG, constitutes a very strong support for the alleged association of SN1998bw with (a not exceptional) GRB 980425.
The fitted parameters of the X-ray AG can be used to predict the magnitude and shape of the optical AG of the blended SN 1998bw/GRB 980425 system, if we assume the same V/X extinction ratio as in GRBs 990510, 000926 and 010222. This we do in the lower part of Fig. (36). The CBs’ contribution dominates at very late time and, remarkably, it is in perfect agreement with the HST observation (Fynbo et al. 2000) on day 778 after the GRB.
13 Discussion of the results on optical AGs
With the exception of the AG of GRB 970508, which has the sharp “break up” that we have explained via a sudden change in density, a look at Figs. (7) to (24) clearly reveals that the observed AGs have absolutely no “breaks”. In the CB model, the gradual evolution of the proper afterglow (that of the CBs) is simply a consequence of the gradual decrease of the Lorentz factor . We give in Table II the list of the parameters resulting from our fits (, , and ) to optical R-band afterglows (and in two cases, to the V-band afterglow as well).
The fits to the CB model are satisfactory, particularly since the best-fit parameters turn out to be precisely in the expected ranges. On close inspection one notices that our curves occasionally undershoot or overshoot some points by a small factor, as in GRBs 990123 and 000301c999The feature at days in GRB 000301c has been interpreted by Garnavich et al. (2000b) as due to gravitational lensing.. This is not a surprise: the AG fluences are proportional to the ISM number density, which we do not expect to be exactly constant for kpc distances, even in the halo of galaxies. If such “defects” were not present in our fits, we would have concluded that the data had been over-parametrized. For the same reasons, and because of the systematic errors in the data, the values of the parameters we extract from our fits should not be taken entirely at face value, even though the minimization procedure —which attributes to the errors a counterfactual purely statistical origin— results in tiny 1 spreads for the fitted parameters, and in values that are in most cases extremely satisfactory.
All the figures (7) to (24) refer to optical data for days, for which it is reasonable to approximate the ISM density by a constant value, describing the density of the superbubble and/or the galactic halo. We have already discussed the early observations of GRB 990123, for which this approximation breaks down.
13.1 The distribution of fitted parameters
In the CB model, the parameter of
Eqs. (30, 31) is
the only one for which we have no reason to expect
a range of different values. It is therefore extremely
satisfactory that the fitted values of are, within errors,
compatible with all of the GRBs having a universal
behaviour with the theoretically predicted value: ,
Eq. (30). The narrow distribution of best fitted
values is shown in Fig. (37).
In the CB model, we have extracted the
values of from
the temporal shape of the AG and —adding consistency
to the picture— they agree well with the values
obtained from spectral observations, either in X-rays (with spectra
modified by a best-fit hydrogen column density) or in the
optical domain (with a galactic colour-dependent extinction).
Some examples are:
GRB 970228: (Costa et al. 1997).
GRB 970508: (Galama et al. 1998c);
(Galama et al. 1998c).
GRB 990123: (Holland et al. 1999a).
GRB 990510: (Pian et al. 2001);
(Stanek et al. 1999).
GRB 991208: (Castro-Tirado et al. 2000).
GRB 991208: (Takeshima et al. 1999).
GRB 000301c: (Jensen et al. 2000).
GRB 000926: (Piro et al. 2001);
(Sagar et al. 2001a).
GRB 010222: (In ‘t Zand et al. 2001);
(Stanek et al. 2001).
There are also cases for which the reported value of differs significantly from 1.1. One notable instance is GRB 990510, for which Beuerman et al. (1999) report and Stanek et al. (1999) find . To extract this value the authors extrapolate the measured extinction: (Schlegel et al. 1998). If this measured extinction is used to correct only the measured values for GRB 990510: (Beuerman et al. 1999), and (Stanek et al. 1999), one obtains . The uncertainties entailed by absorption corrections are the reason why we have chosen to de-emphasize results that are sensitive to them, whether they do, or do not, agree with our expectations.
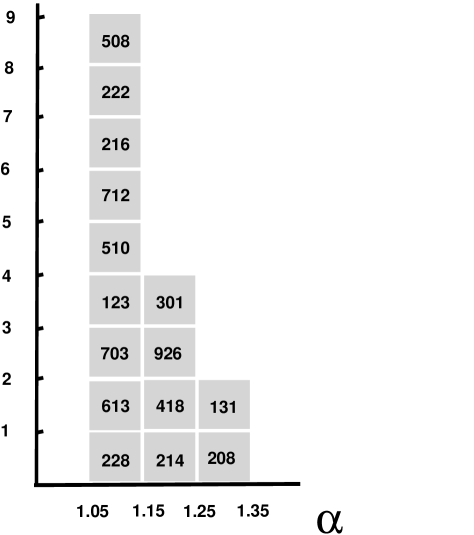
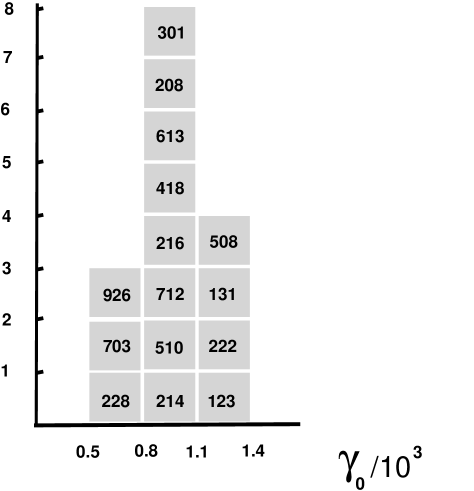
The distribution in initial Lorentz factors, , shown in Fig. (38), agrees snugly with our expectation, , extracted from independent information: the fluence and the individual-photon energies of GRBs (DD2000a,b) and the energies of X-ray lines in their afterglow (DD2001a). Notice how surprisingly narrow this distribution is.
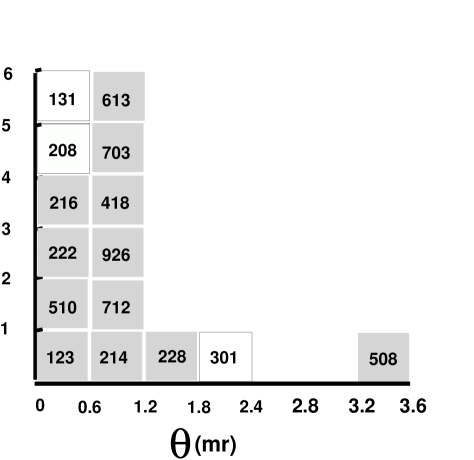
The distribution of viewing angles is shown in Fig. (39). The AG data for GRB 000131 consist in only three points, while for GRBs 991208 and 000301c the measurements start rather late. The sensitivity to in our fit to these GRBs is not good. We reflect this fact in Fig. (39) by having the corresponding entries unshaded. The distribution is compatible with the expectation that the limited experimental sensitivity to GRBs introduces a sharp cutoff as increases; see the steep fluence function, Eq. (4).
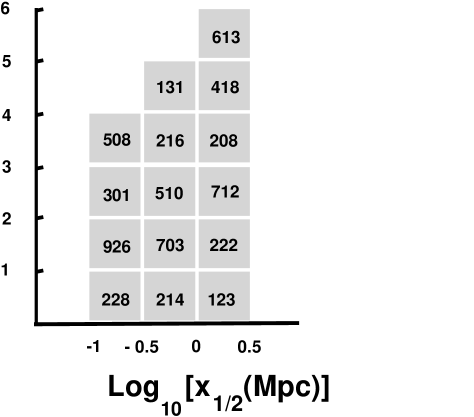
The parameter of Eq. (38) is the only one for which we expect a rather broad distribution. Indeed, it depends on the densities close to the GRB progenitor, which ought to be quite variable, and in the region where the CB light is emitted; see Eq. (38). The values of reported in Table II show a spread of a bit over one order of magnitude, supporting the expectation. In Fig. (40) we show the distribution of , which peaks at the reference value of Eq. (38) and extends to smaller values, as expected if the average density close to the progenitor is sometimes much smaller than our rather large reference value: ; and/or the density of the ISM is bigger than our rather low reference value: .
The values of , , and are not sufficient to predict the overall normalization of an AG: in Eq. (42), whose approximate value is given by the absolutely normalized Eq. (31). Indeed, is proportional to the product of the number of CBs and their baryon number. To skirt absorption corrections we have discussed in section 12 the values of in connection with late X-ray AGs. There, we compared the data and the naive expectation for a single (highest-) dominant CB () and our canonical , to work out the ratio of fitted to predicted values of in the X-ray band. The same exercise can be carried along for the R-band AGs, with the result that the optical values of are not within a factor of three, but within an order of magnitude of . It is tempting to conclude that this may be due to poorly-understood absorption. It is in any case clear that the AG magnitude, in the CB model, is not a problem101010In the fireball model and its descendants, the efficiency of conversion of kinetic energy to photons is claimed to be high, and both the GRBs and their AGs are due to the same mechanism: synchrotron radiation. It is therefore difficult to explain why, at the end of the GRB, the radiation rate suddenly drops by two orders of magnitude or more, and why there is more energy in the GRB than in the afterglow (see, e.g. Burenin et al. 1999; Pian et al. 2001, In ‘t Zand et al. 2001)..
The GRB consists of the photons emitted by the hot CBs as they exit the SN shell. In the rest system of a CB, the individual energies, as in Eq. (10), are a fraction of the observed energies, with . The total energy emitted by a GRB, in the rest system of its CBs, is in the form of isotropically distributed photons that appear to us as the collimated -ray burst. This comoving total energy is related to the observed fluence by:
| (44) |
For the GRBs all of whose parameters are well determined, we list in Table III the values of . Interestingly, their distribution —shown in Fig (41)— is also quite narrow.
We have not discussed in this subsection the parameters of GRB 980425, listed in Table II. They are obtained from a fit to the X-ray —as opposed to optical— AG, and they are imprecise. The deduced value of is erg, a bit lower than those listed in Table II. This is to be expected, the small of this GRB makes its GRB softer, and less prominent within the BATSE energy window.
To summarize, the distributions of parameters are in extremely good agreement with the expectations of the CB model and, if anything, they are astonishingly close to what they would be for “standard candle” GRBs.
13.2 The GRB/SN association in view of our results
It is useful to discuss the evidence for a SN component in the GRB optical AGs in order of decreasing redshift. The fact that we have a consistent and successful description of optical afterglows strengthens the interpretation of this putative evidence.
Examining Figs. (7) to (24), we draw the following conclusions. In the six more distant GRBs, ranging from GRB 000131 at to GRB 010222 at , there is no evidence for or against a SN 1998bw-like component. In GRB 000418, at , there is an indication of an excess, compatible with the SN. In GRB 980613, at , the evidence, though based mainly on just one point, is very strong. In GRB 991216, at , there is a clear indication of a late excess over the CB’s afterglow, though a SN1998bw-like contribution does not describe it very well (a slightly earlier bump would do a very good job, indicating that the standard-candle hypothesis for the SN is good, but not perfect). In GRB 980703, at , the SN excess is visible and well fitted, but the errors are large. For GRB 970828, at , there are no AG observations at optical wavelengths. In the peculiar case of GRB 970508, at , there is in the data a clear excess at late times that is very well fitted by our SN ansatz. For the next three closer GRBs (991208, 970228, 990712), at to 0.434, the evidence is completely convincing that a SN1998bw-like contribution is required to fit the data. In the case of GRB 990712, once again, a SN peak occurring slightly earlier than that of a redshift-corrected SN1998bw would provide a better description of the AG. Finally, GRB 980425, at is indeed associated to a SN: our fairly satisfactory standard-candle choice.
A clear trend is apparent in the last paragraph. The closer a GRB is, the better the evidence for its association with a SN. The trend is entirely consistent with the fact that, for the more distant GRBs, a SN contribution to the AG could not be seen, even if it was there. In all cases where the SN could be seen, it was seen, with the evidence gaining in significance as the distance diminishes. The temptation to conclude that all long-duration GRBs are associated with SNe appears to us to be irresistible, even if an irrefutable proof will never be possible.
13.3 Do cannonballs deserve their name?
We have argued that CBs should reach an asymptotic radius in a very short time and travel thereafter as literal, i.e. non-expanding, “cannonballs”. Can this statement be contrasted with the data? To answer this question we have analyzed the AGs produced by CBs whose radius inertially increases at a fixed speed, , in their rest system. The details are given in Appendix II. The result is that the late AGs behave in this case as , with . For , as we have argued, , which completely disagrees with the AG light curves. For , in agreement with the latter, , which completely disagrees with the measured spectra. Thus, the cannonballs of the CB model do deserve their name.
14 Summary and conclusions
We have previously argued that the cannonball model offers a successful and simple explanation of the fluence, energy spectrum, and temporal behaviour of the prompt -rays of a GRB (DD2000b). ¿From these considerations we extracted a CB’s typical Lorentz factor, , and typical baryon number : in the vicinity of , or times as much for a jet of CBs in a multipulse GRB (DD2000b, DD2001b). Using only these CB-related input parameters and a reasonable initial CB expansion velocity, we have explicitly worked out all of the properties of X-ray and optical afterglows.
As an intermediate result, we derived the temporal behaviour of the radius of a CB and showed that, faithful to their name, CB radii tend to a constant in mere minutes of observer’s time. The value of depends on the ISM density close to the GRB progenitor. GRBs whose CBs have large radii have afterglows whose temporal decline is very fast. This is also the case for GRBs whose CBs travel through a relatively dense ISM. These may be the reasons, along with strong extinction in the host galaxy, why the search for AGs is not always successful.
We have shown how well the CB model describes all the properties of the X-ray and optical afterglows of GRBs. Our results do not —and could not— take into account possible variations of the ISM density along a CB’s path; they are in this sense “descriptions” rather than fits. In spite of this, the descriptions are excellent and the consistency of the results is impressive.
The observed behaviour of both X-ray and optical AGs is the predicted one. All the parameters extracted from the fits have values or distributions close to the expected ones. This is the case for the integrated fluences in the early and late X-ray and optical bands, for the values of the Lorentz factor , for the distribution of observation angles , for the spectral index (that we determine, not from the spectra themselves, but from the time-dependence of the late afterglow), and for the parameter of Eq. (38), that governs the pace of the CB’s slowdown, and is a combination of the ISM densities, and the CB’s baryon number and radius. Throughout, we have chosen to de-emphasize the results that are most sensitive to systematic errors, such as absorption corrections. Thus, we have not systematically extracted parameters from flux normalizations, nor reported any tests of the quality of the fits (which would be misleadingly good) or statistical-error estimates on the fitted parameters (which would be misleadingly small).
The distribution of the derived quantity (the energy of the GRB photons in the CBs’ rest system) has a range of less than a factor of four, making long-duration GRBs not far from standard candles. We have demonstrated that GRB afterglows can be understood in detail. Perhaps this will pave the way to the use of GRBs as cosmological beacons.
GRB 980425 is at first sight a special case: its -rays are rather soft, it is extremely near by cosmological standards, and very clearly associated with a SN. In the CB model it is not exceptional, only seen at a relatively large angle. Its X-ray afterglow is normal and emitted by its CBs, not by the isotropic ejecta of SN1998bw. Its optical AG is dominated by the SN for almost two years, but its last measured point is due to the CBs, and agrees with the expectation.
Very early optical AG data are only available for GRB 990123. The CB model is also capable of describing them naturally: their magnitude and time-dependence are those expected for CBs moving through the density profile produced by winds in the Wolf-Rayet phase of the progenitor. Future early observations should test this feature of the CB model: a linear dependence of the AG fluence on the varying local-density profile.
For GRB 970508 we can provide a good fit to its peculiar AG only if we assume that its CBs encountered a sudden change in ISM density, as they would if they are exiting a superbubble into a higher-density region.
The very early X-ray and optical AGs are not achromatic: they are dominated by two mechanisms with different time-dependence: thermal bremsstrahlung and synchrotron radiation. But in a matter of a few hours all of the AG is dominated by synchrotron radiation, and the light curves should be achromatic, as observed.
Our descriptions of the optical AGs indicate or require the contribution to the light curve of a supernova akin to SN1998bw, in all eight out of sixteen cases for which the event occurred close enough for such a contribution to be observable. The conclusion that there is a roughly one-to-one association between core-collapse SNe (or perhaps just type Ib and Ic SNe) and long-duration GRBs is very tempting. The enormous beaming factor of the CB model makes this conclusion tenable and consistent.
We are currently completing the study of the predictions of the CB model for radio afterglows, for which self-absorption in the CBs is relevant, and requires a careful analysis. The results, soon to be announced (Dado et al. 2002), are excellent. We also plan to discuss elsewhere the interesting implications of the CB model for cosmic-ray physics, and for other accreting compact objects that eject relativistic jets, such as radiogalaxies, AGNs, quasars, microquasars, blazars and microblazars.
It would be interesting to compare our results to those of conically ejected shocked fireballs. We have argued that, for this, it would be more convincing not to have the observed firetrumpets pointing precisely to planet Earth. For the time being, we have proved that the CB model —based on simple and definite hypothesis— makes predictions that are univocal (as opposed to multiple-choice), explicit, analytical in fair approximations, quite simple, very complete, and very successful.
Acknowledgements: We are very indebted to Rainer Plaga for numerous fruitful discussions. We thank Elena Pian and Jean In ‘t Zand for kindly providing us with the detailed data on the BeppoSAX X-ray observations of GRBs 990510 and 010222; Donald Smith and Atsunama Yoshida for the data on GRB 970828; and Luigi Piro for the data on GRB 970508. We are indebted to an anonymous referee for many sensible suggestions and questions. This research was supported in part by the Helen Asher Fund for Space Reseach and by the V.P.R. Fund - Steiner Research Fund at the Technion.
Appendix I: Subdominant AG mechanisms
Three mechanisms declining less fast than thermal bremsstrahlung —but typically subdominant relative to synchrotron radiation— contribute to GRB afterglows: relativistic bremsstrahlung from Coulomb collisions of CB electrons with the ISM constituents, atomic transitions of CB atoms excited or ionized by these same collisions, and inverse Compton scattering of the CBs’ electrons on the cosmic background radiation. We discuss them here to substantiate our assertion that thermal bremsstrahlung and synchrotron radiation dominate the AGs.
Relativistic bremsstrahlung
The electrons of the CB, in their highly relativistic collisions with the ISM nuclei, emit non-thermal bremsstrahlung radiation. The total power per unit area received by the observer from this source is:
| (45) |
where is the classical radius of the electron and is the fine structure constant. For , , and , the above expression yields erg/(cm2 s). This radiation has the same dependence on and as the synchrotron radiation of Eq. (27), but it is some two orders of magnitude smaller. This spectrum extends to MeV; it may be a contribution to the very high energy -rays observed by EGRET and COMPTEL in some GRBs.
Atomic transitions
The recombination and de-excitation of the CB atoms excited and dissociated by Coulomb collisions with the ISM particles contributes to the AG with a power:
| (46) |
where is the Coulomb logarithm,
| (47) |
eV is the ionization energy of hydrogen, and is the maximum kinetic energy that can be imparted to a stationary electron in a single collision with a relativistic particle of mass :
| (48) |
For , , cm-3 and , Eq. (46) yields erg/(cm2 s), which is negligible with respect to the synchrotron radiation of Eq. (27). This power is radiated mostly as synchrotron emission from the knocked-on electrons and by line emission from hydrogen recombination (boosted to X-ray energies).
Inverse Compton scattering
The scattering of the CBs’ electrons on ambient starlight and the cosmic background radiation (CBR) produces a radiated power:
| (49) |
where is the energy density of the radiation field ( for the CBR). For , and , the above expression yields erg/(cm2 s) for the CBR contribution, which is negligible relative to synchrotron radiation up to a very late afterglow phase, when may be very small. The contribution of Compton scattering to a polarization of the signals, on the other hand, may not be negligible (Shaviv and Dar, 1995).
Inverse Compton scattering of the CBs’ high energy electrons, with a proper spectrum , on their self-produced synchrotron and thermal bremsstrahlung radiation produces very high energy photons with a spectrum . For distant GRBs, this spectrum is cutoff at sub TeV energies by pair production on the infrared background radiation. But, for very nearby GRBs, it may be observable up to extremely high energies, larger than those observed from blazars.
Appendix II: Ever expanding “cannonballs”
It is very instructive to study the possibility that CBs, instead of reaching an asymptotic radius, would continue to expand significantly. To find in this case, Eq. (36) is to be substituted by:
| (50) |
while Eqs. (34, 35) remain unchanged. Insert Eq. (50) into Eq. (34) and integrate, to obtain, for constant :
| (51) |
The CBs reach an asymptotic radius as , which bears some resemblance to that of Eq. (16), but it is reached much later and it is much larger (e.g. cm for cm-3, , and ).
Appendix III: gravitational lensing of moving CBs
The phenomenon of gravitational lensing is well known. A lensing object of mass has a Schwarzschild radius . If is the angular distance from source to observer and is the fractional distance to the lens, the Einstein radius of the system is . As the lensing object crosses close to the line of sight (or, in our case, as the line of sight to the fast-moving CB passes close to the lensing object) the amplification is:
| (54) |
where is the minimum distance to the lens, in Einstein radii, of the line of sight to the CB during its motion.
Gravitational lensing of a moving CB is peculiar in two ways: the apparent velocity is superluminal, and the time “width” of the effect, , is itself time dependent, since the CB is decelerating as the lensing occurs:
| (55) |
For a solar-mass star placed halfway to a GRB at , the typical duration of a lensing event is hour. The average Einstein radius of a solar-mass star placed somewhere on the way to such a location is AU. What is the optical depth (or apriori probability), , for an observable lensing by such an object? Consider lensing during the first 10 days of an AG, when its fluence is relatively high and during which, for typical parameters, the CBs travelled a (local) distance kpc. The apparent transverse distance is pc. The average luminosity density of the local Universe is and the mass to luminosity ratio of star populations is to 10 in solar units, so that the number density of “typical” solar-mass stars is for . The optical depth is:
| (56) |
In the interval extending to , and for our adopted cosmological parameters, the volume average is . Thus we obtain %, which makes the lensing effects hopefully visible.
A rough estimate of taking into account that stars gather in galaxies gives a similar result. Let the surface-number density of stars in a galaxy, as a function of distance to the centre, be approximated by , with kpc. For a reference galaxy with stars pc-2. Define a galaxy’s effective lensing radius so that . For the quoted values of and this means kpc. Approximate the surface density of galaxies at by the observed value for galaxies with -magnitude below 25: rad-2 (Casertano et al. 2000). The lensing probability at an angular distance is then %.
Table I - Gamma-ray bursts of known redshift
| GRB | z | DL | |||
|---|---|---|---|---|---|
| 9702281 | 0.695 | 4.55 | 1.1 | 0.22 | 25.218 |
| 9705082 | 0.835 | 5.70 | 0.49 | 0.10 | 25.019 |
| 9708283 | 0.957 | 6.74 | 9.6 | 2.06 | 24.520 |
| 9712144 | 3.418 | 32.0 | 0.94 | 2.11 | 25.621 |
| 9804255 | .0085 | .039 | 0.44 | 8.1E-6 | 14.322 |
| 9806136 | 1.096 | 7.98 | 0.17 | 0.61 | 24.023 |
| 9807037 | 0.966 | 6.82 | 2.26 | 1.05 | 22.624 |
| 9901238 | 1.600 | 12.7 | 26.8 | 19.80 | 23.925 |
| 9905109 | 1.619 | 12.9 | 6.55 | 5.00 | 27.026 |
| 99071210 | 0.434 | 2.55 | 6.5 | 0.53 | 21.827 |
| 99120811 | 0.70 | 4.64 | 10.0 | 1.51 | 24.428 |
| 99121612 | 1.020 | 7.30 | 19.4 | 5.35 | 24.829 |
| 00013113 | 4.500 | 44.4 | 4.2 | 11.60 | 27.830 |
| 000301c14 | 2.040 | 17.2 | 0.41 | 0.46 | 28.031 |
| 00041815 | 1.119 | 8.18 | 2.0 | 0.82 | 23.932 |
| 00092616 | 2.066 | 17.4 | 2.20 | 2.60 | 25.633 |
| 01022217 | 1.474 | 11.5 | 12.0 | 7.80 | 25.934 |
Comments: : Redshift. : Luminosity distance in Gpc,
for and .
: BATSE -ray fluences in units of
erg cm-2. : (Equivalent spherical) energy in
units of ergs.
: R-magnitude of the host galaxy, except for GRB 990510, for
which the V-magnitude is given, corrected for galactic extinction
References:
1: Djorgovski et al. 1999a;
2: Metzger et al. 1997;
3: Djorgovski et al. 2000;
4: Kulkarni et al. 1998b;
5: Tinney et al. 1998;
6: Djorgovski et al. 1998a;
7: Djorgovski et al. 1998b;
8: Kelson et al. 1999;
9: Vreeswijk et al. 1999a;
10: Hjorth et al. 1999;
12: Vreeswijk et al. 1999b;
13: Andersen et al. 2000;
14: Feng et al. 2000;
15: Bloom et al. 2001;
16: Fynbo et al. 2001;
17: Jha et al. 2001; Fruchter et al. 2001;
18: Fruchter et al. 1999b;
19: Pian 2001;
20: Djorgovskyet al. 2001
21: Odewahn et al. 1998;
22: Galama et al. 1998a;
23: Djorgovski et al. 2000;
24: Bloom et al. 1998b;
25: Bloom et al. 1999b;
26: Pian 2001;
27: Hjorth et al. 1999;
28: Diercks et al. 2000;
29: Djorgovski et al. 1999b;
30: Andersen et al. 2000;
31: Smette et al. 2000;
32: Bloom et al. 2000;
33: Fynbo et al. 2001;
34: Fruchter et al. 2001.
Table II - The CB, host-galaxy, and extinction parameters
| GRB | R[HG] | |||||
|---|---|---|---|---|---|---|
| 970228 | 540 | 1.10 | 1.686 | 0.155 | 25.55 | 0.50 |
| 971214 | 999 | 1.20 | 0.708 | 0.373 | 25.69 | 0.94 |
| 980613 | 509 | 1.09 | 1.619 | 0.241 | 24.07 | 0.82 |
| 980703 | 779 | 1.08 | 0.953 | 0.344 | 22.54 | 0.88 |
| 990123 | 1325 | 1.09 | 0.420 | 0.954 | 23.90 | 0.96 |
| 990510 | 991 | 1.10 | 0.261 | 0.777 | 27.80 | 0.50 |
| 990510a | 907 | 1.08 | 0.318 | 0.504 | 27.80 | 0.40 |
| 990712 | 948 | 1.09 | 0.750 | 1.191 | 21.93 | 0.50 |
| 990712a | 957 | 1.08 | 0.863 | 1.319 | 22.57 | 0.40 |
| 991208 | 1034 | 1.26 | 0.100 | 1.357 | 24.81 | 0.80 |
| 991216 | 972 | 1.09 | 0.375 | 0.953 | 24.64 | 0.80 |
| 000131 | 1200 | 1.26 | 0.100 | 0.793 | 27.80 | 0.93 |
| 000301c | 1040 | 1.19 | 2.223 | 0.141 | 28.00 | 0.90 |
| 000418 | 1017 | 1.17 | 0.970 | 1.961 | 23.74 | 0.92 |
| 000926 | 760 | 1.20 | 0.740 | 0.133 | 25.63 | 0.96 |
| 010222 | 1178 | 1.10 | 0.465 | 1.026 | 25.76 | 0.94 |
| 970508b | 1123 | 1.10 | 3.51 | 0.293 | 24.69 | 0.94 |
| 980425b | 769 | 1.10 | 8.30 | 0.252 | 14.30 | 0.93 |
Comments: : Initial Lorentz factor. : Viewing angle relative to the CB line of motion, in milliradians. : CB slow-down parameter, in Mpc ( at ). : Fitted value of the R-magnitude of the host galaxy (except for GRB 990712, for which also the V-magnitude is given) not corrected for galactic extinction. : Attenuation of the SN1998bw-like contribution due to galactic extinction. : V-band afterglow parameters. : Two GRBs are special: GRB 970508 is fit with two constant ISM densities, the quoted value corresponds to the initial one; in GRB 980425 the SN outshines the CBs in the optical, the fit is to the X-ray AG, was assumed, and the parameter determinations are very imprecise.
References:
GRB 970228:
Castander, et al. 1999a;
Castander, et al. 1999b;
Djorgovski et al. 1999a;
Fruchter et al. 1997a;
Galama et al. 1997;
Galama et al. 2000;
Garcia et al. 1998;
Guarnieri, et al. 1997;
Metzger et al. 1997a;
Pedichini et al. 1997;
Sahu et al. 1997a;
Sahu et al. 1997b;
van Paradijs et al. 1998.
GRB 970508:
Bloom et al. 1998b;
Castro-Tirado et al. 1998b;
Chevalier & Ilovaisky 1997;
Djorgovski et al. 1997;
Fruchter et al. 1997b;
Fruchter et al. 2000;
Galama et al. 1998b;
Metzger et al. 1997b;
Pedersen et al. 1998a;
Schaefer et al. 1997;
Sokolov et al. 1997;
Sokolov et al. 1998;
Zharikov et al. 1998.
GRB 971214:
Diercks et al. 1998;
Halpern et al. 1998b;
Kulkarni et al. 1998b.
GRB 980613:
Djorgovski et al. 1998a;
Djorgovski et al. 2000;
Halpern et al. 1998a;
Hjorth et al. 1998.
GRB 980703:
Bloom et al. 1998b;
Castro-Tirado et al. 1999a;
Holland et al. 2000b;
Holland et al. 2001;
Pedersen et al. 1998b;
Sokolov et al. 1998;
Vreeswijk et al. 1999c;
Zapatero Osorio et al. 1998.
GRB 990123:
Castro-Tirado et al. 1999b;
Fruchter et al. 1999a;
Galama et al. 1999a;
Holland et al. 2000a;
Kulkarni et al. 1999.
GRB 990510:
Beuermann et al. 1999;
Covino et al. 1999;
Fruchter et al. 1999c;
Galama et al. 1999b;
Harrison et al. 1999;
Holland et al. 2000a;
Marconi et al. 1999a,b;
Pietrzyński & Udalski 1999a,b,c;
Stanek et al. 1999.
GRB 990712:
Hjorth et al. 2000a;
Sahu, et al. 2000
GRB 991208:
Castro-Tirado et al. 2001;
Sagar et al. 2000a.
GRB 991216:
Djorgovski et al. 1999b;
Garnavich et al. 2000a;
Halpern et al. 2000a;
Sagar et al. 2000a.
GRB 000131:
Andersen et al. 2000.
GRB 000301c:
Jensen et al. 2001;
Halpern et al. 2000b;
Garnavich et al. 2000b;
Masetti et al. 2000;
Rhoads & Fruchter 2001;
Sagar et al. 2000b;
Veillet 2000a.
GRB 000418:
Berger et al. 2000;
Henden et al. 2000;
Klose et al. 2000;
Metzger & Fruchter 2000.
GRB 000926:
Fynbo et al. 2001;
Halpern et al. 2000C
Harrison et al. 2001;
Hjorth et al. 2000b;
Price et al. 2001;
Sagar et al. 2001a;
Veillet 2000b.
GRB 010222:
Cowsik et al. 2001;
Jha et al. 2001;
Fruchter et al. 2001;
Garnavich et al. 2001;
Masetti et al. 2001;
Oksanen et al. 2001;
Orosz et al. 2001;
Price et al. 2001;
Sagar et al. 2001b;
Stanek et al. 2001;
Valentini et al. 2001;
Watanabe et al. 2001;
Veillet 2001.
Table III - The rest frame GRB energy and X-ray AG of GRBs with measured redshift and X-ray AG from their observed -ray fluence and the optical AG parameters
| GRB | z | ||||||
|---|---|---|---|---|---|---|---|
| 970228 | 0.695 | 4.55 | 1.10 | 540 | 591 | 0.86 | 0.78 |
| 970508 | 0.835 | 5.70 | 1.10 | 1123 | 137 | 1.26 | 1.47 |
| 970828 | 0.957 | 6.74 | 1.10 | 1153 | 1160 | 0.77 | 1.34 |
| 971214 | 3.418 | 32.0 | 0.94 | 999 | 1331 | 1.28 | 1.11 |
| 980613 | 1.096 | 7.98 | 0.17 | 509 | 606 | 1.34 | 1.74 |
| 990123 | 1.600 | 12.7 | 26.8 | 1325 | 2023 | 1.45 | 1.84 |
| 990510 | 1.619 | 12.9 | 6.55 | 991 | 1858 | 2.60 | 0.78 |
| 991216 | 1.020 | 7.30 | 19.4 | 972 | 1716 | 0.38 | 1.54 |
| 000926 | 2.066 | 17.4 | 2.20 | 761 | 1115 | 2.12 | 0.60 |
| 010222 | 1.474 | 11.5 | 12.0 | 1109 | 1812 | 1.43 | 1.31 |
Comments: : Luminosity distance, for and , in Gpc.
: BATSE/BeppoSAX -ray fluences in units of
erg cm-2. : Initial Doppler factor.
: The ratio between observed and predicted late-time X-ray fluxes in
the 2-10 keV band, for a single unextinct standard CB with
: Energy radiated by the ensemble of CBs
in its rest frame, in units of
References
- (1) Akerlof C., et al., 1999, Nature 398, 400
- (2) Andersen M.I., et al., 2000, A&A 364, 54L
- (3) Bendarz J., Ostrowski M., 1998, Phys. Rev. Lett. 80, 3911
- (4) Berger E., et al., 2000, ApJ 545, 56
- (5) Berger E., et al., 2001, astro-ph/0102278
- (6) Beuermann K., et al., 1999, A&A 352, L26
- (7) Bhargavi S.G., Cowsik R., 2000, ApJ 545, L77
- (8) Bjornsson G., et al., 2001, ApJ, 552, 121L
- (9) Bloom J.S., et al., 1998a, ApJ 507, L25
- (10) Bloom J.S., et al., 1998b, ApJ 508, L21
- (11) Bloom J.S., et al., 1999a, Nature 401, 452
- (12) Bloom J.S., et al., 1999b, ApJ 518, L1
- (13) Bloom J.S., et al., 2000, GCN Circ. 661
- (14) Bloom J.S., Djorgovski S.G., Kulkarni S.R., 2001, ApJ 554, 678
- (15) Brainerd J.J., 1992, ApJ 394, 33L
- (16) Bridle A., 2000, http://www.cv.nrao.edu/ abridle/images.htm
- (17) Burenin R.A., et al., 1999, A&A 344, L53
- (18) Casertano S., et al., 2000, astro-ph/0010245
- (19) Castander F., et al., 1999a, ApJ 523, 593
- (20) Castander F., et al., 1999b, ApJ 523, 602
- (21) Castro-Tirado A.J., et al., 1998a, Science 279, 1011
- (22) Castro-Tirado A.J., et al., 1998b, IAU Circ. 6848
- (23) Castro-Tirado A.J., Gorosabel J., 1999, A&AS 138(3), 449
- (24) Castro-Tirado A.J., et al., 1999a, ApJ, 511, L85
- (25) Castro-Tirado A.J., et al., 1999b, Science 283, 2069
- (26) Castro-Tirado A.J., et al., 2001, A&A 370, 398
- (27) Chiang J., Dermer C.F., 1997, astro-ph/9708035
- (28) Chevalier C., Ilovaisky S.A., 1997, IAU Circ. 6663
- (29) Cline T.L., et al., 1999, A&A 138(3), 557
- (30) Corbet R., Smith D., 1999 GCN Circ. 506
- (31) Costa E., et al., 1997, Nature 387, 783
- (32) Covino S., et al., 1999, GCN Circ. 330
- (33) Cowsik R., et al., 2001, astro-ph/0104363
- (34) Cranc P., et al., 1993, ApJ 402, L37
- (35) Dado S., Dar A., and De Rújula 2002, in preparation
- (36) Dal Fiume D., et al., 2000, A&A 355, 454
- (37) Dar A., et al., 1992, ApJ 388, 164
- (38) Dar A., 1997, astro-ph/9704187
- (39) Dar A., 1998a, ApJ 500, L93
- (40) Dar A., 1998b, Proc. Les Rencontres de Physique de la Vallée d’Aoste, (ed. M. Greco) p. 23
- (41) Dar A. 1999a, A&AS 138(3), 505
- (42) Dar A., 1999b, GCN Circ. 346
-
(43)
Dar A., De Rújula, A., 2000a, astro-ph/0008474,
submitted to A&A -
(44)
Dar A., De Rújula, A., 2000b, astro-ph/0012227,
submitted to A&A - (45) Dar A., De Rújula, A., 2001 MNRAS 323, 391
-
(46)
Dar A., De Rújula, A., 2001a, astro-ph/0102115,
submitted to A&A -
(47)
Dar A., De Rújula, A., 2001b, astro-ph/0105094,
submitted to Phys. Rev. - (48) Dar A., Plaga R., 1999, A&A 349, 259
- (49) De Rújula A., 1987, Phys. Lett. 193, 514
- (50) Diercks A.H., 1998, ApJ 503, L105
- (51) Diercks A., et al., 2000, GCN Circ. 764
- (52) Djorgovski S.G., et al., 1997, Nature, 387, 876
- (53) Djorgovski S.G., et al., 1998a, GCN Circ. 117, 189
- (54) Djorgovski S.G., et al., 1998b, ApJ 508, L17
- (55) Djorgovski S.G., et al., 1999a, GCN Circ. 289
- (56) Djorgovski S.G., et al., 1999b, GCN Circ. 510
- (57) Djorgovski S.G. et al., 2000, astro-ph/0008029
- (58) Djorgovsky, S.G., et al., 2001, astro-ph/0107539
- (59) Djorgovsky, S.G., et al., 2001, astro-ph/0107539
- (60) Dodonov S.N., et al., 1999, GCN Circ. 475
- (61) Dunne B.C., Points, S.D., Chu, Y., 2001, astro-ph/0104212
- (62) Feng M.L., Wang L., Wheeler J., 2000, GCN Circ. 607
- (63) Fenimore E., Ramirez-Ruiz E., 2000, astro-ph/0004176
- (64) Frail D.A., et al., 2001, astro-ph/0102282
- (65) Frontera F., et al., 1998, ApJ 493, 67L
- (66) Fruchter A.S., et al., 1997a, IAU Circ. 6747
- (67) Fruchter A.S., et al., 1997b, IAU Circ. 6647
- (68) Fruchter A.S., et al., 1999a, ApJ 519, L13
- (69) Fruchter A.S., et al., 1999b, ApJ 516, 683
- (70) Fruchter A.S., et al., 2000, ApJ 545, 664
- (71) Fruchter A.S., et al,, GCN Circ. 1087
- (72) Fynbo J.U., et al., 2000, ApJ 542, 89L
- (73) Fynbo J.U., et al., 2001, A&A 373, 796
- (74) Gabudza D.D., et al., 1993, ApJ 410, 39
- (75) Galama T.J., et al., 1997, Nature 387, 479
- (76) Galama T.J., et al., 1998a, Nature 395, 670
- (77) Galama T.J., et al., 1998b, ApJ, 497, L13
- (78) Galama T.J., et al., 1998c, ApJ 500, L97
- (79) Galama T.J., et al., 1999a, GCN Circ. 313
- (80) Galama T.J., et al., 1999b, GCN Circ. 388
- (81) Galama T.J., et al., 2000, ApJ 536 185
- (82) Garcia M.R., et al., 1998, ApJ 500, L105
- (83) Garnavich P.M., et al., 2000a, ApJ 543, 61
- (84) Garnavich P.M., et al., 2000b, ApJ 544, L11
- (85) Garnavich P.M., Loeb A., Stanek K.Z., 2000c, ApJ 544, L1
- (86) Garnavich P., Quinn, J., Stanek, K.Z., 2001, GCN Circ. 1009
- (87) Ghisellini G., et al. 1999, ApJ 517, 168
- (88) Ghisellini G., Celotti A., 2001, astro-ph/0103007
- (89) Kraft R.P., et al., astro-ph/0111340
- (90) Goodman J., 1986, ApJ 308, 47L
- (91) Goodman J., Dar A., Nussinov S., 1987, ApJ 314, L7
- (92) Guarnieri A., et al., 1997, A&A, 328, L13
- (93) Halpern J.P., et al., 1998a, GCN Circ. 134
- (94) Halpern J.P., et al., 1998b, AAS, 192.3311
- (95) Halpern J.P., et al., 1999, ApJ, 517, 105L
- (96) Halpern J.P., et al., 2000a, ApJ 543, 697
- (97) Halpern J.P., et al., 2000b, GCN Circ. 578, 582, 585, 604
- (98) Halpern J.P., et al., 2000c, GCN Circ. 824, 829
- (99) Harrison F.A., et al., 1999, ApJ 523, L121
- (100) Harrison F.A., et al., 2001, astro-ph/0103377
- (101) Heger A., Langer N., Woosley S.E., 2000, ApJ 528, 368
- (102) Henden A., et al., 2000, GCN Circ. 652
- (103) Higdon J.C., Lingenfelter R.E., 1980, ApJ 239, 867
- (104) Higdon J.C., Lingenfelter R.E., Ramaty R., 1998, ApJ 509, L33
- (105) Hjorth J., et al., 1998, GCN Circ. 109
- (106) Hjorth J., et al., 1999, GCN Circ. 403
- (107) Hjorth J., et al., 2000a, ApJ 534, 147L
- (108) Hjorth J., et al., 2000b, GCN Circ. 809, 814
- (109) Hjorth J., et al., 2001, ApJ 552, 121L
- (110) Holland S., Hjorth J., 1999, A&A 344, 67L
- (111) Holland S., et al., 2000a, A&A 364, 467
- (112) Holland S., et al., 2000b, AAS 197.6303H
- (113) Holland S., et al., 2001a, A&A 371, 52
- (114) Holland S., et al., 2001b, GCN Circ. 1002
- (115) Huang Y.F., et al., 2000a, ApJ 543, 90
- (116) Huang Y.F., et al., 2000b, MNRAS, 316, 943
- (117) In ‘t Zand J., et al., 2001, astro-ph/0104362
- (118) Israel G.L., et al. 1999, A&A 348, 5L
- (119) Iwamoto K., et al., 1998, Nature 395, 672
- (120) Jensen B.L., et al., 2000, astro-ph/0005609
- (121) Jensen B.L., et al., 2001, A&A 370, 909
- (122) Jha S., et al., 2001a, ApJ, 554, 15L
- (123) Jha S., et al., 2001b, Astro-ph/0103081
- (124) Kedziora-Chudczer L., et al., 1997, ApJ 490, 9L
- (125) Kelson D.D., et al., 1999, IAU Circ. 7096
- (126) Kennicut, R.C., Edgar, B.K., Hodge, P.W., 1989, ApJ 337, 761
- (127) Kippen R.M., et al., 1998, GCN Circ. 67
- (128) Klose S., et al., 2000, ApJ 545, 271
- (129) Kotani T., et al., 1996, PASJ 48, 619
- (130) Kulkarni S.R., et al., 1998a, Nature 395, 663
- (131) Kulkarni S.R., et al., 1998b, Nature 393, 35
- (132) Kulkarni S.R., et al., 1999 Nature 398, 389
- (133) Kumar P., Panaitescu A., 2000, ApJ 541,9L
- (134) Lamb D.Q., 2001, AAS 198.3511L
- (135) Lingenfelter R.E., Higdon J.C., Ramaty R., 2000, astro-ph/0004166
- (136) Loeb A., Perna R., 1998, ApJ, 495, 597
- (137) Levine A.M., et al., 1996, ApJ 469, L33
- (138) MacFadyen A.I., Woosley S.E., 1999, ApJ 524, 262
- (139) MacFadyen A.I., Woosley S.E., Heger A., 2001, ApJ 550, 410
- (140) Madau P., 1998, astro-ph/9801005
- (141) Madau P., Della Valle, M., Panagia, 1998, N., astro-ph/9803284)
- (142) Marconi G., et al., 1999a, GCN Circ. 329
- (143) Marconi G., et al., 1999b, GCN Circ. 332
- (144) Margon B.A., 1984, ARA&A 22, 507
- (145) Masetti N., et al., 2000, A&A 359, 23L
- (146) Masetti N., et al., 2001, astro-ph/0103296
- (147) Meegan C.A., et al., 1992, Nature 355, 143
- (148) Meszaros P., 2001, Science, 291, 79
- (149) Meszaros P., Rees M.J., 1992, MNRAS 257, 29P
- (150) Meszaros P., Rees M.J., Wijers R.A.M.J., 1999, New Astron. 4, 303
- (151) Metzger M.R., et al., 1997a IAU Circ. 6631
- (152) Metzger M.R., et al., 1997a, Nature 387, 878
- (153) Metzger M.R., Fruchter, A., 2000, GCN Circ. 669
- (154) Metzger M.R., et al., 2000, GCN Circ. 733
- (155) Mirabel I.F., Rodriguez L.F., 1994, Nature 371, 46
- (156) Mirabel I.F., Rodriguez L.F., 1999, ARA&A 37, 409
- (157) Moderski R., Sikora M., Bulik T., 2000, ApJ, 529, 151
- (158) Odewahn S.C., et al., 1998, ApJ 509, L5
- (159) Orosz J.A., 2001, GCN Circ. 976
- (160) Oksanen A., et al., 2001, GCN Circ. 990
- (161) Owens A., et al., 1998, A&A 339, L37
- (162) Paczynski B., 1986, ApJ 308, L43
- (163) Paczynski B., 1998, ApJ 494, L45
- (164) Panaitescu A., Kumar, P., 2000, astro-ph/0010257
-
(165)
Pearsons T.J., Zensus J.A., 1987, Superluminal
Radio Sources, p. 1 (Cambridge Univ. Press 1987) - (166) Pedersen H., et al., 1998a, ApJ, 496, 311
- (167) Pedersen H., et al., 1998b, GCN Circ. 142
- (168) Pedichini F., et al. 1997 A&A 327, 36L
- (169) Peebles P.J.E., 1993, Principles of Physical Cosmology (Princeton University Press)
- (170) Pian E., 1999, astro-ph/9910236
- (171) Pian E., et al., 1999, A&AS 138(3), 463
- (172) Pian E., et al., 2001, A&A 372, 456
- (173) Pian E., et al., 2001, astro-ph/0110051
- (174) Pietrzyński G., Udalski A., 1999a, GCN Circ. 316
- (175) Pietrzyński G., Udalski A., 1999b, GCN Circ. 319
- (176) Pietrzyński G., Udalski A., 1999c, GCN Circ. 328
- (177) Piran T., 1999, Phys. Rep. 314, 575
- (178) Piran T., 2000, Phys. Rep. 333, 529
- (179) Piran, T., 2001, astro-ph/0104134
- (180) Piro L., et al., 1998, A&A 331, L41
- (181) Piro L., 2000, astro-ph/0001436
- (182) Piro L., et al., 2001, astro-ph/0103306
- (183) Price P.A., et al., 2000, GCN Circ. 811
- (184) Price P.A., et al., 2000, astro-ph/0012303
- (185) Price P.A., et al., 2001, ApJ 549, 7L
- (186) Price P.A., et al., 2001, GCN Circ. 973
- (187) Ramirez-Ruiz, E., Fenimore E., 2000, astro-ph/0010588
- (188) Ramirez-Ruiz E., et al., 2000, astro-ph/0012396
- (189) Rees M.J., 1966, Nature 211, 468
- (190) Reichart D.E., 1999, ApJ 521, L111
- (191) Reichart D.E., et al., 2001, ApJ 552, 57
- (192) Rhoads J.E., 1997, ApJ 488, 579
- (193) Rhoads J.E., et al., 1998, GCN Circ. 144
- (194) Rhoads J.E., 1999, ApJ 525, 737
- (195) Rhoads J.E., Fruchter A.S., 2001, ApJ, 546, 117
- (196) Rodriguez L.F., Mirabel I.F., 1999, ApJ 511, 398
- (197) Sagar R., et al., 2000a, BASI 28, 15
- (198) Sagar R., et al., 2000b, BASI 28, 499
- (199) Sagar, R. et al., 2001a, BASI 29, 1
- (200) Sagar, R. et al., 2001b, astro-ph/0104249
- (201) Sahu K.C., et al., 1997a, Nature 387, 476
- (202) Sahu K.C., 1997b, ApJ 489, L127
- (203) Sahu K.C., et al., 2000, ApJ 540, 74
- (204) Sari R., Piran P., Halpern J.P., et al., 1999, ApJ 524, L43
- (205) Schaefer B., et al., 1997, IAU Circ. 6658
- (206) Schlegel D.J., Finkbeiner D.P., Davis M., 1998, ApJ, 500, 525
- (207) Shaviv N.J., Dar A., 1995, ApJ 447, 863
- (208) Smette A., et al., 2000, GCN Circ. 603
- (209) Smith D.A., et al., 2001, astro-ph/0103357
- (210) Sokolov V.V., et al., 1997, astro-ph/9709093
- (211) Sokolov V.V., et al., 1998, A&A 334, 117
- (212) Sokolov V.V., et al., 2000, astro-ph/0001357
- (213) Sokolov V.V., et al., 2001a, astro-ph/0102492
- (214) Sokolov V.V., et al., 2001b, A&A 372, 438
- (215) Sollerman J., et al., 2000, astro-ph/0006406
- (216) Soffitta P., et al., 1998, IAU Circ. 6884
- (217) Spruit H.C., Phinney, E.S., 1998, Nature 393, 189
- (218) Stanek K.Z., et al., 1999, ApJ 522, L39
- (219) Stanek K.Z. et al., 2001, astro-ph/0104329
- (220) Takeshima T. et al., 1999, GCN Circ. 478
- (221) Tingay S.J., et al., 1995, Nature 374, 141
- (222) Tinney C., et al., 1998, IAU Circ. 6896
- (223) Valentini G. et al., 2001, GCN Circ. 992
- (224) van den Bergh S. Tammann G.A., 1991, ARA&A 29, 363
- (225) van Dyk, S.D., Hamuy, M., Filippenko, A.V., 1996, AJ 111, 2017
- (226) van Paradijs J., et al., 1998, A&A 192, L147
- (227) Veillet C., 2000a, GCN Circ. 588, 598, 610, 611, 623
- (228) Veillet C., 2000b, GCN Circ. 831
- (229) Veillet C., 2001, GCN Circ. 998, 1000, 1003
- (230) Vrba, F., Canzian, B., 2000, GCN Circ. 819
- (231) Vreeswijk P.M., et al., 1999a, GCN Circ. 310, 324
- (232) Vreeswijk P.M., et al., 1999b, GCN Circ. 496
- (233) Vreeswijk P.M., et al., 1999c, ApJ 523, 171
- (234) Vreeswijk P.M., et al., 2000, ApJ 546, 672
- (235) Watanabe K., et al., 2001, GCN Circ. 993
- (236) Wieringa M.H., et al., 1999, A&AS 138, 467
- (237) Wijers R.A.M.J., et al., 1997, MNRAS 288, L5
- (238) Wilson A.S., et al., 2000, astro-ph/0008467
- (239) Woosley S.E., 1993, ApJ 405, 273
- (240) Woosley S.E., MacFadyen, A.I., 1999, A&AS 138, 499
- (241) Yoshida A., et al., 2001, astro-ph/0107331
- (242) Zapatero Osorio M.R., et al., 1998, IAU Circ. 6967
- (243) Zharikov S.V., et al. 1999, A&AS 138(3), 485
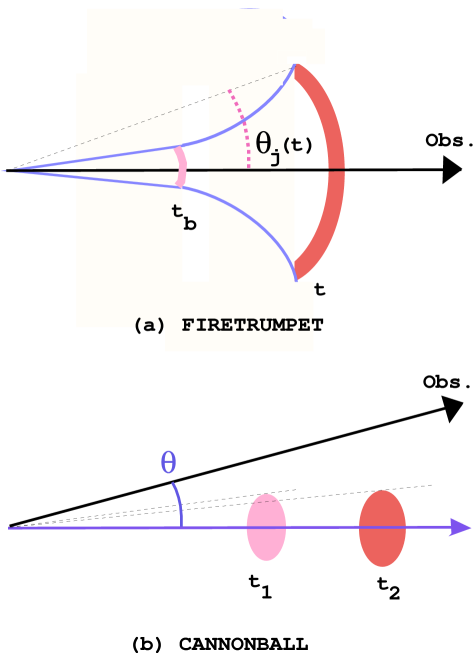
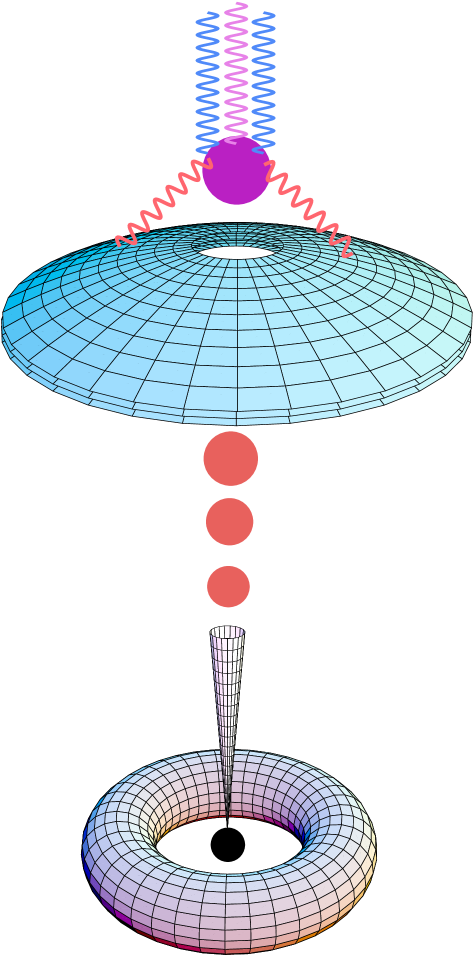
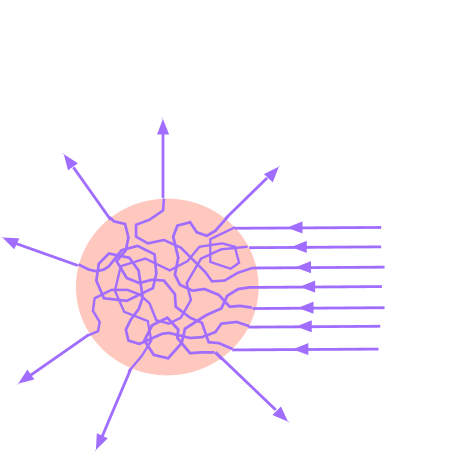
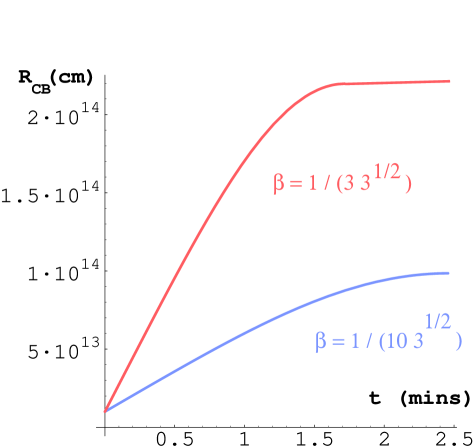
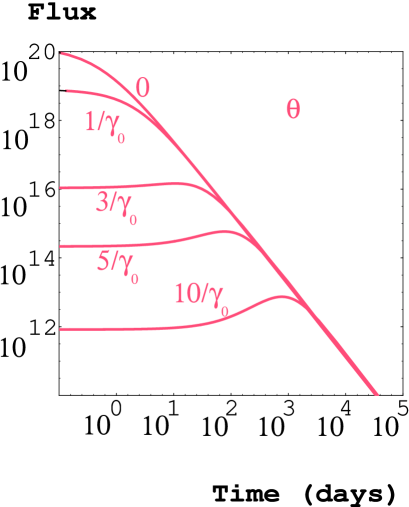
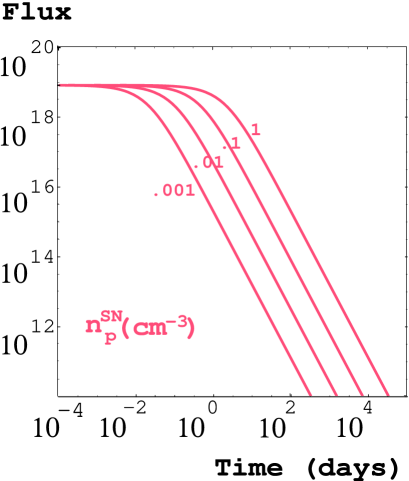

|

|

|

|

|

|

|

|

|

|

|

|

|

|

|

|

|

|

|

|

|

|

|

|

|

|

|

|

|

|

|

|

|

|

|

|

|

|


|
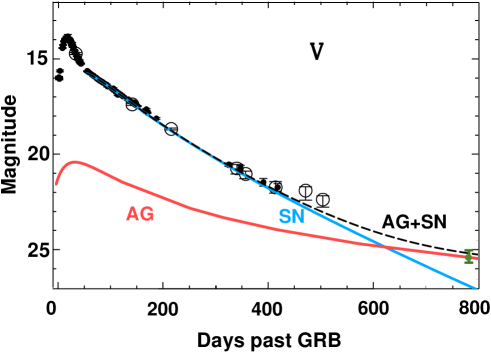
|