The X-ray Globular Cluster Population in NGC 1399
Abstract
We report on the Chandra observations of the elliptical galaxy NGC 1399, concentrating on the X-ray sources identified with globular clusters (GCs). A large fraction of the 2-10 keV X-ray emission in the Chandra image is resolved into point sources with luminosities ergs s-1. These sources are most likely Low Mass X-ray Binaries (LMXBs). In a region imaged by HST about 70% of the X-ray sources are located within GCs. This association suggests that in giant elliptical galaxies luminous X-ray binaries preferentially form in GCs. Many of the GC sources have super-Eddington luminosities (for an accreting neutron star) and their average luminosity is higher than the non-GC sources. The X-ray spectral properties of both GC and non-GC sources are similar to those of LMXBs in our Galaxy. Two of the brightest sources, one of which is in a GC, have an ultra-soft spectrum, similar to that seen in the high state of black hole candidates. The “apparent” super-Eddington luminosity in many cases may be due to multiple LMXB systems within individual GCs, but with some of the most extremely luminous systems containing massive black holes.
1 Introduction
Early X-ray surveys in the 1970s revealed that the ratio of Low Mass X-ray Binaries (LMXBs) to stellar mass is more than two orders of magnitude higher for globular clusters (GCs) than it is for the rest of our Galaxy (Clark 1975). This was surprising because globular clusters contain only a small fraction, , of the mass in our Galaxy. Yet, according to current estimates, they host 12 out of bright ( ergs s-1) Galactic X-ray sources. This overabundance of binaries led Fabian, Pringle, & Rees (1975) to propose that the LMXBs in GCs are formed via tidal capture of neutron stars in close encounters with main-sequence or giant stars, a mechanism that operates preferentially at the higher stellar densities found in GCs. As X-ray observatories have improved it has become possible to study the X-ray properties of GCs associated with the nearby galaxies. ROSAT observations of M31 revealed that the X-ray properties of its GCs are similar to those observed in our Galaxy, with a comparable fraction and luminosity distribution (Supper et al. 1997).
Early X-ray observations of elliptical galaxies showed that the dominant source of X-rays is keV emission from hot interstellar medium (ISM) (e.g., Forman, Jones, & Tucker 1985). ASCA spectral analysis of elliptical galaxies revealed the presence of a hard component, which was identified with an ensemble of LMXBs (Matsumoto et al. 1997, Matsushita et al. 1994). The LMXB origin was confirmed by the angular resolution Chandra images of two faint elliptical galaxies, NGC 1553 and NGC 4697, that resolved of the hard ( keV) X-ray emission into point sources (Sarazin, Irwin, & Bregman 2000; Blanton, Sarazin, & Irwin 2001). Further, in NGC 4697 at least of the X-ray point sources were found to be associated with globular clusters (Sarazin et al. 2001). The GC populations in elliptical galaxies, unlike our Galaxy and other late-type galaxies, show a bimodal distribution in optical colors and much higher number of GCs per galaxy luminosity (the specific frequency), with the highest number found in the central galaxies of clusters (Ashman & Zepf 1992). NGC 1399 is a giant elliptical galaxy in the center of the Fornax Cluster. It is particularly suitable for studying the X-ray properties of a GC population because it has four times the average elliptical galaxy GC specific frequency, and fifteen times that of a typical spiral galaxy. In this paper we present the X-ray properties of the GC population detected in the Chandra observations of NGC 1399.
2 Observations and Data Reduction
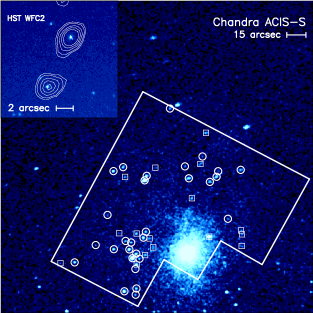
NGC 1399 was observed with the Chandra ACIS-S detector on January 18, 2000 for a total exposure of 55973 s. The galaxy was positioned at the center of the S3 chip, from the aim point. We used the standard pipeline data processing, corrected the data for the gain and quantum efficiency maps, removed bad pixels, and applied a aspect shift (see below). Additional observations were obtained with the ACIS-I on October 18, 1999 ( 3500 s) and January 19, 2000 (2000 s immediately following the ACIS-S observation). In this letter we concentrate on the S3 chip region that overlaps with observations taken with WFPC2 on HST (Grillmair et al. 1999), which was used to identify X-ray sources. The properties of the entire sample of X-ray sources detected in the Chandra images and the characteristics of the diffuse emission are given in Mushotzky et al. (2001, Paper II, in preparation).
The X-ray point sources were identified using a sliding cell detection algorithm, as implemented in XIMAGE, on the cleaned event file in the 0.3-10.0 keV energy band, with the detection threshold set at . The central is dominated in this energy band by the diffuse emission from the galaxy (see Fig 2 in Loewenstein et al. 2001) and is excluded from this analysis. A total of 214 sources were detected in the S3 chip of which 160 are above the level. These sources comprise a large fraction of the 2-10 keV diffuse X-ray emission (Paper II) previously detected with ASCA. The cosmic X-ray background is expected to contribute 20 objects across this region (Mushotzky et al. 2000). Each source was visually inspected to ensure that it is a solid detection. The 0.3–10 keV count rates were corrected for exposure, vignetting, and point spread function. The source background was evaluated in nearby regions. The faintest source detected is cts s-1 – corresponding to a luminosity of ergs s-1 for a distance to NGC 1399 of 20.5 Mpc (Merritt and Ferrarese 2001).
3 Source Identification with GCs and Their Characteristics
To optically identify the Chandra X-ray sources we used the HST WFPC2 images from Forbes et al. (1998). The list of GCs (678 objects) derived from these images, along with their B and I band magnitudes, were provided by C. Grillmair. The HST image covers less than 30% of the S3 Chandra field of view and includes 45 of the 214 X-ray sources detected in the S3 chip (Fig 1). 39 of these X-ray sources have a signal to noise ratio (SNR) greater than . One source is elongated in the X-ray image, inconsistent with a single point source, and is excluded from further analysis.
The X-ray contours overlaid on the HST image reveal a systematic offset in declination of about . A similar displacement was seen comparing the October Chandra ACIS-I observation with the January ACIS-S observation. Applying a declination shift of to the Chandra data, the galaxy centroid measured in the HST image became consistent with that measured with Chandra, and the ACIS-I and ACIS-S images come into alignment. Following this correction, we assumed that the absolute X-ray positions are accurate to , the size of the Chandra point spread function. For 26 X-ray sources the closest HST object – all identified as GCs – is within . An additional 7 X-ray sources are from the nearest HST object, all GCs. The remaining 5 X-ray sources have positions more than away from any HST object. We consider all 26 sources at distances from GCs as positive identifications. This corresponds to of the (38) sources. Among the sources there are 3 additional possible GC identifications; however, we discuss the source characteristics only of the 38 objects detected above . If the shift is not applied the number of matches within is reduced to 1, demonstrating that chance coincidence is unlikely. The GC X-ray sources are homogeneously distributed within the HST FOV (Fig 1). The 38 objects have count rates that range from to cts s-1. The GC X-ray sources are on average brighter than the unidentified sources. Three of the sources, two of which are associated with GCs, are exceptionally bright by factors above the average count rate.
We constructed a color-color diagram (Fig 2) by dividing the data into 3 energy bands: 0.3–1 keV, 1–2 keV and 2–10 keV. Only sources above ( counts) are included in the plot. There is a distinct cluster of sources with a “hard” color, consistent with low Nh and power-law photon indices ranging from 1–2. A few have softer (power-law index 2–3) spectra. GC and unidentified sources occupy identical regions in the color-color diagram. Two of the three brightest sources are very soft, with only one located in a GC. The other very bright (GC) source is harder, located in the densely populated region of the color-color diagram. To determine the conversion factor to flux, composite spectra were obtained for the globular and non-globular samples, excluding the 3 brightest sources that were individually fit. Absorbed power-law (with photon index ) and bremsstrahlung (with temperature keV) models fit both spectra with similar best-fit parameters and Nh consistent with the Galactic value of cm-2. Our adopted conversion factor is erg cm-2 ct-1, consistent within for both models. Two of the brightest source spectra are well fit by power-laws of indices 3.4 and 2.7 (the former is in a GC) and absorption higher ( cm-2) than the Galactic value. The spectral parameters of the other brightest (GC) source are instead similar to those of the composite spectra.
Figure 3a compares the X-ray luminosity distribution for all 38 objects with that of the X-ray GC sources. Most of the unidentified sources are within the ergs s-1 bin. Above ergs s-1 the GC sources are clearly in excess compared to the few unidentified sources. Excluding the 3 brightest sources, the average luminosity of the globular cluster X-ray sources is ergs s-1, compared to for the unidentified sources. Including the brightest sources, the average increases by 2 and 1.5 for the globular and non-globular samples, respectively.
Only the 3 brightest sources have sufficient counts () to search for short term variability. Light curves with 320 and 3200 second bins of the 3 sources are consistent with a constant at probability . Variability on a longer time scale, for the 3 brightest sources, was tested using the October 1999 observation. The predicted ACIS-I rate assuming the spectral parameters measured by ACIS-S are within of the observed count rate in ACIS-I.
The average B and B-I of all X-ray globular sources above are B and B-I= with 17 of 26 sources having B-I larger than the average for the entire optical sample. The color (B-I) distribution for all clusters (see Fig 2 in Grillmair et al. 1999) is bimodal as seen in other elliptical galaxies. The GCs containing X-ray sources cover the full range of B-I, with a statistically marginal tendency to be redder than GCs in general. A weak correlation exists between the X-ray flux and B-I (redder GCs are fainter X-ray sources), that breaks down for the brightest sources. No correlation is seen between the X-ray flux and either B or I (Fig 3b), however there is a notable absence of X-ray detections in GCs fainter than 25th magnitude (Fig 3c). Overall, only a small percentage of optically luminous GCs contain luminous X-ray sources. The X-ray GC sources are on average magnitudes brighter in the optical than the average of all GCs in the HST FOV (Fig 3c). The KS test yields a low probability () that the X-ray globular magnitudes are drawn from the same distribution as the total globular sample. This increases to if the total sample is restricted to .
4 Discussion
The Chandra observations of NGC 1399 presented here show that 70% of the detected X-ray point sources, outside the central of the galaxy, are associated with GCs. The average spectral properties of these sources are similar to those of LMXBs in our Galaxy. The X-ray sources in GCs have on average a higher luminosity compared to those not associated with GCs, with many above ergs s-1, the Eddington limit for spherical accretion onto a 1.4 M⊙ neutron star. Estimates of the distance to NGC 1399 range from Mpc (20.5 Mpc is used here; Ferrarese et al. 2000). Even including a 30% uncertainty in the luminosity, the majority of sources remain above the Eddington luminosity. These findings suggest that luminous LMXBs in giant elliptical galaxies are preferentially located in GCs. This result is quite remarkable considering that in our Galaxy (and in M31) only 10% of LMXBs are in GCs – with a typical luminosity of ergs s-1, well below the threshold luminosity, ergs s-1, for detecting point sources in this Chandra exposure of NGC 1399. Moreover, there are no GC sources with ergs s-1 in our Galaxy, nor in any of the GCs in M31 reported by Supper et al. (1997). Super-Eddington luminosities in GC sources are also seen in the faint elliptical galaxy NGC 4697 (Sarazin et al. 2001).
The luminosity distribution (Fig 3a) of all sources in NGC 1399 seems to be divided into 3 groups. The 3 extremely bright sources detected at luminosities greater than ergs s-1 form one group. Of these, two are identified with GCs and two have ultra-soft spectra. A second, intermediate luminosity, group of sources have luminosities between 2 and 10 ergs s-1. Of these, 15 out of 18 are identified with GCs. A third group, with about half of the sources in GCs, have luminosities ergs s-1 , with an average of ergs s-1.
All the LMXBs found in GCs in our Galaxy have luminosities between ergs s-1 and ergs s-1 with many of them transient sources (Hut et al. 1992). The Galactic GCs tend to be, on average, less luminous than the Galactic bulge or burst sources. Verbunt, van Paradijs & Elson (1984) showed that this difference cannot be explained by the metallicity or mass of the secondary and concluded, given the small number of sources, that the GC and Galactic sources are probably still drawn from the same luminosity distribution. If the GC X-ray sources in NGC 1399 are formed by the tidal capture of a neutron star or the exchange collision mechanism (Fabian, Pringle, & Rees 1975; Hut, Murphy, & Verbunt 1991), then these models must account for the large number of super-Eddington luminosity sources. One possibility is that some of these GCs contain multiple LMXB systems. To explain the high-luminosity tail of the intermediate luminosity group, requires either a modest number of LMXBs () per GC at the Eddington luminosity or a larger number of lower luminosity systems resulting from a higher collision rate compared to Galactic clusters.
The higher luminosity sources above ergs s-1, may form a distinct population. The ultra-soft spectra observed in two of the brightest systems, one of which is in a GC, are similar to those of high-state black holes seen in our Galaxy. The luminosities are then accounted for by fairly massive black holes ( M) accreting close to the Eddington limit. The last of the brightest GC sources has a power-law index of , similar to the brighter sources in the intermediate luminosity group that also show harder color in the color-color plot. This spectral characteristic is typical of low-state black hole systems (like GS 2000+251, GS 1124-68) and, although this seems inconsistent with their high luminosity, similar spectral behavior at high luminosities has been seen from the black-hole transient GS2030+338 (Tanaka & Lewin 1995) or from luminous X-ray sources in several nearby galaxies (Makishima et al. 2000). It is particularly notable that these sources may contain black holes, since no black hole candidates have previously been detected in GC sources in our Galaxy. It was suggested that this is because black holes formed in dense clusters are likely to be ejected from the cluster due to dynamical effects (Zwart & McMillan 2000). In an intermediate density cluster, if a black hole survives, it may be able to form a LMXB (Kulkarni, Hut, & McMillan 1993). In our Galaxy such systems are expected to be in quiescence most of the time – with occasional transient outbursts (White, Swank, & Holt 1983). If this is the case, we expect to observe flux variations on a time-scale of a month as the outburst decays. In our limited number of observations this has not yet been observed, but given the lack of monitoring to date, this is inconclusive.
The hard spectral component in elliptical galaxies seen with ASCA is resolved into (mostly luminous) LMXBs. Both the high ratio of hard-X-ray-to-optical luminosity and the high coincidence rate of X-ray sources in globulars, can be attributed to the high globular cluster specific frequency in NGC 1399. The GC bimodal B-I color distribution in NGC 1399 shows an unusually large fraction of red clusters. Whether the specific frequency or the abundance of red clusters are the determining factors in the total number of LMXBs in ellipticals and, indeed, in galaxies of all types (Sarazin et al. 2001), will be determined as more Chandra galaxy observations are analyzed and compared.
The luminosity threshold of this Chandra observation of ergs s-1 exceeds most of the luminosity range of the 12 GCs detected in our own Galaxy. The origin of the “super-Eddington” X-ray sources in the GCs in NGC 1399 may simply be explained as multiple LMXBs within a single GC, or they may be black holes. Clearly we are only sampling the tip of the distribution of a much larger LMXB population. Understanding the relative size of the GC and non-GC populations, how the GCs in NGC 1399 relates to that of our own Galaxy and models for their formation will require a factor of ten deeper exposure with Chandra to cover the entire luminosity range of LMXBs in GCs seen in our Galaxy.
Acknowledgements. We are very grateful to C. Grillmair for providing the list of the globular positions and magnitudes, and to Eliot Malumuth for assistance with HST images. We thank Frank Verbunt for useful discussion and Nicholas White for many helpful comments.
References
- Ashman & Zepf (1992) Ashman, K. M., & Zepf, S. E. 1992, ApJ, 384,50
- Blanton, Sarazin, and Irwin (2001) Blanton, E. L., Sarazin, C. L., & Irwin, J. A. 2001, ApJ, 552, 106
- Clark (1975) Clark , G.W. 1975, ApJ, 199, L143
- Fabian, Pringle, and Rees (1975) Fabian, A. C., Pringle,F.E. and Rees, M.J. 1975, MNRAS, 172, 15p
- Ferrarese et al (2000) Ferrarese, L. et al. 2000 ApJ, 529, 745
- Forbes et al. (1998) Forbes, D. A., Grillmair, C. J., Williger, G. M., Elson, R. A. W., & Brodie, J. P. 1998, MNRAS, 293, 325
- Forman, Jones, and Tucker (1985) Forman, W., Jones, C., & Tucker, W.C. 1985, ApJ, 293,102
- Grillmair et al. (1999) Grillmair, C. J., Forbes, D.A., Brodie, J. P., Elson, R. A. W. 1999 ApJ, 117, 180
- Hut, Murphy and Verbunt (1992) Hut, P., Murphy, B. W., & Verbunt, F. 1991, A&A, 241, 137
- Hut et al (1992) Hut, P., et al. 1992, PASP, 104, 981
- Kulkarni and McMillan (1993) Kulkarni, S.R., & McMillan, S. 1993, Nature, 364, 421
- Loewenstein, Mushotzky, Angelini (2001) Loewenstein, M., Mushotzky, R. F., Angelini, L., Arnoud, K. A., & Quataert, Eliot, ApJ, 555,21
- Makishima et al. (2000) Makishima, K., et al., 2000, ApJ, 535,632
- Matsumoto et al. (1997) Matsumoto, H., Koyama, K., Awaki, H., Tsuru, T., Loewenstein, M., & Matsushita, K. 1997, ApJ, 482, 133
- Matsushita et al. (1994) Matsushita, K., et al. 1994, ApJ, 436, L41
- Merritt & Ferrarese (2001) Merritt, D., & Ferrarese, L. 2001, MNRAS, 320, 30
- Mushotzky et al. (2001) Mushotzky, R. F., Cowie, L. L., Barger, A. J., Arnaud, K. A. 2000, Nature, 404, 459.
- Sarazin, Irwin, and Bregman (2000) Sarazin, C. L., Irwin, J. A., & Bregman, J.N. 2000, ApJ, 544, 293
- Sarazin, Irwin, and Bregman (2001) Sarazin, C. L., Irwin, J. A., & Bregman, J.N. 2001, ApJ, in press
- Supper et al. (1997) Supper, R., Hasinger, G., Pietsch, W., Truemper, J., Jain, A., Magnier, E. A., Lewin, W. H. G., & van Paradijs, J. 1997, A&A, 317, 328
- Tanaka and Lewin (1995) Tanaka Y., & Lewin W.H.G, 1995, X-ray binaries, ed. W.H.G Lewin, J. van Paradijs & E.P.J. van den Heuvel, Cambridge University Press, 126
- Verbunt, van Paradijs, J. and Elson (1984) Verbunt, F., van Paradijs, J., & Elson, R. 1984, MNRAS, 210, 899
- White, Swank and Holt (1983) White, N. E., Swank, J., & Holt, S.S. 1983, ApJ, 207, 711
- Zwart and McMillan (2000) Zwart, S. F. P., & McMillan, S. L. 2000, ApJ, 528, L17