THE REST-FRAME OPTICAL PROPERTIES OF GALAXIES 11affiliation: Based on data obtained at the W.M. Keck Observatory, which is operated as a scientific partnership among the California Institute of Technology, the University of California, and NASA, and was made possible by the generous financial support of the W.M. Keck Foundation.
Abstract
We present the results of a near-infrared imaging survey of Lyman Break Galaxies (LBGs). The survey covers a total of 30 arcmin2 and includes 118 photometrically selected LBGs with band measurements, 63 of which also have band measurements, and 81 of which have spectroscopic redshifts. Using the distribution of optical magnitudes from previous work and colors for this sub-sample, we compute the rest-frame optical luminosity function of LBGs. This luminosity function is described by an analytic Schechter fit with a very steep faint end slope of , and it strikingly exceeds locally determined optical luminosity functions at brighter magnitudes, where it is fairly well constrained. The -band luminosity density of only the observed bright end of the LBG luminosity function already approaches that of all stars in the local universe.
For the 81 galaxies with measured redshifts, we investigate the range of LBG stellar populations implied by the photometry which generally spans the range 900–5500 Å in the rest-frame. The parameters under consideration are the star-formation rate as a function of time, the time since the onset of star-formation, and the degree of reddening and extinction by dust. While there are only weak constraints on the parameters for most of the individual galaxies, there are strong trends in the sample as a whole. With a wider wavelength baseline than most previous studies at similar redshifts, we confirm the trend that intrinsically more luminous galaxies are dustier. We also find that there is a strong correlation between extinction and the age of the star-formation episode, in the sense that younger galaxies are dustier and have much higher star-formation rates. The strong correlation between extinction and age, which we show is unlikely to be an artifact of the modeling procedure, has important implications for an evolutionary sequence among LBGs. A unified scenario which accounts for the observed trends in bright LBGs is one in which a relatively short period of very rapid star-formation (hundreds of M☉ yr-1) lasts for roughly 50–100 Myr, after which both the extinction and star-formation rate are considerably reduced and stars are formed at a more quiescent, but still rapid, rate for at least a few hundred Myr. In our sample, a considerable fraction (%) of the LBGs have best-fit star-formation ages Gyr, implied stellar masses of M☉, and are still forming stars at M☉ yr-1.
1 INTRODUCTION
In the past few years, considerable progress has been made in our understanding of the nature of high redshift galaxies, driven mostly by the availability of large samples that have been photometrically selected using rest-frame UV spectral features. The largest existing sample at present is at , where it is efficient to use ground-based imaging through optical filters designed to isolate the Lyman limit spectral discontinuity at 912 Å in the rest-frame, and where the spectroscopic follow-up has proved to be straightforward because many important spectral features are well-placed at wavelengths where optical spectrographs are most sensitive (Steidel et al. 1996a, Steidel et al. 1999). Very deep Hubble Space Telescope (HST) imaging such as that provided by the Hubble Deep Fields has also proved to be very effective, using similar techniques for (Steidel et al. 1996b, Madau et al. 1996, Lowenthal et al. 1997). The HST data reach much deeper into the high redshift galaxy UV luminosity function, but are confined to very small areas on the sky; as such, the ground-based and space-based surveys have been largely complementary (cf. Steidel et al. 1999).
To date, most of the work on these high redshift galaxy samples has focused on the large-scale clustering properties of the galaxies (e.g., Adelberger et al. 1998, Giavalisco et al. 1998, Steidel et al. 1998, Giavalisco & Dickinson 2001), on the properties of individual galaxies as deduced from their spectra (e.g., Pettini et al. 1998, 2000, 2001), or on inferences concerning the universal star-formation history as deduced from the global UV luminosity density (e.g., Madau et al. 1996, Steidel et al. 1999, Meurer, Heckman, & Calzetti 1999, Adelberger & Steidel 2000). The strong clustering of the bright Lyman Break Galaxies (LBGs) has generally been interpreted as indirect evidence that the observed galaxies reside in relatively massive dark matter halos, but how these galaxies are linked to present-day galaxies is far from clear, and has been quite controversial. While considerable, the directly-observed UV luminosity of LBGs is clearly very significantly modified by extinction (see Adelberger & Steidel 2000, hereafter AS2000, for an extensive discussion of this topic), and at best provides information on the instantaneous formation rate of O and B stars.
While the far-UV properties of the LBGs are the most straightforward to study observationally, it is also of interest to explore additional properties of these galaxies that require longer wavelength observations, to be used in concert with the existing far-UV measurements. For example, one would like to determine the distribution of rest-frame optical luminosities, and the star-formation histories, ages, dust content, and stellar masses— all necessary for understanding the range of objects selected with the typical Lyman Break photometric criteria, and the relationship of these objects to galaxies in the lower redshift universe. Indeed, different models provide quite divergent descriptions of the nature and fate of the objects which are identified as LBGs. According to one model, the galaxies selected as LBGs are bright in the rest-frame UV because they are experiencing merger-induced starburst events. The intense starburst events occur on relatively short timescales (less than 100 Myr), and produce 10-100 times less stellar mass than what is seen in a typical galaxy. Such low-mass bursting objects would then be the precursors of local low-mass spheroids, unless they merge with similar objects to form more massive systems (Lowenthal et al. 1997; Sawicki & Yee 1998; Somerville, Primack, & Faber 2001). Alternatively, LBGs are the central objects in relatively massive dark matter halos, which form stars steadily but relatively quiescently over longer than 1 Gyr timescales, accumulate by , and evolve eventually into the ellipticals and spiral galaxies at the bright end of the local luminosity function (Steidel et al. 1996a; Baugh et al. 1998).
It is not possible to determine the nature of LBG stellar populations— and thereby distinguish between the above scenarios— with only optical observations probing the rest-frame UV. Both an aging stellar population and increasing dust extinction result in redder rest-frame UV colors, so that the effects of age and dust are degenerate without longer wavelength data. Recent studies (Sawicki & Yee 1998; Dickinson 2000; Papovich, Dickinson, & Ferguson 2001) have shown that the addition of near-IR photometric measurements at rest wavelengths longer than the location of an age-sensitive spectral break at removes some of the degeneracy between dust and age in the modeling of LBG stellar populations. Here we present the results of a moderately large near-IR survey of optically selected LBGs, designed to determine the distribution of rest-frame optical luminosities of LBGs, and, where possible, information about their star-formation histories. In §2, we present the details of the optical and near-IR observations and data reduction. §3 summarizes the distribution of optical-IR colors of LBGs. In §4, we describe the derivation of the LBG rest-frame optical luminosity function, and compare it to local galaxy luminosity functions. §5 presents the procedure and results of population synthesis modeling of the LBG spectral energy distributions between 900 Å and 5500 Å in the rest-frame, using the measured optical/IR colors. Extensions of the model results to rest-frame UV spectroscopy are discussed in §6, and an evolutionary sequence for LBGs is proposed in §7. Our general conclusions are summarized in §8.
2 OBSERVATIONS AND DATA REDUCTIONS
2.1 Optical Imaging
Optical images were obtained for all the fields included here as part of our extensive survey for galaxies; the field centers are given in Table 1. The optical imaging data were collected during the interval 1995 - 1998 at the William Herschel Telescope (3C 324, B2 0902+34, and CDFa), the Palomar 200 inch Hale Telescope (CDFa, DSF2237a, DSF2237b, HDF, Q0201, Q0256, SSA22a, and SSA22b), and the Kitt Peak Mayall 4 meter Telescope (Westphal). The details of our survey have been presented elsewhere (Steidel et al. 1996a, Giavalisco et al. 1998, Steidel et al. 1999), so here we present only a summary of its relevant features. In deep , , (Steidel & Hamilton 1993) images, with typical 1 surface brightness limits of 29.1, 29.2, 28.6 magnitudes per arcsec2, respectively, we identify galaxy candidates by their distinctive colors. To select the objects in the sample centered at , the photometric criteria consist of the following:
These criteria effectively isolate star-forming galaxies whose redshifts place the Lyman continuum discontinuity within the band, and result in a redshift distribution that is reasonably well-described by a Gaussian with and a standard deviation of . The various biases inherent in such photometric selection have been discussed extensively by Steidel et al. (1999). At the time of this writing, there are approximately 1000 LBGs in this redshift range that have been spectroscopically confirmed using the Low Resolution Imaging Spectrometer (LRIS; Oke et al. 1995) at the W. M. Keck Observatory. The full optical survey and spectroscopic catalogs will be presented elsewhere.
2.2 Near-IR Imaging
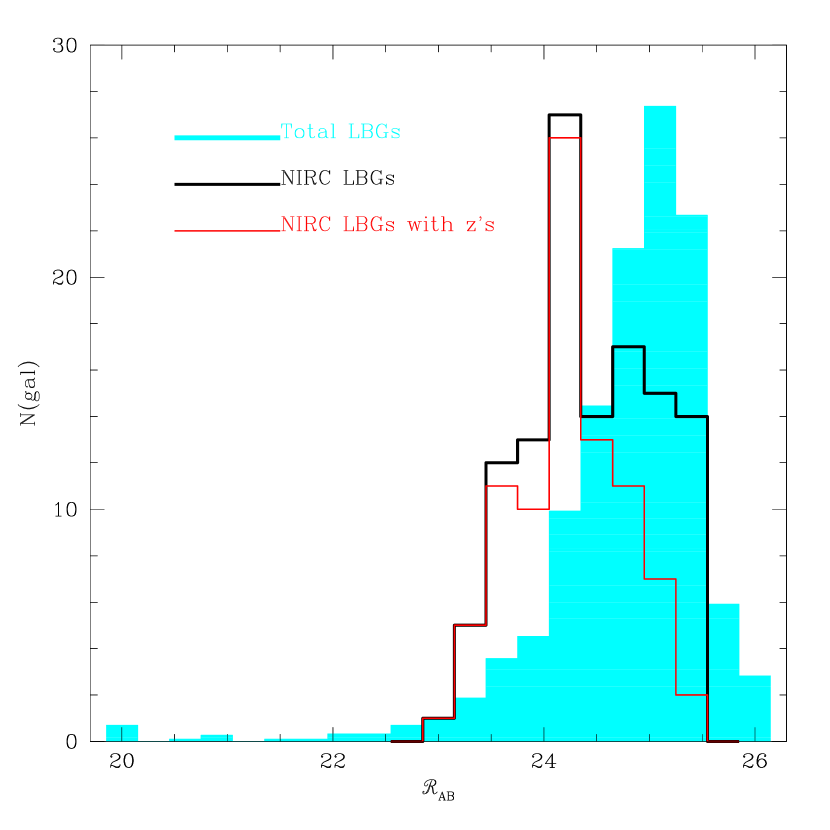
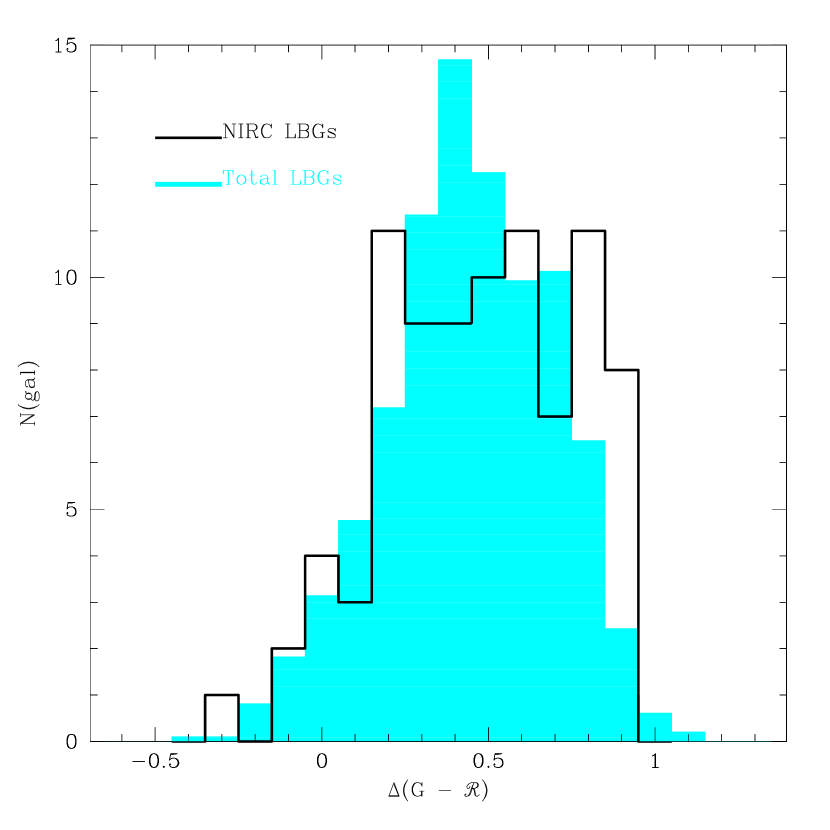
To explore the range of optical/near-IR colors present in our sample of high redshift galaxy candidates and spectroscopically confirmed galaxies, a subset of objects was selected for follow-up near-IR imaging. Objects bright in were preferentially selected for near-IR imaging, as can be seen by the relative distributions of apparent magnitude in the near-IR sample and that in our sample as a whole (Figure 1a). We deliberately selected objects whose rest-UV-inferred extinction properties (see Steidel et al. 1999 and AS2000 for a discussion) spanned the entire range seen in the full LBG survey, from zero to several magnitudes of extinction in the rest-frame UV. Within the LBG selection function, galaxies with higher redshifts suffer greater absorption by intergalactic H I, resulting in systematically redder colors for a fixed intrinsic spectral energy distribution (SED). Figure 1b shows the distributions of , the color statistically corrected for IGM absorption, for both the NIRC LBG sample and the LBG sample as a whole. This figure shows that, in an effort to target galaxies with extreme values of implied extinction with NIRC, we over-sampled the reddest bins by roughly a factor of 2 relative to the rest of the distribution.
All of the near-IR data were obtained with the facility near-IR camera (NIRC) (Matthews & Soifer 1994) on the W.M. Keck I Telescope during the course of 9 separate observing runs in the interval 1997 May - 1999 May. NIRC has a InSb array, with a pixel scale of , resulting in a field. This field size represents less than 1% of the large optical pointings used to find LBGs (typically 9 by 9) which contain 100-150 candidates to . To maximize efficiency, we preferentially targeted objects having at least one other LBG within ″. A typical pointing included 2–3 LBGs, but this number varied from 1 to 7 LBGs per pointing. Each NIRC pointing contained at least one primary target galaxy with a spectroscopic redshift, and, in many cases, additional LBG candidates for which spectra have not yet been obtained. There are spectroscopic redshifts for about 75% of the full sample.
We observed at and , using the standard and filters. Using integration times of seconds and seconds per exposure, we dithered the telescope between exposures to form a 9-point box pattern on the sky, each box position separated by a few arcseconds. In most cases, we aimed to complete 6 or more sets of the 9-point dither pattern for each NIRC pointing. During the dither pattern the telescope was guided with an off-set CCD camera, with the orientation of the NIRC detector chosen so that a suitable guide star would fall on the guider chip. Table 1 summarizes the coverage of the NIRC survey with respect that of the optical survey for LBGs, listing the angular area and number of LBGs covered in and for each optical survey field. The optical fields listed in Table 1 do not represent the entire optical LBG survey, but only the fields which contain NIRC pointings. Table 2 summarizes all of the NIRC target pointings, the objects contained in each pointing, and the total integration times for each pointing.
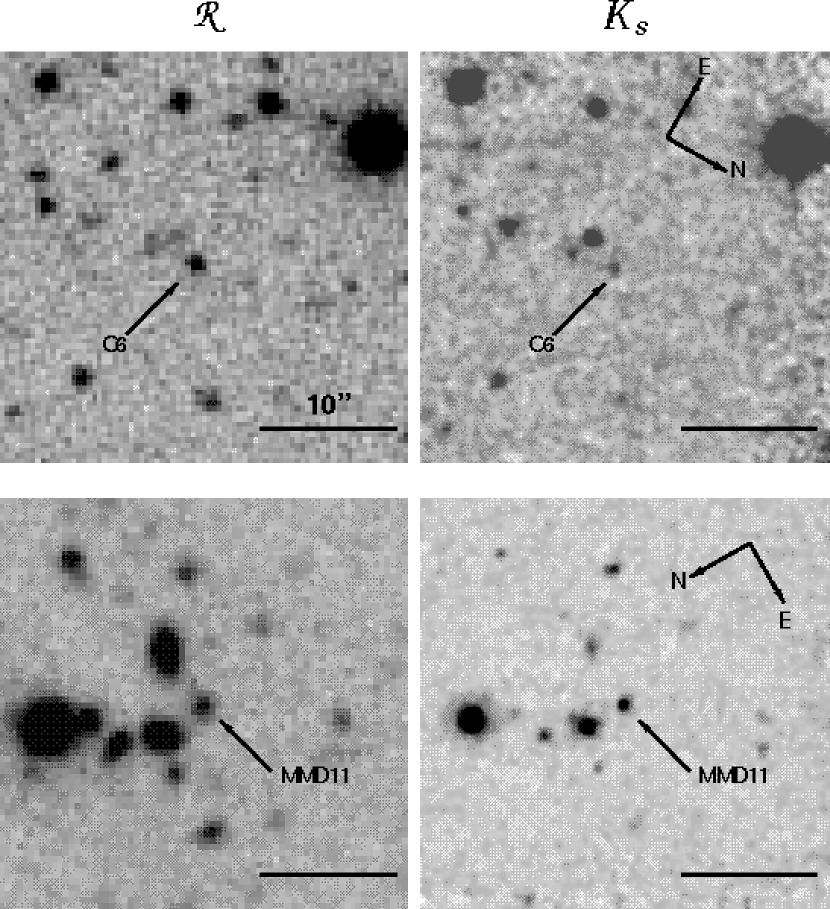
The data were reduced using standard procedures with the aid of the DIMSUM111Deep Infrared Mosaicing Software, a package of IRAF scripts by Eisenhardt, Dickinson, Stanford, and Ward, available at ftp://iraf.noao.edu/contrib/dimsumV2/ package. On clear nights, we determined the photometric zeropoints for the and bandpasses with observations of faint (11th - 12th magnitude) near-infrared standard stars from the list of Persson et al. (1998). During 5 of our 9 NIRC runs, we experienced stable, photometric conditions, while the remaining 4 runs contained variable cirrus. On runs with variable conditions, we carefully calibrated observing sequences with observations obtained when the conditions were judged to be photometric. As measured from the FWHM of standard stars, the seeing during our several NIRC runs ranged from in both and , with FWHM″ being typical. Figure 2 shows two different examples of and images of LBGs surveyed with NIRC. Westphal-MMD11 has the reddest color and brightest magnitude in the NIRC LBG sample, while B20902-C6 is in the bluer and fainter half of the NIRC LBG sample.
2.3 Optical/Near-IR Photometry
Prior to the measurement of optical/near-IR colors, each NIRC frame was smoothed with a Gaussian to match the image quality in the corresponding optical images, which generally had . The photometry was then performed in a manner analogous to that used for galaxy searches, described elsewhere (Steidel et al. 1995; Steidel & Hamilton 1993). In brief, using a modified version of the FOCAS (Valdes 1982) image detection and analysis routines, a catalog of isophotal and “total” object detections was generated in the (where “total” refers to the FOCAS definition, which is the flux measured within an aperture grown to twice the area of the initial detection isophote). The isophotal detection apertures were applied to the and images, to measure and colors. Table 3 lists the total magnitudes, , , isophotal colors, and redshifts for all objects in the NIRC sample. Optical magnitudes ( and ) and colors are referenced to the system, whereas the near-IR magnitudes (, and ) are on the Vega system. 222To convert from Vega magnitudes to magnitudes, we adopt the transformations: , . The standard relation between magnitude and flux-density, , is: where is in units of ergs s-1 cm-2 Hz.
2.4 Photometric Uncertainties
To quantify the uncertainties in the measured and colors, we ran Monte Carlo simulations mimicking the actual process used to measure magnitudes and colors from the real data. Artificial galaxies, with a reasonable range of intrinsic sizes and with magnitudes and colors drawn randomly from the observed range of both quantities, were added to the images after convolution with the seeing disk. We then produced detection catalogs in and measured the colors with matched apertures in the image. The process of adding fake galaxy sets (the number of galaxies added in a given trial was kept small enough so as not to alter the systematics of the observed data frames) and recovering the magnitudes and colors using the same procedures used for the real data was repeated until enough detections were obtained to study the scatter between true and recovered color as a function of recovered and . The Monte-Carlo generated photometric uncertainties are significantly larger than those that would result from the application of simple Poisson counting statistics that neglect systematics.
The detections of artificial objects were binned in 0.5 mag steps in measured magnitude and 0.2 mag steps in measured color. The mean and standard deviation were then computed for the distribution of in each bin. In general we did not find a significant systematic offset between the measured and true colors, so the color uncertainties are treated as symmetric. Accordingly, we adopted the standard deviation of the distribution as the color uncertainty, for each bin.
To be conservative, we initially treated each NIRC pointing independently for the estimation of photometric uncertainties in order to explore possible variations due to slightly different depths, seeing conditions, and sky background. We subsequently determined that the trend of with was similar enough in all NIRC pointings that we simply combined the simulation results from all pointings to calculate an average trend of with for our entire sample. Uncertainties were then assigned to the measured colors in the NIRC sample, based on the magnitude and color of each object.
An identical procedure was used to generate uncertainties in the colors of all of the observed galaxies. The uncertainties were computed from a separate, but similar, set of Monte Carlo simulations (Adelberger 2001). All the color uncertainties are listed along with the optical/IR photometry in Table 3.
3 THE OPTICAL/IR COLORS OF LYMAN BREAK GALAXIES
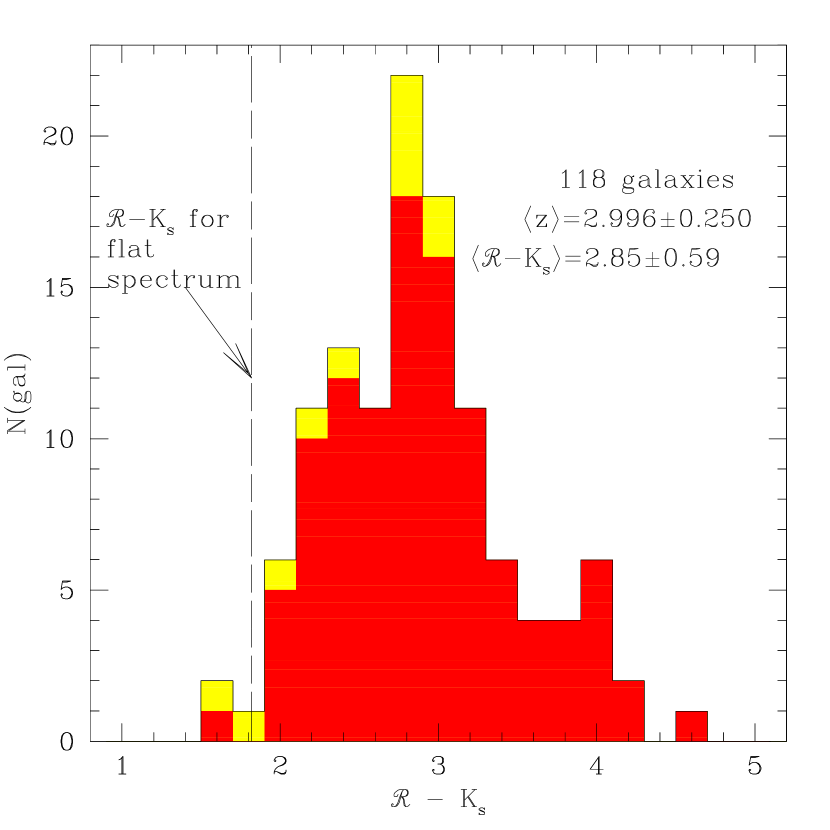
The distribution of measured optical-IR colors for the 118 galaxies with NIRC data is shown in Figure 3. 107 of these measurements are detections significant at the level, while 11 of them are only upper-limits, whose limits correspond to the typical detection limit of in our images. We find a mean color of and a standard deviation . Of these 118 galaxies, 81 have measured redshifts, with a mean of . There are band measurements for 63 of the galaxies in the sample. The mean color is with . At , the and filters correspond to , and in the rest-frame, respectively, whereas the optical passbands , , and sample the galaxies at rest-frame 900, 1200, and 1700 Å, respectively.
Clearly, there is a wide range of optical/near-IR color among the rest-UV selected LBGs; the bluest galaxies in have colors that are essentially flat in units from the far-UV to the optical in the rest-frame, whereas the reddest LBGs approach the colors of “extremely red objects”. The typical color of LBGs is more than 2.5 magnitudes redder than that expected for an unreddened instantaneous burst of star-formation at the mean redshift of our sample ( = 0.30), but is significantly bluer than most galaxies in the present-day universe (cf. Papovich et al. 2001). Unfortunately, in the absence of high quality spectra covering the same large wavelength range, the interpretation of the colors of LBGs in the context of understanding their stellar populations and extinction must rely heavily on models. In §5, we use the full set of optical-IR colors () of LBGs in the NIRC sample in an attempt to disentangle the degenerate effects of dust and age on LBG broadband spectral energy distributions.
4 REST-FRAME OPTICAL LUMINOSITY FUNCTION
The distribution of redshifts and observed and magnitudes have been used to construct rest-frame far-UV luminosity functions for LBGs at and respectively (Steidel et al. 1999). With near-IR magnitudes and optical-IR colors for a sample of 118 LBGs, we have the necessary information to construct the rest-frame optical luminosity function of LBGs, which is much more easily compared with galaxies in the present-day universe. Optical emission is much less attenuated than far-UV light by the presence of dust, and expected to be less directly linked to the instantaneous star-formation rate, as the stars giving rise to the optical emission sample a larger swath of the main sequence and include stars with longer lifetimes than the O/B stars producing the far-UV light. Thus, one might hope that the optical luminosities provide more information on the integrated stellar populations of the LBGs than can be obtained from far-UV measurements.
At , the mean redshift of the LBG spectroscopic sample (and of the NIRC sample as well), the -band central wavelength of is quite a good match to the central wavelength of the standard optical filter. While the NIRC sample contains galaxies with a range of redshifts, the -band central wavelength falls within the rest-wavelength range for the bulk of the sample. Furthermore, the “photometric depth” of the LBG redshift selection function corresponds to a difference in absolute magnitude of only magnitudes for a given apparent magnitude; consequently, given our typical measurement uncertainties, we view it as a reasonable approximation for this analysis to treat all the galaxies in the NIRC sample as if they were located at the mean redshift of the entire LBG spectroscopic sample. This of course allows us to use the whole NIRC sample, and not just the objects with spectroscopic redshifts, for the luminosity function analysis.
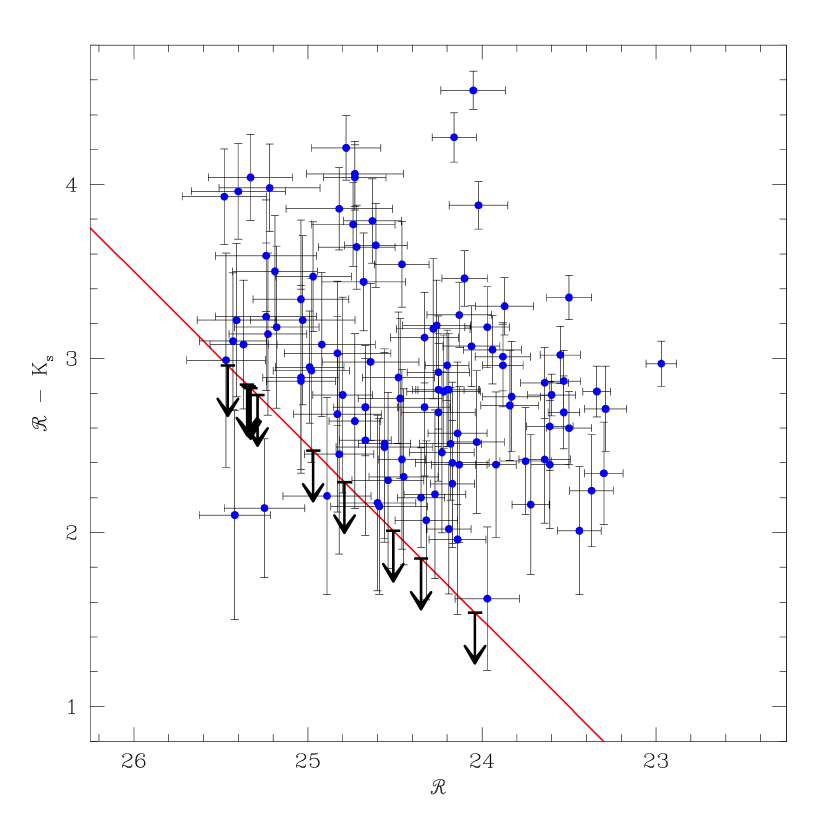
Two pieces of information are required to construct the rest-frame optical luminosity function for LBGs at : the LBG rest-frame UV luminosity function (i.e. the distribution of apparent magnitudes), and the LBG distribution of as a function of magnitude for the NIRC sample. The best-fit apparent magnitude luminosity function parameters for LBGs (uncorrected for the effects of dust extinction) are a faint-end slope of , a characteristic apparent magnitude of , and an overall normalization of (AS2000).333 These parameters were fit assuming the currently favored cosmology of . In §3, we presented the overall distribution of colors for the NIRC sample. A correlation with confidence (better than ) is detected between color and magnitude, such that fainter galaxies have redder colors (see Figure 4). This correlation probability was computed including the 11 upper limits in the sample of 118 galaxies with measurements, so the result should not be biased by our typical detection limit of . The trend of with is included in the luminosity function analysis by using the relationship implied by the best-fit regression slope to the correlation: . There is a lot of scatter around this regression slope, but it provides a means of encoding the trend between the two variables.
We generated a large sample (15000) of LBG apparent magnitudes between and , by randomly drawing luminosities from the LBG rest-frame UV luminosity function placed at z=2.972, the mean redshift of the current LBG spectroscopic sample. An color was then assigned to each of the magnitudes, drawn randomly from the distribution of colors for galaxies in the NIRC sample with , and then shifted by the amount, , according to the correlation between and . The fiducial distribution was restricted to because this magnitude range contained the largest number of measurements (36). Also, the measurements for were virtually all detections, rather than mixture of upper limits and detections. Combining each randomly generated pair of and measurements, we obtained an ensemble of magnitudes, which were grouped into 0.5 magnitude bins.
To determine how the photometric uncertainties of both the magnitudes and colors translated into uncertainties in the derived luminosity function, the procedure of generating an ensemble of random (, ) pairs was repeated a large number (10000) of times. In each trial, we perturbed the sample of actual (, ) measurements by random amounts consistent with the photometric uncertainties. In so doing, we assumed that the errors in and were uncorrelated, which is a valid approximation since the error in for galaxies in our sample is dominated by the photometric error. Due to the slight differences in the sample of magnitudes drawn from the LBG apparent luminosity function, and the more significant differences of the perturbed (, ) measurements, a different distribution was produced in each trial. The analytic Schechter function (1976) was fit to each perturbed distribution of -band apparent magnitudes. We restricted the fitted region to span only , reflecting the range for which we have actual measurements. The average number from all the trials was adopted for each 0.5 magnitude bin, and the adopted uncertainty was the standard deviation among the realizations (which does not include the uncertainties in the LBG -band luminosity function best-fit parameters (AS2000)).
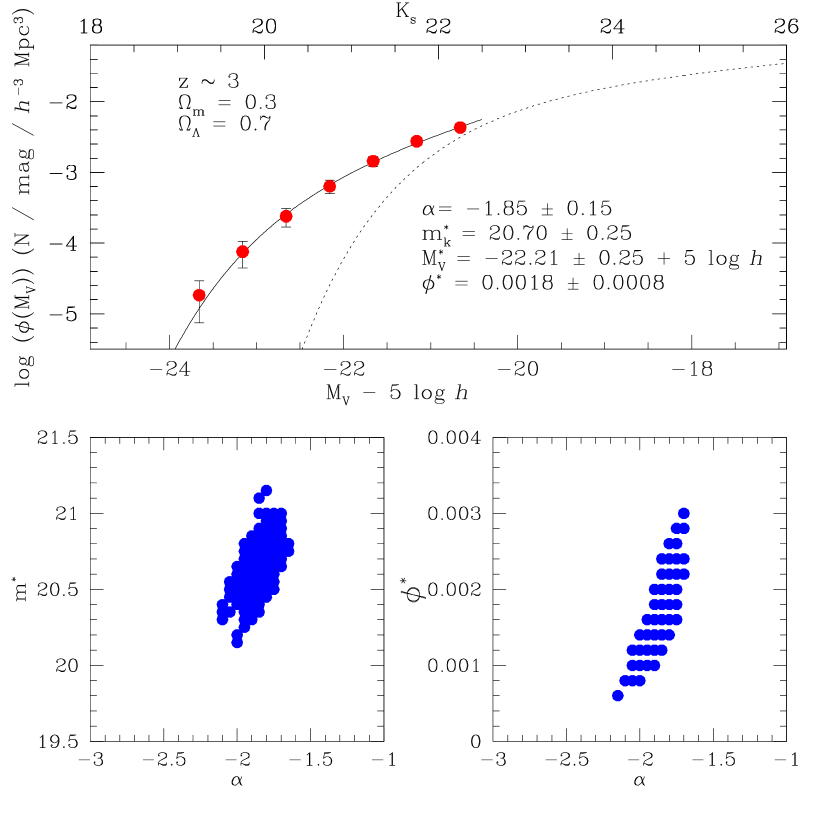
The Schechter function was then fit to the average luminosity function values. The best-fit parameters we obtain are an overall normalization of , a faint end slope of , and a characteristic apparent magnitude of . The uncertainties on the fitted parameters represent the confidence intervals generated by fitting the Schechter function to each perturbed distribution. Since it was assumed that all the galaxies comprising the luminosity function were at the mean redshift of the LBG spectroscopic sample, it is straightforward to convert the distribution of apparent magnitudes into a (i.e. rest-frame -band) absolute magnitude distribution. With our adopted cosmology, corresponds to . The overall shape of the rest-frame optical luminosity function is determined by the way in which the distribution as a function of magnitude redistributes magnitudes into magnitudes. Accordingly, the faint end slope of the LBG rest-frame optical luminosity function is steeper than that of the UV luminosity function, due to the positive correlation between and . Figure 5 shows the apparent luminosity function (and the absolute optical magnitudes to which it corresponds), as well as the confidence intervals on the best-fit Schechter luminosity function parameters. Immediately apparent from Figure 5 is the fact that the well-constrained bright end of the LBG luminosity function greatly exceeds locally determined optical luminosity functions.
To calculate the rest-frame optical co-moving luminosity density for LBGs brighter than , we integrate over the luminosity-weighted luminosity function in the appropriate magnitude range to obtain Hz. We use the -band absolute magnitude of the Sun, (Binney & Merrifield 1998), to express this quantity in solar units: . If the luminosity function were integrated to , the derived luminosity density would be more than 2 times larger than the value determined down to the typical survey detection limit of . However, such an extrapolation depends sensitively on the value of the faint end slope of the luminosity function, which is poorly constrained by our observed sample. Fukugita et al. 1998 summarize recent local determinations of the -band luminosity density, most of which are in the range . Thus, the LBG -band optical luminosity density down to only is within a factor of 2 of local measurements of the -band optical luminosity density, which were obtained by integrating over the entire -band luminosity function.
The optical luminosity function of local galaxies has been computed from numerous surveys over the past thirty years. Some recent determinations from magnitude limited redshift surveys include the Two-Degree Field Galaxy Redshift Survey (2dFGRS) luminosity function (Folkes et al. 1999), the Las Campanas Redshift Survey (LCRS) -band luminosity function (Lin et al. 1996), and the Sloan Digital Sky Survey (SDSS) luminosity functions in five optical bands (Blanton et al. 2001). These local optical luminosity functions have much shallower faint end slopes , fainter characteristic luminosities , and higher overall normalizations than the rest-frame optical luminosity function of LBGs. To demonstrate these differences, we plot the 2dFGRS luminosity function in Figure 5 along with the LBG rest-frame optical luminosity function. The best-fit parameters of the 2dFGRS luminosity function are , , and . For a direct comparison with the LBG luminosity function, which specifically probes the rest-frame band, the 2dFGRS luminosity function has been shifted 0.5 magnitudes brighter (i.e. ), reflecting the typical color of local galaxies.
At the brightest absolute magnitudes, where the LBG -band luminosity function is well-constrained by our observations, the LBG -band luminosity function greatly exceeds the local function, and has a different shape. For this reason, we caution against over-interpreting the differences in the best-fit Schechter function parameters relative to other luminosity functions; for example, the very steep faint end slope, very bright value of , and relatively low value of may well result from fitting the function over a small range of luminosity that does not actually extend as faint as the true “knee” in the luminosity distribution. In practice, it will be extremely difficult to extend this distribution to much fainter near-IR magnitudes from the ground, but it should be quite possible from space.
The obvious implication of the bright end of the -band luminosity function of LBGs is that the mass-to-light ratio of LBGs must be very different from that of galaxies in the local universe. Since the co-moving optical luminosity density in the universe is evidently as large or larger than that in the universe despite the fact that most of the stars observed in the local universe probably formed after , the band light at is apparently dominated by relatively massive stars associated with greatly enhanced current star-formation rates, and carries little information about total stellar mass. Unfortunately, this also means that no observations from the ground are likely to act as a direct proxy for stellar mass in objects that are actively forming stars at high redshift. Indeed, these observations, at m, are still dominated by the light from ongoing star-formation. In any case, the -band luminosity density of LBGs at probably exceeds that of all stars in the present-day universe.
5 THE STELLAR POPULATIONS OF LYMAN BREAK GALAXIES
Given photometry that extends from Å in the rest-frame for a reasonably large sample of LBGs, it is of interest to use the data to constrain the star-formation histories and extinction properties of the galaxies with reference to models. Because the galaxy luminosity at even the longest wavelengths observed in our sample is still dominated by stars with small mass-to-light ratios, it is impossible to constrain the integrated stellar mass of galaxies without understanding something about the star-formation history. As it turns out, our sensitivity to the star-formation history using optical and near-IR data is coarse, at best— at the corresponding rest-frame far-UV to optical wavelengths, active star-formation can easily mask the evidence for previous generations of stars (see, e.g., Papovich et al. 2001), and dust extinction has a significant effect on the emergent SED. In order to interpret the color information of the LBGs in terms of interesting constraints on physical parameters, we must rely on models of both dust extinction and the intrinsic spectral energy distributions of stellar populations as a function of metallicity, initial mass function (IMF), star-formation history, and age. There is a large range of possible parameterizations of the extinction law and the intrinsic stellar population, and in general these cannot be well-constrained independently from fits to the galaxy SEDs. Consequently, in what follows, we adopt simple models for the attenuation law, and for the metallicity, IMF, and star-formation history of the stellar population, which external observations have shown to be reasonable for star-forming galaxies in the nearby and high redshift universe. Where relevant, we point out where different assumptions yield significantly different results. Extensive grids of models have been fitted to (generally fainter) LBGs observed in the HDF-North by Papovich et al. 2001; we refer the reader to that paper for a more detailed discussion of the effects of varying the modeling assumptions.
5.1 Age-Dust Degeneracy
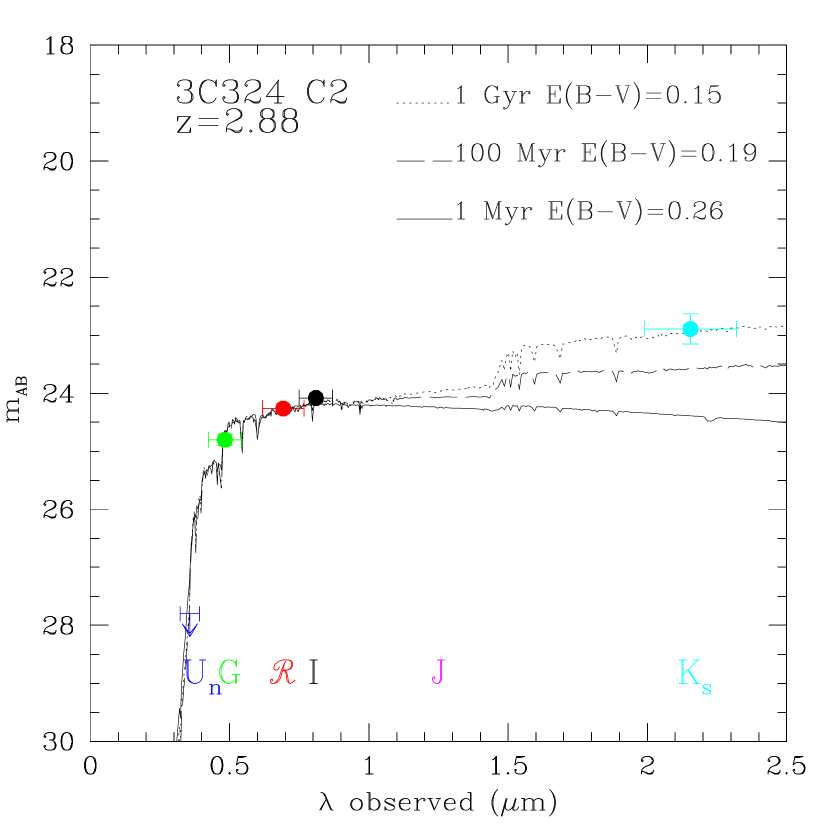
With only optical (, , , and ) photometry for galaxies, it is not possible to distinguish between a young galaxy spectral energy distribution ( Myr) which is considerably reddened by dust, and the spectral energy distribution of a galaxy which has been continuously forming stars over a much longer time scale ( Gyr), but with much less dust extinction (Sawicki & Yee 1998). Figure 6 shows the results of fitting only the color of the galaxy 3C324-C2 with Bruzual & Charlot (1996) constant star-formation galaxy spectral templates of different ages. As the template age increases, the amount of dust reddening necessary to fit the observed color decreases. Both the 1 Myr model with and the 1 Gyr model with fit the observed optical photometry equally well (where is magnitudes of extinction at rest-frame). Indeed, the model rest-frame UV slope can be modified to match the observed (, , , ) colors, by simultaneously tuning its age and dust-content. The degeneracy results from the fact that, at , commonly used optical filters probe a short-wavelength region of the rest-frame spectrum which does not contain any age-sensitive features that can be easily recognized from broad-band photometry. However, there is an age-sensitive break in the spectral energy distributions of actively star-forming galaxies that occurs near , often referred to as the “Balmer break”. The Balmer break feature, which is is age sensitive over star-formation timescales of Myr Gyr, cannot be described equally well by any combination of stellar population aging and dust-content. Longer wavelength photometry which includes the discontinuity can in principle be used to break the degeneracy between model fits.
The Balmer break feature in galaxy spectra is due to the stellar bound-free absorption coefficient, which has a sharp edge at , (the wavelength of the transition in neutral hydrogen), causing photons with wavelengths shortward of the edge to be absorbed much more efficiently than those with longer wavelengths. The prominence of this feature in a stellar spectrum depends on the temperature and gravity of the stellar atmosphere, which determines the form of hydrogen that is prevalent in the stellar atmosphere, and therefore which component of the total stellar absorption coefficient is dominant. In cooler late-type stars (such as F, G, and K), opacity dominates the total absorption coefficient, and the Balmer decrement is not very pronounced. In the early-type massive O and B stars the high temperatures result in the increased ionization of hydrogen, so again, the Balmer absorption coefficient is reduced. The Balmer break is most prominent in A-stars with temperatures around (Gray 1976).
At the onset of star-formation, a galaxy spectrum is dominated in the rest-frame UV and blue by the most-massive (O and B) stars, most of which have lifetimes shorter than 10 Myr. In a continuous star-formation model, after roughly 10 Myr, the rate at which O stars are being formed balances the rate at which they are dying, and the number of O stars levels off to a constant value (Leitherer et al. 1999). Meanwhile, the lifetimes of less massive A stars range from several hundred Myr to 1 Gyr. Therefore, as the O star population levels off, the number of A stars continues to increase. At the age where the increasing number of A stars relative to the constant number of O stars causes the galaxy spectrum at to be dominated by an A-star spectrum, we start to see an increasing Balmer break in the galaxy spectrum. After 100 Myr the magnitude difference on either side of the Balmer break in an unreddened galaxy model is 0.3 mag, and by 1 Gyr, the break has increased to a 0.6 magnitudes.
Thus, the strength of the Balmer break can be used as a rough guide to the duration of the current episode of star-formation on timescales . The details will depend on the star-formation history (e.g., whether the star-formation rate (SFR) is an increasing, or declining, function of time), the shape of the initial mass function, and the metallicity of the stellar population. Because the Balmer break even at its strongest is a relatively subtle spectral feature, and because only broad-band photometry is available for the galaxies, a measurement of the Balmer break strength requires removing the effects of continuum reddening. This requirement introduces some covariance into the simultaneous estimates of extinction and the age of the star-formation episode; we discuss this covariance extensively in §5.3.2.
5.2 Population Synthesis Modeling
5.2.1 Spectroscopic Sample
In order to examine the range of stellar population properties present in the NIRC sample of LBGs, we considered only the subsample of galaxies with measured redshifts and near-IR detections at least in . The spectroscopic sample so defined consists of 81 galaxies. We included the , , and colors of these galaxies in the modeling; the band is strongly affected by H I absorption in both the galaxy and the IGM. A substantial fraction of the spectroscopic sample also has available I band photometry, but for these high redshift objects the I band adds little information because of its proximity to and because the measurements are generally noisier than in other bands. Nevertheless, and data points (when they exist) are included in figures indicating the best-fit spectral template with respect to the observed LBG photometry,
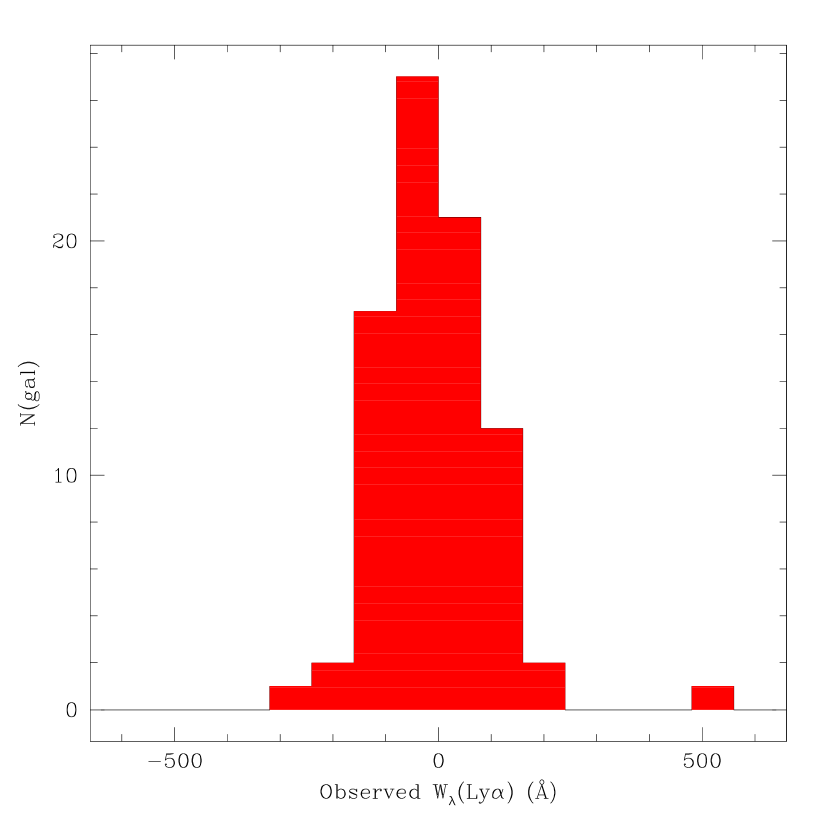
The model galaxy templates used to fit the LBG photometry include no Lyman emission, and typically contain Lyman absorption with observed equivalent widths of ( in the rest-frame). However, the sample of LBGs for which there are rest-frame UV spectra exhibit a wide range of Lyman equivalent widths, some of which are ten times larger than the model line widths, and appear in either absorption, emission, or a combination of both. The observed Lyman equivalent width was used to correct the color for line emission for each of the 81 galaxies in the spectroscopic sample. Figure 7 displays the distribution of Lyman observed equivalent widths for the LBGs with both NIRC data and Keck LRIS spectra (cf. Steidel et al. 2000).
Nebular line emission redshifted into the -band might also bias the results of population synthesis modeling. The [OIII] doublet and line all fall within the -band window for . In the NIRC LBG spectroscopic sample, 49 out of 81 galaxies () have such that at least [OIII] , the strongest of the three lines, is located within the -band. Nebular line strengths have been measured for only a small sample of LBGs at the current time (see Pettini et al. 2001), nine of which are in the NIRC sample. The combined equivalent width from all the nebular lines affecting the magnitude was calculated by comparing the line fluxes from Pettini et al. 2001 to the continuum flux, measured with NIRC. For each galaxy, the total nebular equivalent width in the filter was compared to the effective width of the filter, , to evaluate the necessary correction to the magnitude and color. In every case, the indicated corrections for nebular emission reduce the continuum flux, resulting in a bluer color. The corrections ranged from magnitudes with a median .
In order to determine the effect of these color corrections on best-fit model parameters, we fit Bruzual & Charlot (1996) constant star-formation models to the colors of the nine galaxies with measured nebular equivalent widths. Models were fit to both the uncorrected colors and the colors corrected for nebular line emission. The correction resulted in little or no change to the best-fit value (since most of the lever arm for extinction estimation comes from the rest-UV data). The effect on the best-fit age was more significant, in that the nebular line correction will result in a systematically younger inferred age. The median correction for the nebular line contamination results in stellar population ages that are 35% younger than if no corrections for line emission are applied. It should be emphasized that nebular line contamination is negligible for the 40% of the spectroscopic NIRC sample with . With such a small sub-sample having near-IR spectroscopy at the time of this writing, there is not enough information available to determine how corrections for emission line contamination should be implemented for objects without near-IR spectroscopic measurements. We have chosen, therefore, not to apply these corrections, but to emphasize that in some cases the inferred ages may be influenced by the emission line contamination of the broad-band measurements.
5.2.2 Modeling Procedure
The two main theoretical elements which we used were (1) model galaxy spectra generated with the Bruzual & Charlot 1996, (hereafter BC96) population synthesis code, and (2) a dust effective attenuation law empirically derived by Calzetti (1997) for local starbursts. 444The Calzetti attenuation law relates the observed flux, , in units of , to the intrinsic flux, , with the relation: , where is a decreasing function of wavelength, reflecting the fact that shorter wavelengths suffer more extinction than longer wavelengths. The attenuation curve is parameterized by an overall normalization, . There are few constraints on the appropriate reddening model to use for high redshift star forming galaxies, and so we have adopted the form that works quite well for local starburst galaxies, which are arguably the best local analogs of LBGs. The validity of this reddening/extinction law at high redshift has yet to be tested adequately, due to the difficulty in measuring bolometric star-formation luminosities at high redshift (see Meurer et al. 1999; AS2000). We simply use it as the most realistic representation of the attenuation in in LBGs; we will briefly discuss how the results depend on the assumed attenuation law in §3.2.
At the time this work began, the newest Bruzual and Charlot software available to us was the BC96 version, so that the results discussed in detail are based on BC96 model fits. In order to verify that the population synthesis fits did not change significantly with the most recent version of the Bruzual and Charlot package, BC2000 (Charlot 2000, private communication; Liu, Charlot, & Graham 2000), we compared the BC96 and BC2000 results for a subset of models. BC96 results were also compared with those from the Starburst99 models (Leitherer et al. 1999).
Models with both solar and sub-solar metallicity were fit to the observed colors of LBGs, but we discuss results for only solar metallicity models. Recent measurements of LBG metallicities are not very well constrained, ranging from (Pettini et al. 2001), indicating that these galaxies are more metal-rich than Damped Lyman systems at the same redshift, but have slightly lower metallicites than H II regions in the Milky Way near the Sun. Even so, we prefer to use solar metallicity stellar models, since they are the only models which have been directly calibrated against empirical stellar spectra of many spectral types. Specifically, in the grid of theoretical stellar spectra compiled by Lejeune, Buser, and Cuisinier (1996, 1997), which was used for the BC96 modeling, the only spectra which have been extensively tested against empirical stellar spectra are those with solar abundance. Papovich et al. 2001 report that the effects of using rather than solar metallicity models to fit LBG colors include best-fit ages systematically younger by a factor of 2, best-fit UV extinction factors systematically higher by a factor of 3, and derived stellar masses smaller by a factor of 2. These effects stem from the fact that the uncalibrated sub-solar metallicity models have intrinsically bluer UV continuum slopes and slightly larger Balmer breaks than solar metallicity models, for a given stellar population age. However, Leitherer et al. 2001 recently presented observations of O stars in the Large and Small Magellanic clouds with an average metallicity of , showing that metallicity does not have very drastic effects on the empirical rest-frame UV spectra of hot stars. Leitherer et al. concluded that modeling the spectra of galaxies with solar metallicity models is an approximately valid approach. Until theoretical stellar libraries are updated with empirically calibrated sub-solar metallicity models of many spectral types, we believe that solar metallicity models are preferable.
For all of the BC96 models, a Salpeter IMF extending from was assumed. Papovich et al. (2001) have investigated the effects of varying the IMF on the estimated stellar population parameters. Acceptable model fits are obtained for IMFs with various slopes and lower mass cutoffs, with slightly different results. For example, use of the steeper Scalo IMF results in younger ages, lower attenuation values, higher star-formation rates, and larger formed stellar masses. The effect of changing the IMF on the formed stellar mass is small, however, compared with the associated uncertainties. We choose not to include the form of the IMF as another parameter in our model, although clearly the shape of the IMF, if allowed to vary arbitrarily, can have a very significant effect on the stellar population parameters.555An analysis of the gravitationally-lensed LBG MS 1512-cB58 by Pettini et al. 2000 has shown that a Salpeter IMF is very successful in reproducing the details of the far-UV spectrum.
Evolutionary tracks distributed by the “Padova School” (the default for BC96) were used to describe the evolution of all the formed stars through the H-R diagram. Several different simple star-formation histories were considered: a continuous star-formation rate, ; and exponentially declining star-formation rates, , with . The set of time constants, , was chosen to span the range between the two extremes of an instantaneous burst and continuous star-formation. For each star-formation history, two parameters were allowed to vary: 1) the extinction, parameterized by , and 2) the age since the onset of the most recent episode of star-formation, .
The model dust-attenuated, rest-frame galaxy spectra were shifted to the measured redshift of the actual galaxy, and further attenuated in a manner simulating absorption by the intergalactic medium of neutral hydrogen (Madau 1995). Each internally reddened, redshifted, IGM-absorbed galaxy spectrum was then integrated through the (, , and ) filter transmission curves to calculate its predicted colors. For each combination, the predicted (, , and ) colors were compared with the observed colors using the statistic. The best-fit combination was chosen to minimize , and the intrinsic instantaneous star-formation rate was determined by normalizing the best-fit model to the observed magnitude (taking into account the best-fit extinction). By our definition, the “formed stellar mass” is simply the integral of the star-formation rate and the age of the star-formation episode obtained from the best-fit model.
Once the best-fit , , , and , were obtained for the galaxies in the spectroscopic sample, we computed the and confidence intervals associated with each parameter. For each galaxy we generated a large sample of fake “observed” colors, by perturbing the observed colors in a manner consistent with the photometric errors. We assumed the errors were Gaussian, based on the results of Monte Carlo simulations (§2.4). We also assumed that the color errors were uncorrelated, a valid assumption given that the near-IR uncertainties tend to be much larger than the uncertainty. The large sample of fits to the perturbed colors indicated the region of parameter space allowed by each galaxy’s observed colors and photometric uncertainties.
5.2.3 Comparison of Models
As described above, a range of BC96 star-formation histories was considered, and the differences between BC96, BC2000, and Starburst99 were investigated. For the purpose of this analysis, and given our relatively large photometric uncertainties, the BC96 and BC2000 model fits are virtually indistinguishable. For the solar metallicity constant star-formation models, the BC2000 model SEDs have slightly bluer rest-frame far-UV slopes and slightly larger Balmer breaks than the BC96 SEDs for a given star-formation history. Therefore, best-fit ages from BC2000 are typically % as old, while extinction values are larger (). The BC2000 best-fit extinction-corrected star-formation rates are typically larger than in the BC96 models, and so the BC2000 is typically of the BC96 . These differences are insignificant, given the large confidence intervals allowed for the best-fit and derived parameters for any given set of models.
The differences between the BC96 and the Starburst99 constant star-formation models were also explored. The Starburst99 models use stellar evolutionary tracks from the “Geneva School”, and the model atmosphere grid of Lejeune et al. 1997. For the sake of consistency, we chose solar metallicity Starburst99 templates with a Salpeter IMF, which we re-normalized by roughly a factor of in luminosity, to remove the effects of the larger minimum mass cutoff in the Starburst99 Salpeter IMF . As in the case of BC2000, the Starburst99 best-fit and parameters tended towards younger ages (% of the BC96 ), and slightly larger values of , (). The higher values in the Starburst99 fits lead to extinction-corrected values which are larger than the BC96 values on average, and therefore the values for the Starburst99 models were typically of the BC96 values. The differences between the BC96 and Starburst99 and parameters are also small compared with the allowed confidence intervals.
For all three sets of models: BC96, BC2000, and Starburst99, the relative ordering of and is preserved— galaxies best described by higher [] galaxies in the BC96 models also have higher [] according to the Starburst99 and BC2000 models. Finally, we note that for each galaxy in our sample, the BC96, BC2000, and Starburst99 constant star-formation models all provide statistically indistinguishable fits— i.e. there are no cases where one set of models has significantly lower values than the others. Evidently, even for identical star-formation histories, there are significant differences in the predictions of each of the models that can amount to a factor of 2 in inferred age and a factor somewhat less than 2 in formed stellar mass. Thus, it would be a mistake to take the results from any of the models as anything but approximate until both the models and the data improve.
The model results for different BC96 star-formation histories were also compared in detail. We did not consider a very large number of star-formation histories, but enough to bracket a range of star-formation decay time parameter space. For the majority of the galaxies successfully modeled, all of the star-formation histories considered yielded best-fit models with values allowed at the level. For 8 of the galaxies we were able to rule out the models with time constants smaller than Myr— this sub-sample is comprised of galaxies which are simultaneously blue in and red in , and which have among the largest inferred continuous star-formation ages.
For the rest of the galaxies, whose star-formation histories cannot be usefully constrained, the best-fit and, especially, , parameters demonstrate quite a large spread depending on which star-formation history is chosen to fit the photometry. In contrast, the formed stellar mass, , derived from such best-fit parameters is a more robust quantity (cf. Papovich et al. 2001). We investigated the implied by each best-fit combination as a function of star-formation history, and find that for the and models, the derived is typically within a factor of 2 of the derived for the constant star-formation model. For the models (these are effectively equivalent to an “instantaneous burst” model), the derived is typically a factor of four smaller than the constant star-formation prediction— this relatively large difference is caused mostly by the degeneracy between an aging starburst and one which is relatively strongly reddened by dust. Star-formation histories with star-formation rates that are increasing functions of time pose even more significant problems for the models; for example, Papovich et al. (2001) have shown that an underlying maximally old stellar population (hidden by the most recent episode of star-formation) can contain up to the stellar mass derived from the rest-frame UV-to-optical SED. In this sense, as emphasized by Papovich et al. , the inferred based on the modeling should be treated as lower limits on the total stellar mass of the galaxies.
In short, broad-band photometry is not particularly effective in constraining star-formation histories— the root cause of this problem is that the far-UV flux is determined solely by the instantaneous rate of O and B star-formation, whereas the rest-frame optical flux is dominated by previous star-formation if the SFR is declining, and by the instantaneous star-formation if the rate is increasing. There is of course no good a priori reason to favor declining star formation rates over increasing ones. The simplest assumption is that the observed instantaneous star-formation rate is representative of the rate since the onset of the current episode of star-formation. Under these simplifying assumptions, short-lived “bursts” of star-formation for which the SFRs are much higher than the past average, will appear “young”, and protracted periods of star-formation with relatively constant SFRs on timescales Myr will have significant Balmer breaks that can be recognized in the broad-band photometry.
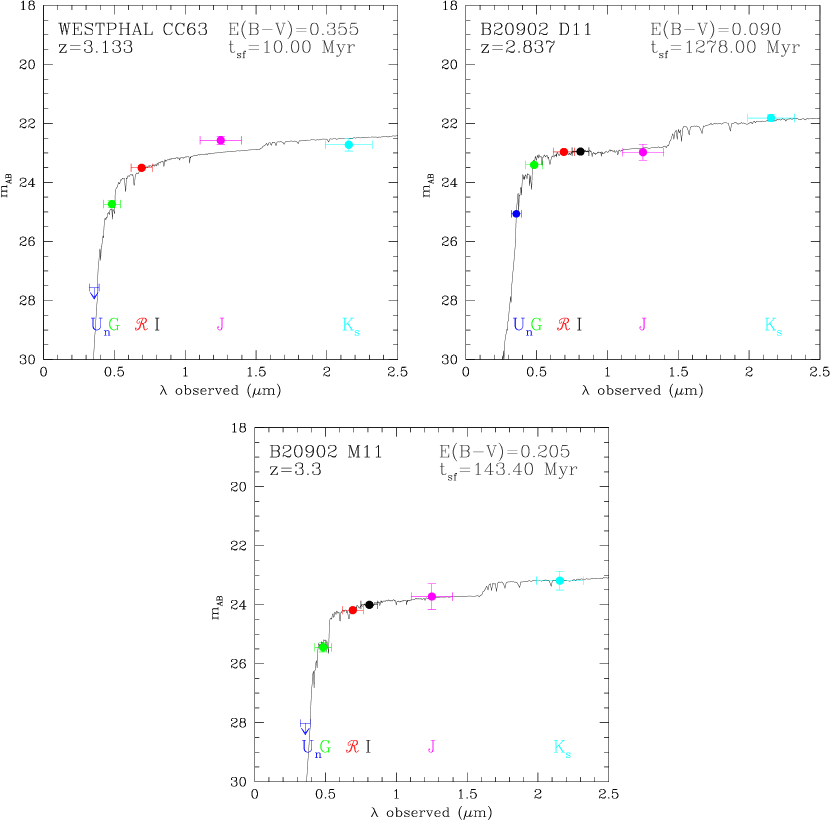
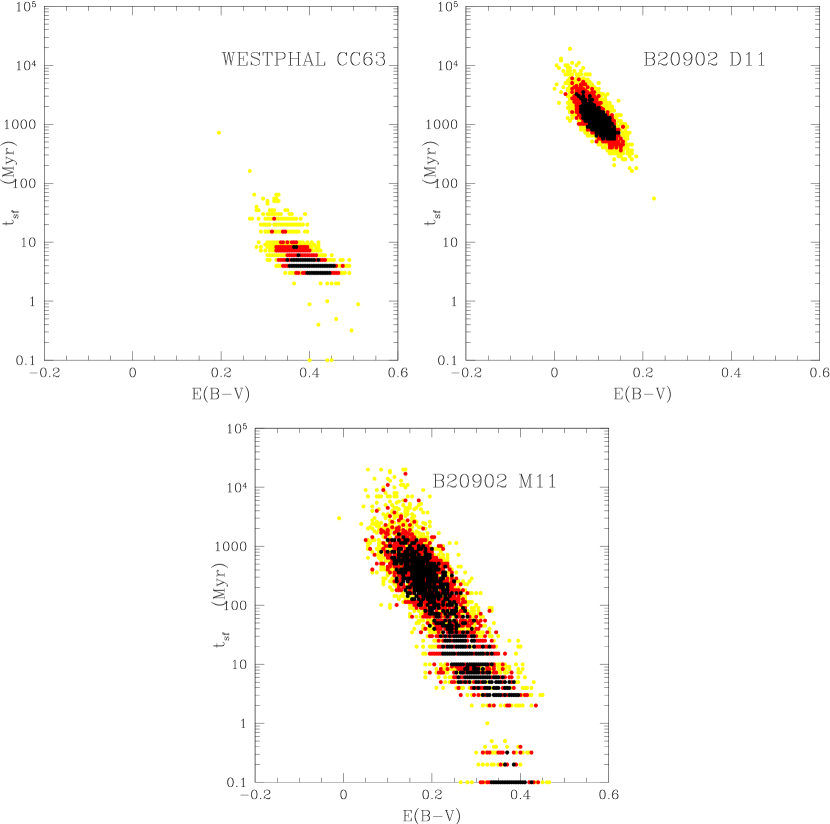
We summarize the best-fit and derived parameters for each galaxy assuming the BC96 constant star-formation models in Table 4. In Figure 8a, the measured photometry for three NIRC LBGs is plotted along with the best-fit constant star-formation models for the galaxies. These examples demonstrate the range of stellar population parameter space which is probed with NIRC LBGs. Figure 8b shows the confidence regions for these three galaxies.
5.2.4 Anomalous Galaxies
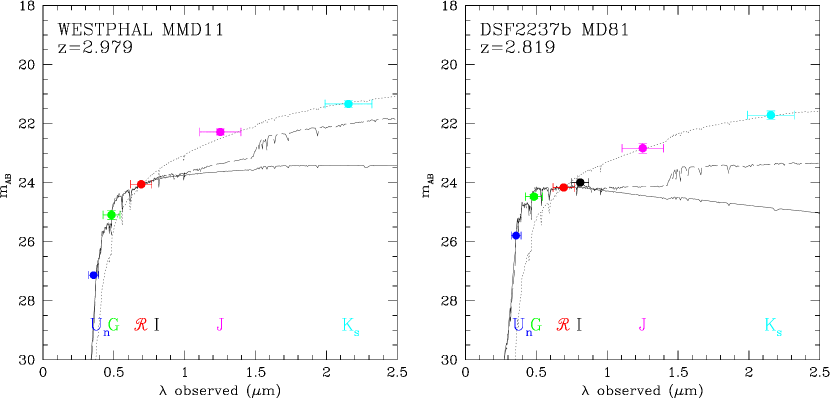
Most of the NIRC LBG spectroscopic sample was adequately described by the simple models detailed above. Statistically acceptable fits were obtained for 74 of the 81 LBGs in the NIRC sample with redshifts. Three of the remaining seven galaxies have suspect and photometry upon closer inspection,666 the “suspect” photometry was obtained during variable observing conditions. an attempt was made to flux calibrate these measurements, but the optical-IR SED’s for the relevant galaxies still indicate anomalous near-IR photometric points. and fourth galaxy has a clear Seyfert-2-like spectrum. The remaining galaxies have colors that defy the simple models considered above. Two of the most anomalous galaxies are Westphal-MMD11 and DSF2237b-MD81. MMD11 and MD81 are the two reddest galaxies in and in the entire NIRC LBG sample, with colors of 4.54 and 4.27, respectively, and colors of 2.67 and 2.23. MMD11 is also in the reddest quartile of IGM-absorption corrected measurements for the sample, while MD81 is in the bluest quartile (see Figure 1b). Neither MMD11 nor MD81 has a LRIS rest-frame UV spectrum with anomalously strong Lyman emission or absorption, or notable interstellar or stellar features (though the signal-to-noise ratio in these spectra does not enable a quantitative examination). As discussed by AS2000, at (Chapman et al. 2000), the flux of MMD11 is the strongest detection from the sample of optically selected LBGs that have been observed with SCUBA. Furthermore, MMD11 has a complex [OIII] 5007 nebular line profile, extended into two components along the spatial direction. While there is substructure present, the [OIII] equivalent width is one of the smallest which has been measured in LBGs (Pettini et al. 2001), and could not have contaminated the colors by any significant amount. MD81 is not detected at 850m at the mJy level (Chapman et al. , in preparation), and has not been studied with near-IR spectroscopy.
When we attempt to fit simultaneously the , , and colors for either MMD11 or MD81, we are unsuccessful, mainly due to the extremely red optical-IR colors. Since MMD11 and MD81 are so bright in the near-IR, their well-determined colors have more power to discriminate the quality of a model fit than the more poorly determined optical-IR photometry for the majority of the NIRC sample. However, even if MMD11 and MD81 had and uncertainties which were more typical of the NIRC LBG sample, no satisfactory model fits would be obtained for MD81, and only marginally acceptable fits would be obtained for MMD11. Figure 9 shows various attempts to fit the colors of these anomalous galaxies. Estimates of dust reddening are obtained from fitting only the color, assuming BC96 constant star-formation, and ages of 1 Myr and 1 Gyr. Clearly, the and points for both galaxies are significantly brighter than the predictions for even the 1 Gyr model. While a model with an age older than 1 Gyr might be able to fit the points, the Balmer break present between and in such an old template spectrum would not be consistent with the well-determined, and bright, measurements. For most of the galaxies in the NIRC LBG sample, this is not the case— even when fitting the color alone, it is easy to find a model with the appropriate age and dust extinction to describe all of the photometry within the errors.
If we neglect the color, and fit and alone, the best-fit models predict more than 7 magnitudes of extinction in the rest-frame UV and would significantly under-predict the rest-frame far-UV fluxes. The very red optical-IR colors of these galaxies may indicate a problem with the Calzetti extinction law in cases where dust extinction is very extreme. In these cases, as in the case of local ultra-luminous infrared galaxies (ULIRGs), the details of the geometry and distribution of the dust relative to where star-formation is occurring become more important and the simple recipe for extinction breaks down (Trentham, Kormendy, and Sanders 1999; Meurer and Seibert 2001). For example, based on the color alone, we would infer a moderate to low amount of dust extinction in MD81 (which may still be true). But such a small amount of extinction, with any age or star-formation history considered in this work, cannot account for the very red and colors of MD81. Alternatively, the inability to model these unusual galaxies might be due to the over-simplified nature of the star-formation histories considered.
5.3 Model Results
Using the sample of 74 galaxies for which acceptable BC96 continuous star-formation fits were obtained, we explore the trends present among observed and modeled quantities. These galaxies, all of which have redshifts, are brighter by an average of magnitudes in than the NIRC LBG sample as a whole, and brighter by mag than the larger optical LBG photometric sample. It should be emphasized that the sample of HDF-N LBGs recently analyzed by Papovich et al. (2001) includes only four (of 33) galaxies brighter than in the rest-frame UV LBG luminosity function, whereas % of the galaxies in the sample analyzed here are brighter than . Differences between the two samples might then be ascribed to UV-luminosity-dependent effects, although we see only subtle trends with UV luminosity within our full ground-based sample spanning a factor of in UV luminosity.
Steidel et al. 1999 and AS2000 have computed the distribution of LBG values based on IGM-absorption-corrected colors alone, assuming a fixed intrinsic stellar population that corresponds to a BC96 continuous star-formation model with . With the addition of near-IR data, we have been able to model the extinction and variations in the stellar populations simultaneously. The inferred distribution of reddening, assuming the starburst attenuation relation of Calzetti (1997) and a suite of BC96 continuous star-formation models, has a median , corresponding to magnitudes, similar to the median extinction presented in the earlier works. This reflects the fact that the previously-assumed galaxy SED is a reasonable approximation for the bulk of the sample in the rest-frame UV, and that most of the information on reddening comes from the far-UV data points even for a relatively “gray” extinction law.
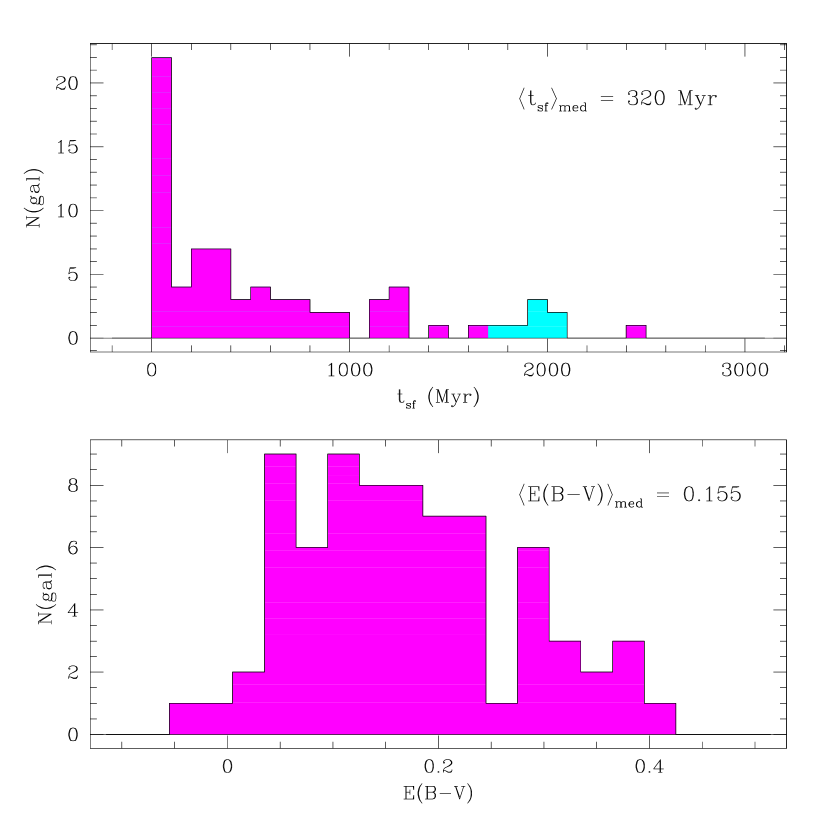
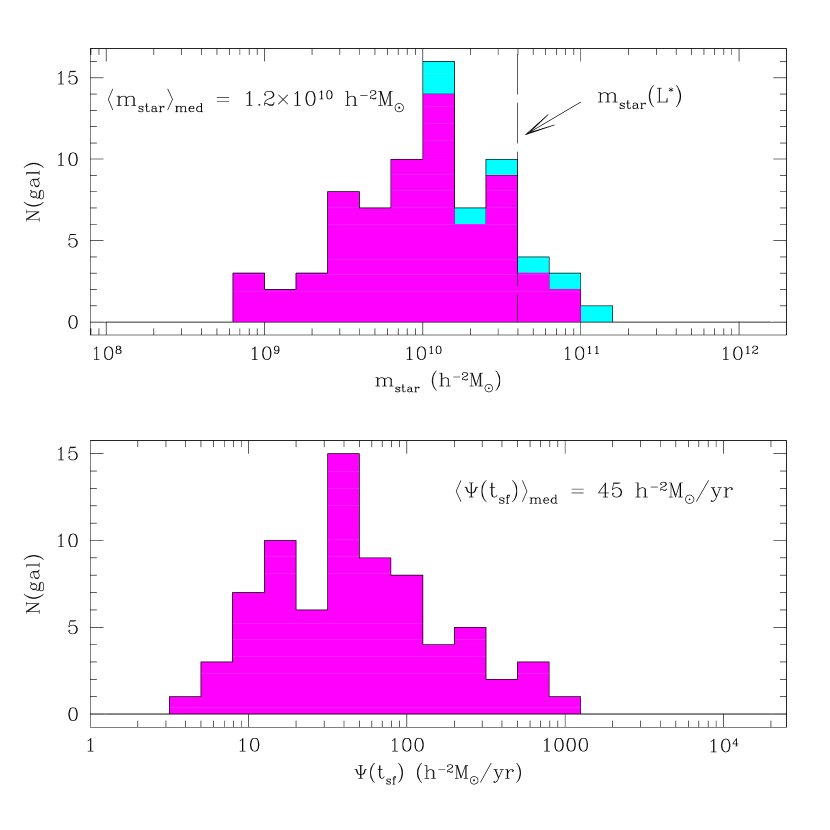
The median age for our sample is . More than of the galaxies have , while have . There were nine galaxies with formal best-fit values smaller than . Such small ages are not physically plausible for episodes of star-formation, given the dynamical timescales of the star-forming regions (see §7). Furthermore, the conversion between extinction-corrected UV luminosity and star-formation rate becomes highly non-linear at ages shorter than . On these grounds, we restricted the best-fit constant-star-formation parameter space to ages of at least , which still provides acceptable fits for the nine youngest galaxies. We also applied the constraint that best-fit values could not be older than the age of the universe at (assuming an , , cosmology), which affected the fits for seven galaxies whose formal best-fit values were then too old. These galaxies, however, all had colors which were statistically consistent with being younger than the age of the universe at . As discussed in §5.2.3, the values for the NIRC LBG sample are affected in a systematic way by varying the star-formation history or the population synthesis models, but the sample as a whole should broadly represent the significant range in these parameters spanned by the LBGs at . We have noted that the distribution of values does not reflect corrections to the color for nebular line emission for the of the galaxies in the NIRC LBG sample which are at high enough redshift that the measurement could be affected. However, there is no apparent systematic offset towards higher values for the higher-redshift portion of the sample as might be expected if the higher redshift objects were significantly biased due to nebular line contamination. Histograms of best-fit and are shown in Figure 10a.
The median derived star-formation rate for the sample is , and the distribution of values is quite broad, ranging from to as high as . Multiplying the best-fit and yields a distribution of , with a median of , smaller but comparable to the present-day stellar mass, (Cole et al. 2000; Papovich et al. 2001). However, we find that about of the sample have smaller than (roughly the same sample with best-fit ). Histograms of the inferred and distributions are shown in Figure 10b.
As mentioned above, a similar modeling technique for extracting physical parameters from observed colors of LBGs was used in recent work by Papovich et al. (2001); their sample of 33 galaxies in the HDF-N is a superset of earlier work by Sawicki & Yee (1998) on 17 HDF-N galaxies. The Papovich et al. HDF study, while containing all of the Sawicki & Yee galaxies, finds somewhat different results from Sawicki & Yee, including lower typical extinction factors, older ages, and larger formed stellar masses. The authors attribute some of these differences to their higher-quality HST NICMOS and data (compared to the Sawicki & Yee ground-based and ), more accurate matching of optical and infrared photometry to compute colors, and larger galaxy sample. Here and above we have focused primarily on the more recent HDF-N analysis of Papovich et al. (2001).
The main difference between our modeling procedure and that of Papovich et al. is that the latter work allowed , the exponential star-formation decay time constant, to vary as a free parameter in fitting the models. As discussed above, there were few cases in which our data could discriminate between different values of that were significant compared to the inferred value of . However, a direct comparison of the model results is possible for 19 of the 33 galaxies in the Papovich et al. work because the best-fit values are either longer than or much shorter than the inferred , so that the star-formation history is essentially indistinguishable from a constant star-formation model. For these 19 HDF-N galaxies, the median inferred age is , and the median . The median is thus higher, while similar, to the NIRC LBG median , and the median is slightly smaller than that of the NIRC LBG sample. The remaining 14 HDF-N galaxies have best-fit , and values which are systematically lower than the sample. However, the values for these galaxies are not very well constrained, and larger values also provide acceptable fits. The older values resulting from larger parameters would be roughly consistent with the values for the other 19 galaxies. Thus, given the uncertainties, it is probably fair to compare broadly the whole Papovich et al. sample to the NIRC-LBG sample. Our results are consistent with the inferred parameters for the small subset of the brightest HDF galaxies, including two galaxies in common between the two samples (see Table 3). Generally speaking, the UV-brighter NIRC LBG sample has a higher proportion of objects with large inferred extinction and with large values of the inferred stellar mass (these are generally distinct sets of objects, as discussed further below), both of which may be due to the different range of UV luminosity spanned within the two samples.
5.3.1 Extinction and Luminosity
Using observed optical and far-infrared (FIR) data, AS2000 and Meurer et al. (1999) demonstrated that at both low and high redshifts, there appears to be a correlation between dust-obscuration and bolometric luminosity (). The results of our modeling of the LBG SEDs support the assertion that more heavily obscured galaxies have larger bolometric luminosities; however, because many of our assumptions are similar— most notably, the adopted starburst attenuation relation, our new results cannot be taken as independent evidence. As in AS2000, we find that the rest-frame UV luminosity is uncorrelated with the inferred value of , so that applying the inferred extinction correction naturally results in a strong correlation between bolometric luminosity and extinction. As emphasized by AS2000, inferences about extinction in the high redshift galaxies are very difficult to test observationally, but the trends are very similar to what is observed for star-forming galaxies in the local universe and, so far, the starburst attenuation relation is consistent with available cross-checks at high redshift. We note in passing that internally consistent application of the inferred extinction corrections to the rest-frame optical luminosities results in a similar correlation of dust obscuration and optical luminosity, and a net correction to the -band luminosity density of a factor of compared to the uncorrected numbers presented in §4. The correlations of the UV and optical luminosities with best-fit are shown in Figure 11 for BC96 continuous star-formation models. These correlations hold for the all of the star-formation histories used in this work to model the galaxy colors, and would hold for any assumed extinction relation that is correlated with rest-UV color.
5.3.2 Extinction and Age
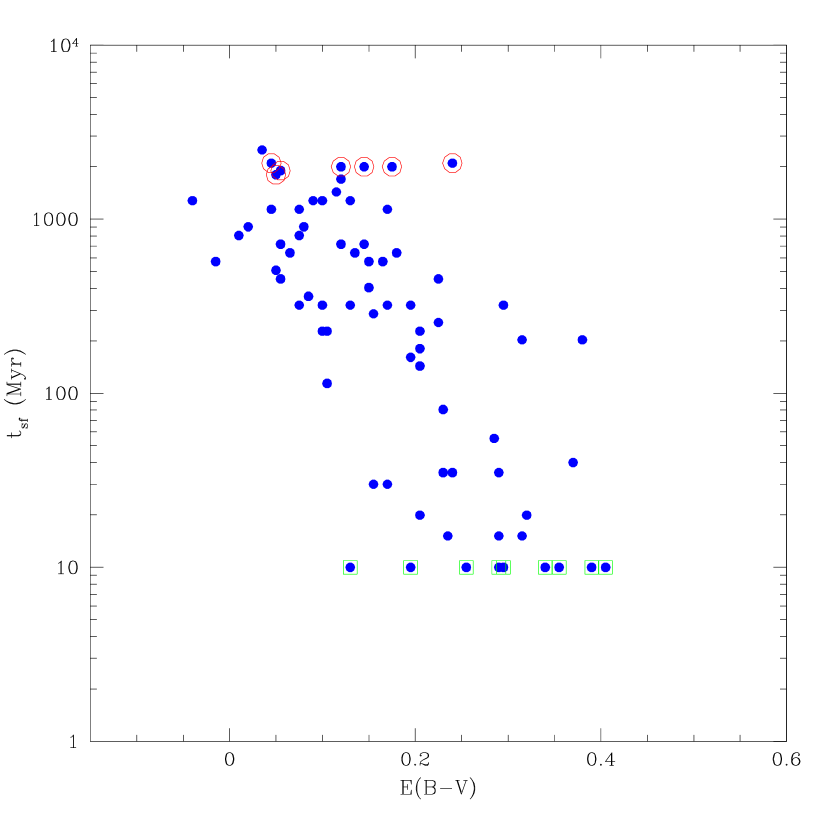
In Figure 12 we plot the best-fit and parameters for the 74 galaxies successfully fit with BC96 constant-star-formation models. There is a very strong anti-correlation between and in the sense that younger galaxies are more heavily extinguished than older galaxies. Given the strong correlation between and discussed in §5.3.1, the relationship between extinction and age translates into a link between age and star-formation rate, where the youngest galaxies also have the highest star-formation rates. The correlation in the sample between and falls roughly in the same direction as the observed covariance of the () parameters for each individual galaxy. The covariance of and is dominated in most cases by response of the fitted parameters to perturbations in the color. Typically, a positive perturbation to the results in a positive perturbation to the best-fit and a negative perturbation to the best-fit , the latter due to the effect of the extinction estimate on the predicted color for a given . The covariance of the two parameters is clearly demonstrated by the NIRC LBG confidence regions shown in Figure 8b.
Given the strong covariance between best-fit and parameters inherent in the modeling procedure, further tests are necessary to evaluate whether the trend of increasing extinction with decreasing is significant. In other words, does the apparent correlation arise solely due to objects’ covariant confidence regions in space, because measurement errors can scatter intrinsically uncorrelated points along the same direction as an correlation? In order to test the strength of such an apparent correlation, we constructed a sample of 74 uncorrelated and pairs (to match the size of the observed sample of 74 galaxies). This sample was generated by randomly selecting and values independently from the intrinsic marginal distributions of each of the parameters. These intrinsic marginal distributions were estimated by assuming that the observed marginal distributions (shown in Figure 10a) represented the intrinsic marginal distributions broadened by photometric measurement errors. In addition to and , apparent magnitude and were randomly selected from the observed distributions of and for NIRC LBGs, in order to compute the colors that would be observed from a galaxy with the randomly selected and parameters. A fake galaxy was retained only if its and parameters implied a color satisfying the LBG selection criterion of , and a magnitude brighter than the typical NIRC LBG detection limit of . Photometric uncertainties were assigned to each fake galaxy’s predicted set of colors, based on the galaxy’s magnitude and colors, and the previously determined functions of , , and (see §2.4).
The sample of fake galaxies was then “observed” a large number (1000) of times. Each time, the colors of the fake galaxies were perturbed in a manner consistent with their photometric errors (a process similar to the one used to construct the confidence intervals for the 74 real observed galaxies). The result of observing the fake galaxies numerous times with measurement errors was a large distribution of best-fit and values (the number of fake galaxies (74) multiplied by the number of trials (1000)). The marginal distributions of and for this large simulated distribution matched the observed marginal distributions of and in Figure 10a — which verifies that our estimate of the intrinsic marginal distribution was reasonable. We then randomly selected a large number of groups of 74 best-fit pairs from the sample of 74,000 “observed” galaxies, and computed the correlation coefficient between and for each randomly selected sample. In 1000 random samples of 74 fake best-fit values, no sample had a correlation coefficient as strong as the one seen in the real sample. Thus, it appears that the age/extinction correlation for NIRC LBGs has less than a chance of being the result of correlated measurement errors alone.
A related question is whether the detection limits and selection criteria for the sample could have created an apparent dearth of young, unreddened galaxies, and old, dusty galaxies, which would mimic a real correlation between and . For the redshift range of the sample, the BC96 constant star-formation models with and have within the range for LBGs (), but also very blue colors (). A detection limit in translates into a limit in as a function of . However, since there are limits rather than detections for only out of galaxies with redshifts in the NIRC sample, we conclude that our detection limit has not prevented us from detecting a significant population of young, unreddened galaxies. At any redshift in the NIRC sample, old and reddened galaxies, with and , have predicted , which means that all such galaxies with , should be detected in . At the median redshift of the NIRC sample, the LBG selection limit of implies that we should be able to detect old galaxies with , which is more than one standard deviation to the red of the mean of the sample. At increasing redshift, the upper limit on decreases until at the highest redshift in the NIRC sample, , it is only possible to select a 1 Gyr model with as a LBG, based on . Such a redshift dependent effect discriminates against old and very dusty objects at the high redshift end of the LBG redshift selection function. To test the significance of such an effect, the sample of 74 galaxies was divided into low and high redshift subsamples, using the median redshift as a discriminator. All of the galaxies in the low redshift sample have , at which redshift a stellar population could be detected with . Despite the fact that is barely restricted for the low redshift sample, a strong correlation between and is recovered from this sample, as well as from the high redshift and total samples. We conclude that the redshift-dependent bias against detecting old and dusty galaxies cannot account for the strong correlation found between and in the NIRC sample either.
The inferred strong correlation between star-formation age and extinction does depend on the details of the attenuation law applied to correct observed galaxy colors and magnitudes to their intrinsic, unobscured values. At low redshift, relatively “gray” starburst galaxy attenuation relations such as that of Calzetti (1997) provide a much better predictor of bolometric luminosity from far-UV observations than the reddening curves derived from observations of single stars, such as the SMC, LMC, and Galactic reddening curves (Meurer et al. 1999). There are very few observations to constrain the nature of dust extinction in galaxies at high redshift; however, the limited information which exists favors the starburst attenuation relation over a much steeper curve such as the SMC law (Meurer et al. 1999, AS2000). Nevertheless, if the SMC law is used with the BC96 constant star-formation models, instead of the Calzetti relation, the best-fit extinction values at 1600 Å are systematically smaller, by a median factor of 2.7, and the values are systematically larger. The ratio between SMC and Calzetti values increases as a function of increasing extinction, but the median ratio is 3.7. Qualitatively, the larger SMC values result from interpreting a larger fraction of the color as due to the Balmer break (aging stellar population), and a smaller fraction as due to the effects of dust extinction.777In fact, the inverse effects on extinction and age from using an SMC law tend to cancel out in the calculation of formed stellar mass, which is typically only larger when using the SMC rather than Calzetti law. The result of using the SMC law is that the correlation between inferred extinction and inferred age is very much diminished.
5.3.3 Stellar Mass
The formed stellar mass, , for the constant star-formation models is simply the product of the best-fit and . Figure 13 shows the relationship between and observed and intrinsic (extinction-corrected) luminosity values. When the sample is restricted to galaxies with best-fit (the median for NIRC LBGs), there are significant correlations between both UV and optical extinction-corrected luminosities and . However, when the whole NIRC LBG sample is considered, the extinction-corrected UV and optical luminosities are only weakly correlated with , indicating that, for the wide range of extinction and age parameters found in the NIRC LBG sample, even rest-frame optical luminosities (the longest accessible wavelengths for galaxies until the Space Infrared Telescope Facility (SIRTF) flies) often have more to do with current star-formation rates than with formed stellar masses. Thus, as emphasized by Papovich et al. (2001), the estimates of the formed stellar mass associated with the most recent star-formation episode must rely on the IMF-dependent population synthesis modeling until longer wavelength observations are possible. However, Papovich et al. also explored the dependence of inferred on the modeling assumptions for a given observed galaxy SED, concluding that, while variation of the modeling parameters yields highly variable results for parameters such as age and extinction, the combination of best-fit pairs of these parameters generally results in much more tightly constrained estimates for the modeled star formation episode. While exploring a smaller volume of parameter space, we confirm this trend for the formed stellar mass values (cf. §5.2.3).
Our results should be compared directly with the solar metallicity, Salpeter IMF models of Papovich et al. (2001) (their Figure 17), where the characteristic formed stellar mass is a few M⊙ for objects with UV luminosities of in the far-UV luminosity function of Steidel et al. (1999). Our NIRC sample, which has a median luminosity of somewhat brighter than , has a median inferred stellar mass of M⊙ using the cosmology adopted by Papovich et al. al. Thus, in the small region of overlap, the ground-based sample yields results similar to the brightest HDF-N galaxies. In contrast to Papovich et al. , who found that the UV luminosity was well correlated with the inferred stellar mass, we find that the UV luminosity is uncorrelated with the inferred . This may reflect a real difference between the brighter and fainter samples. One possible explanation could be that we see a wider range of extinction among the NIRC LBGs than is found at fainter UV luminosities (e.g., objects of a given UV luminosity can be either heavily extinguished very luminous objects, or modestly extinguished, much less luminous objects) such that the relationship between UV luminosities uncorrected and corrected for extinction is much less tight (see AS2000). Because of the very small overlap in UV luminosity between the two samples, the differences are at present statistically insignificant.
There are 9 objects888One is Westphal MMD11, which we were unable to model successfully, and so it has not been included in this discussion. from the NIRC sample which also have nebular line width measurements from near-IR spectroscopy (Pettini et al. 2001). We use the nebular line widths and the measured near-IR half-light radii to compute the dynamical mass enclosed within the half-light radius. The mass inferred from the nebular line widths is probably not indicative of the total mass in the dark-matter halo containing the LBG, but is likely to represent a lower limit (see Pettini et al. 2001). Similarly, since the inferred stellar mass estimates are only sensitive to the most recent episode of star-formation, they should also represent lower limits on the total stellar mass present. However, the near-infrared spectroscopic and photometric measurements generally span the same physical region, which contains not only stellar mass, but also gas and dark matter. The spectroscopic line widths should be sensitive to all this matter, while the photometry only probes the luminous stellar matter. Therefore, the mass inferred from the nebular line widths should represent a rough upper limit to the values derived from the BC96 model fits. We would suspect a problem in the population synthesis modeling technique if the derived values were much larger and statistically discrepant with the inferred dynamical masses. As shown in Figure 14, for the majority of the galaxies, the value is consistent with the inferred dynamical mass; in two cases where it is not, the best-fit stellar mass is significantly smaller than the inferred dynamical mass. We refrain from drawing conclusions from Figure 14, given the very large uncertainties in both mass estimates, but there is no evidence that the two mass scales are wildly inconsistent with one another.
6 “Young” and “Old” LBGs: Spectral Differences
One of the more striking results from the modeling of LBG stellar populations is the strong correlation between extinction and age, such that the galaxies best fit by younger stellar populations are also best described by larger amounts of extinction and reddening. As discussed in §5.3.2, we believe that this correlation is significant, despite the tendency for the individual () covariance intervals to lie in a similar direction to the observed sample correlation, and despite a selection criterion which prevents a galaxy older than with significant amounts of dust extinction from being classified as a LBG at the highest redshifts in the sample. Assuming that the correlation is real, there are implications for interpreting the range of LBG best-fit stellar populations and extinction parameters. It appears that the distributions of LBG star-formation ages, extinction, and inferred stellar masses fall along a continuum in the parameter space, the extremes of which might be viewed as separate “populations”. To illustrate this point, we isolate 16 galaxies with best-fit , and 16 galaxies with . In the discussion which follows, the Gyr subsample is referred to as the “old” sample, and the subsample is labeled “young.” The “young” sample has , , and . In contrast, the “old” sample has , , and . The young sample is characterized by 2 magnitudes more dust extinction in the rest-frame UV than the old sample, star-formation rates at least an order of magnitude higher (even when restricting the best-fit values to be above a reasonable minimum age), and formed stellar masses more than an order of magnitude smaller.
To investigate further the distinctions between galaxies in the young, dusty subsample and those in the older, less reddened group, we drew from our database of LBG rest-frame far-UV spectra, collected by our group between October 1995 and November 1999 (Steidel et al. 1996a,b, 1998, 1999). By combining individual rest-frame UV spectra of galaxies in the “young” and “old” subsamples described above, we constructed “young” and “old” composite spectra following a method similar to that described in Steidel, Pettini, & Adelberger (2001).
The young and old composite spectra are plotted in Figure 15, and Figure 16 shows an expanded view of four specific regions of the spectra for more detailed comparison. There are several clear differences to note, the most dramatic of which is in the relative Lyman line profiles. The old spectrum has strong Lyman emission with rest-frame , whereas the young spectrum has a broad absorption trough plus much weaker emission which combine to give roughly . The radiative transfer of Lyman photons in galaxies is a complex process which depends not only on the amount of dust present in the ISM but also, and perhaps more importantly, on the geometry and kinematics of the neutral interstellar hydrogen gas (Charlot & Fall, 1993; Chen & Neufeld 1994; Kunth et al. 1999; Tenorio-Tagle et al. 1999). However, due to resonant scattering, Lyman photons will on average traverse a much longer path before escaping the galaxy than nearby continuum photons, so that they are more prone to absorption by dust in the ISM. Therefore, the amount of dust present in the ISM should have a non-negligible effect on the emergent Lyman profile. The fact that the composite “young” spectrum exhibits a Lyman profile with a combination of absorption and only weak emission, while the composite “old” spectrum has very strong Lyman emission, offers independent support for a scenario in which the youngest galaxies have significantly dustier interstellar media than more mature LBGs.
Additionally, the young spectrum has much stronger Lyman absorption, stronger low-ionization interstellar metal absorption lines of Si II , C II , Fe II , and a stronger P-Cygni C IV profile. The only interstellar metal absorption line which is stronger in the old spectrum is Al II . While the S/N ratios of the composite spectra represent large improvements over that of the individual spectra, the significance of the differences in line strengths between the old and young spectra is still difficult to quantify, given the noise in the composite spectra and the relatively small sample of objects whose spectra were combined. We therefore choose to make more qualitative observations. The low-ionization interstellar absorption lines are probably optically thick, and therefore on the flat part of the curve of growth, where equivalent width is determined mainly by velocity width, and not column density (Steidel et al. 1996a, Gonzalez Delgado et al. 1998, Heckman & Leitherer 1997). Accordingly, the stronger interstellar absorption lines in the young spectrum may indicate interstellar medium velocity widths larger than those in the old spectrum. Larger velocity widths are consistent with a scenario in which a higher supernova rate (based on the higher ) deposits larger amounts of mechanical energy into the ISM, accelerating the interstellar gas to higher velocities.
7 A Proposed Evolutionary Sequence for LBGs
A picture begins to emerge from the range of stellar populations observed in the NIRC LBG sample. At one extreme of the continuum, there is a group of galaxies with best-fit ages younger than or equal to the dynamical timescale associated with the luminous portions of LBGs. Based on NIRC and HST-WFPC2 observations, the typical LBG angular half-light radius is (Giavalisco et al. 1996; Pettini et al. 1998). This angular size translates into kpc at . Furthermore, from near-IR spectroscopic measurements of a sample of 15 LBGs, the typical nebular line widths are km s-1(Pettini et al. 2001). The associated dynamical timescale is . With typical values for and , this calculation yields Myr. A starburst cannot occur on timescales shorter than the dynamical timescale of the region experiencing star-formation, for reasons of causality. Since a constant star-formation model with an age less than or equal to the dynamical timescale is indistinguishable from a bursting mode with a decay time, , limited to be greater than or equal to the dynamical timescale, the young, dusty galaxies in the NIRC LBG sample might well be described as galaxies undergoing bursts of star-formation. Whatever the cause of the burst of star-formation, we see intense star-formation and enhanced dust extinction in the youngest galaxies. At the other extreme are the galaxies whose best-fit constant star-formation values are close to a Hubble time at , whose dust extinction is only moderate, and whose star-formation rates are more quiescent. The NIRC LBG sample also contains galaxies with ages, dust-extinction, and star-formation rates which are intermediate between these two extremes.
Since the range of NIRC LBG stellar populations is controlled by two strong correlations— one between dust and age, and another between dust and intrinsic star-formation rate— we use these correlations to construct a unified evolutionary model for LBGs at high redshift. According to this model, the “young” and “old” samples discussed in this section constitute different evolutionary stages of the same population, which are both selected as LBGs. The “young” galaxies represent objects in the first stage, where the star-formation rate is very active (), large amounts of dust obscure the sites of star-formation, and a stellar mass on the order of is formed in a dynamical timescale. As time passes, dust is either destroyed or blown out, (or both), resulting in lower extinction, and the star-formation rate decays on a Myr timescale to reach the more quiescent rates seen in the “old” sample (). The “old” sample then represents the most advanced stage of the evolution which we observe in LBGs, by which stage a stellar mass of has formed. As discussed earlier, for most “old” LBGs, it is not possible to distinguish from a strong Balmer break whether constant star-formation has continued for at least 1 Gyr, or whether exponentially declining star-formation has continued well past the age of the time constant, . If the relatively quiescent star-formation rates of the old galaxies are extrapolated back to the ages of the young/dusty sample assuming an exponentially declining star-formation rate with a time constant on the order of the dynamical timescale for LBGs, the star-formation rates obtained are on the order of the active rates in the young-dusty sample.
Such a simple evolutionary picture for LBGs is qualitatively consistent with the strong correlations we see in the NIRC LBG stellar population parameters. This evolutionary picture predicts a relatively flat distribution of values, which is broadly consistent with the observed histogram (Figure 10a) except for the smallest bin, which is “over-sampled” in the NIRC LBG data set by about a factor of two (§2.2). While correcting the youngest bin by this amount makes the distribution flatter, the youngest bin still contains more galaxies than the other bins, implying that some fraction of the young, dusty, actively star-forming galaxies may fade to star-formation rates which are too low to be detected with the (ground-based) LBG criteria.
There are several interesting issues which accompany the above scenario. First, there is the question of what process produces the initial, rapid star-formation phase. Some obvious possibilities are major or minor merger events (e.g., Somerville et al. 2001; Mihos & Hernquist 1996), or even the initial collapse of the baryonic component of the galaxy. Second, there is the question of how the large amount of dust in the significantly reddened “young” galaxies forms, given the relatively short timescales implied by the ages of these galaxies— how much of the dust is formed in the current star-formation episode, and how much originated in previous generations of stars?
Another important issue is the process by which dust is depleted as “young” LBGs evolve into “old” galaxies. There are a few proposed mechanisms for the removal of dust from galaxies. The first is radiation pressure, by which dust grains (especially larger ones in size) can be expelled by the general radiation field of a galaxy. Davies et al. (1998) have numerically modeled the removal of dust from a present-day spiral galaxy by radiation pressure, and have shown that up to of the dust formed in such a galaxy may be ejected from the disk. While the relevant physical conditions might not be identical in local spiral galaxies and the high redshift LBGs, radiation pressure provides one viable mechanism by which dust can be removed from galaxies. Perhaps more relevant to the conditions in LBGs is the observational evidence for galactic-scale outflows, so-called “superwinds,” in actively star-forming local galaxies. These outflows are due to the combined mechanical energy input from supernovae and winds from massive stars, which sweeps up interstellar material and accelerates it to speeds of several hundred or greater (Heckman et al. 1990, Heckman et al. 2000). There is strong kinematic evidence for such outflows in LBGs at high-redshift as well (Franx et al. 1997; Steidel et al. 1998; Pettini et al. 1998, 2000, 2001). Relative to the nebular emission lines representing the systemic velocity of the galaxy, low-ionization interstellar absorption lines in LBG rest-frame UV spectra are blue-shifted by , and Lyman- emission is redshifted by (Pettini et al. 2001). The implied typical outflow velocities are km s-1, and in the best studied case (Pettini et al. 2000) the implied mass outflow rate equals or exceeds the current star-formation rate (similar to what is seen in local starburst galaxies— e.g. Martin 1999).
Recently, there has been direct observational evidence that dust, as well as gas, has been swept up by starburst superwinds and is contained in the material outflowing from local starburst galaxies (Heckman et al. 2000; Alton, Davies, & Bianchi 1999). Heckman et al. (2000) determine a typical outflowing dust mass of with a typical dust outflow rate of for the starbursts in their sample. While there are no direct observations of dust in LBG outflows, the presence of dust in the ISM of LBGs is required by their broad-band colors. It seems very reasonable that the dust in the ISM of LBGs becomes entrained in the outflows implied by the kinematics of UV interstellar and nebular spectral features. The process of dust being expelled in superwinds from starburst galaxies at high redshift is qualitatively consistent with the observed trend between extinction and star-formation age in LBGs. Indeed, the superwind phenomenon has important implications not only for the enrichment of the intergalactic medium, but also for the evolution of dust opacity in galaxies.
8 SUMMARY AND CONCLUSIONS
We have presented the results of a near-IR survey of optically selected LBGs. The survey includes 118 galaxies with measurements, 63 of which also have measurements. We combined the new near-IR data with previously obtained optical data to compute the distributions of optical-IR colors of LBGs. We have used the photometric data, spanning typical rest-frame wavelengths of 900–5500 Å to obtain the following results:
1. The rest-frame optical luminosity function of UV-selected LBGs greatly exceeds locally determined luminosity functions at the bright end. A Schechter function fit formally yields a very steep () faint-end slope, but part of this could be due to the fact that at our detection limit of ( at ) the data do not extend significantly beyond the knee in the luminosity function and the overall shape of the luminosity distribution is quite different from the local functions. Independent of the fitted parameters, the optical luminosity function has a large excess of luminous galaxies relative to locally determined luminosity functions. Down to our detection limit of (or a luminosity equivalent to in the present-day -band luminosity function), the rest-frame optical co-moving luminosity density of LBGs (uncorrected for dust extinction) is . This value is already within a factor of 2 of values determined by integrating local luminosity functions down to arbitrarily small luminosities. Thus, the optical light from LBGs at likely exceeds that produced by all stars in the local universe.
2. We have modeled the stellar populations and extinction of the LBGs with both spectroscopic redshifts and near-IR measurements (81 galaxies) using relatively simple prescriptions. Most of the galaxies have star-formation histories, star-formation rates, and star-formation ages that are only weakly constrained by the photometric observations without limiting parameter space using external constraints on the assumed extinction law and relatively simple forms for the star-formation history. We have chosen to report the results assuming the solar-metallicity Bruzual and Charlot (1996) models, a Salpeter IMF, the Calzetti (1997) starburst attenuation relation, and a constant star-formation history. The systematic effects of changing the any of these assumptions have been summarized.
3. When the interpretation of LBG stellar populations is restricted to BC96 constant star-formation models, we find a large spread of inferred ages, ranging from several Myr to more than 1 Gyr. The median best-fit constant star-formation age is . In model-independent terms, the distribution of best-fit ages indicates that a significant fraction of LBGs have been forming stars on timescales long enough that a detectable Balmer break exists in their spectral energy distributions. Although the specific age assigned to the Balmer break depends on the star-formation history used to fit the colors, we note that very recent work indicates that winds from LBGs similar to those modeled above have shock-heated the intergalactic medium on physical scales of kpc (Adelberger et al. 2001, in preparation). Such a large sphere of influence, with typical outflow velocities of a few hundred km s-1, suggests star-formation timescales of at least a few hundred million years for typical LBGs. This constitutes completely independent support for the timescales resulting from the stellar population modeling presented in this work. The BC96 constant star-formation distribution of best-fit ranges from with a median of 0.155. This distribution depends less on star-formation history than the distribution of best-fit ages. The median implied extinction for this sample corresponds to a factor of attenuation in the rest-frame UV (1600 Å) and a factor of 2 in the rest-frame optical. Derived from the distributions of and , the best-fit star-formation rate, , ranges from , with a median of . The distribution of formed stellar masses, , ranges over more than 2 orders of magnitude with a median of . We note that the above parameter distributions and median values may not be completely general to LBGs at , since the way in which the NIRC LBGs were selected tended to enhance the number of young, dusty, intensely star-forming, low objects, relative to the full LBG sample.
4. Regardless of the star-formation history used in this work to model the colors of the NIRC LBGs, we find a strong correlation between dust extinction and intrinsic luminosity, such that dustier galaxies are intrinsically more luminous. This correlation has been reported by other authors (AS2000; Meurer et al. 1999), but here the extinction estimates are supported by observations over a wider wavelength baseline, spanning on average from in the rest-frame. This dependence of extinction on luminosity is consistent with a similar relation seen for star-forming galaxies in the local universe, and has the implication that, for the range of galaxies which we select as LBGs, those which are more heavily obscured by dust are as easy to detect in the rest-frame UV and optical as galaxies which are less dusty, because they are also intrinsically more luminous.
5. For most galaxies, we find that the formed stellar mass derived from the integral of the best-fit star-formation rate over time depends relatively weakly on the star-formation history applied to fit the observed colors (cf. Papovich et al. 2001). Regardless of star-formation history, the inferred formed stellar mass is only weakly correlated with extinction corrected UV and optical luminosities for our total ground-based sample. This fact, together with the results on the rest-frame optical luminosity function of LBGs, shows that even at observed wavelengths of 2.15 m, the luminosities are poor proxies for stellar mass in general. Therefore, inferences on stellar mass from optical/near-IR photometry are highly IMF-dependent and will apply only to the stars that have formed in the last several hundred Myr prior to observation. Longer-wavelength observations with SIRTF should improve the situation considerably.
6. We find a strong correlation between inferred star-formation age and extinction in LBGs, such that younger galaxies are dustier than older galaxies, and have higher star-formation rates. Establishing the significance of this correlation is difficult because of the covariance of and in our fits, but we have been unable to reproduce a similarly strong observed correlation from any intrinsically uncorrelated distributions of and . The correlation might be made to vanish with a suitable choice of star-formation histories or dust attenuation curve (i.e. SMC), but its existence appears secure for the most plausible choices of both. We also present evidence that this correlation is not an artifact of either the LBG selection criteria, or of the typical detection limit of for the NIRC observations.
7. Composite rest-frame UV spectra of “young” and “old” subsamples of NIRC LBGs exhibit differences, most dramatically in their respective Lyman- profiles, offering independent evidence that the youngest galaxies have more dust extinction and/or more active interstellar media. We interpret the dust-age correlation in the context of a unified picture of LBGs in which the younger, dustier, more actively star-forming galaxies evolve into the older, less reddened, and more quiescent galaxies. The evolution of the dust extinction towards lower values is probably governed by the outflow of dust which is entrained in a “superwind” powered by the energy from supernovae explosions and the winds from massive stars. Objects at various points along this evolutionary sequence are identified by the LBG optical selection criteria. The timescale for the evolution of the young-dusty galaxies into the older-less-reddened galaxies is on the order of , while the more quiescent phase can last a Gyr or more.
We would like to thank the staffs of the Palomar, La Palma, Kitt Peak, and Keck Observatories for their assistance in both optical and near-infrared observations. We would also like to thank Matthew Hunt, for assistance with the near-IR data reduction, and Stephane Charlot for helpful discussions and assistance in implementing the most up-to-date Bruzual and Charlot spectral synthesis codes. Finally, we wish to extend special thanks to those of Hawaiian ancestry on whose sacred mountain we are privileged to be guests. Without their generous hospitality, most of the observations presented herein would not have been possible. CCS, KLA, and AES have been supported by grants AST95-96229 and AST-0070773 from the U.S. National Science Foundation and by the David and Lucile Packard Foundation.
References
- (1) Adelberger, K.L. 2001, Ph. D. Thesis
- (2) Adelberger, K.L., & Steidel, C.C. 2000, ApJ, 544, 218
- (3) Adelberger, K.L., Steidel, C.C., Giavalisco, M., Dickinson, M.E., Pettini, M., & Kellogg, M. 1998, ApJ, 505, 18
- (4) Alton, P.B., Davies, J.I., & Bianchi, S. 1999, A&A, 343, 51
- (5) Baugh, C. M., Cole, S., Frenk, C. S., & Lacey, C. G. 1998, ApJ, 498, 504
- (6) Blanton, M. et al. 2001, AJ, accepted (astro-ph/0012085)
- (7) Binney, J. & Merrifield, M. 1998, Galactic Astronomy (Princeton: Princeton University Press) Prevot-Burnichon, M. L. 1985, A&A, 149, 330
- (8) Bruzual, G., & Charlot, S. 1996, BC96 manual (private communication)
- (9) Calzetti, D. 1997, AJ, 113, 162
- (10) Chapman, S. et al. 2000, MNRAS, 319, 318
- (11) Charlot, S., & Fall, S.M. 1993, ApJ, 415, 580
- (12) Chen, W.L., & Neufeld, D.A. 1994, ApJ, 432, 567
- (13) Cole, S. et al. 2000, MNRAS in press (astro-ph/0012429)
- (14) Davies, J.I., Alton, P.B., Bianchi, S., Trewhella, M. 1998, MNRAS, 300, 106
- (15) Dickinson, M.E., 2000, Phil. Trans. R. Soc. Lond. A, 358, 2001
- (16) Folkes, S. et al. 1999, MNRAS, 308, 459
- (17) Franx, M., Illingworth, G. D., Kelson, D. D., van Dokkum, P. G., & Tran, K.-V. 1997, ApJ, 486, L75
- (18) Fukugita, M., Hogan, C.J., Peebles, P.J.E. 1998, ApJ, 503, 518
- (19) Giavalisco, M., & Dickinson, M. E. 2001, ApJ, 550, 177
- (20) Giavalisco, M., Steidel, C. C., Adelberger, K. L., Dickinson, M. E., Pettini, M., & Kellogg, M. 1998, ApJ, 503, 543
- (21) Giavalisco, M., Steidel, C. C., & Macchetto 1996, ApJ, 470, 189
- (22) Gonzalez Delgado, R.M., Leitherer, C., Heckman, T.M., Lowenthal, J.D., Ferguson, H.C., & Robert, C. 1998, ApJ, 495, 698
- (23) Gray, D. F. 1976, The Observation and Analysis of Stellar Photospheres (New York: Wiley)
- (24) Heckman, T.M., Lehnert, M.D., Strickland, D.K., Armus, L. 2000, ApJS, 129, 493
- (25) Heckman, T.M., & Leitherer, C. 1997, AJ, 114, 69
- (26) Heckman, T. M., Armus, L., & Miley, G. K. 1990, ApJS, 74, 833
- (27) Kunth, D., Mas-Hesse, J. M., Terlevich, E., Terlevich, R., Lequeux, J., & Fall, S. M. 1998, A&A, 334, 11
- (28) Leitherer, C., Leao, J.R.S., Heckman, T.M., Lennon, D.J., Pettini, M., Robert, C. 2001, ApJ 550, 724
- (29) Leitherer, C., et al. 1999, ApJS, 123, 3
- (30) Lejeune, T., Cuisinier, F., Buser, R. 1997, A&AS, 125, 229
- (31) Lejeune, T., Buser, R., Cuisinier, F. 1996, GISSEL96 CD-ROM
- (32) Lin, H., Kirshner, R.P., Schechtman, S.A., Landy, S.D., Oemler, A., Tucker, D.L., Schechter, P.L. 1996, ApJ, 464, 60
- (33) Liu, M.C., Charlot, S., & Graham, J.R. 2000, ApJ, 543, 644
- (34) Lowenthal, J. D., Koo, D., Guzman, R., Gallego, J., Phillips, A., Faber, S.M., Vogt, N.P., Illingworth, G., & Gronwall, C. 1997, ApJ, 481, 673
- (35) Madau, P. Ferguson, H. C., Dickinson, M. E., Giavalisco, M., Steidel, C. C., & Fruchter, A. 1996, MNRAS, 283, 1388
- (36) Madau, P. 1995, ApJ, 444, 18
- (37) Martin C. L. 1999, ApJ, 513, 156
- (38) Matthews, K. & Soifer, B.T. 1994, in Infrared Astronomy with Arrays: The Next Generation, ed. I. McLean (Dordrecht:Klewer), 239
- (39) Meurer, G.R., & Seibert 2001, in Starburst Galaxies Near and Far eds. D. Lutz & L. Tacconi (Springer) (astro-ph/0101479)
- (40) Meurer, G.R., Heckman, T.M., & Calzetti, D. 1999, ApJ, 521, 64
- (41) Mihos, J.C. & Hernquist, L. 1996, ApJ, 464, 641
- (42) Oke, J. B. et al. 1995, PASP 107, 3750
- (43) Papovich, C., Dickinson, M.E., & Ferguson, H.C. 2001, ApJ, accepted (astro-ph/0105087)
- (44) Persson, E., Murphy, D., Krzeminski, W., Roth, M., & Rieke, M. 1998, AJ, 116, 2475
- (45) Pettini, M., Shapley, A.E., Steidel, C.C., Cuby, J-G., Dickinson, M.E., Moorwood, A., Adelberger, K.L., Giavalisco, M. 2001, ApJ, 554, 981
- (46) Pettini, M., Steidel, C.C., Adelberger, K.L., Dickinson, M., & Giavalisco, M. 2000, ApJ, 528, 96
- (47) Pettini, M., Kellogg, M., Steidel, C.C., Dickinson, M.E., Adelberger, K.L., & Giavalisco, M. 1998, ApJ, 508, 539
- (48) Sawicki, M., & Yee, H. K. C. 1998, AJ, 115, 1329
- (49) Schechter, P. 1976, ApJ, 203, 297
- (50) Somerville, R.S., Primack, J.R., & Faber, S.M. 2001, MNRAS, 320, 504
- (51) Steidel, C.C., Adelberger, K.L., & Pettini, M. 2001, ApJ, 546, 665
- (52) Steidel, C.C., Adelberger, K.L., Giavalisco, M., Dickinson, M.E., & Pettini, M. 1999, ApJ, 519, 1
- (53) Steidel, C.C., Adelberger, K. L., Dickinson, M.E., Giavalisco, M., Pettini, M. & Kellogg, M. 1998, ApJ, 492, 428
- (54) Steidel, C.C., Giavalisco, M., Pettini, M., Dickinson, M.E., & Adelberger, K.L. 1996a, ApJL, 462, 17
- (55) Steidel, C.C., Giavalisco, Dickinson, M.E., & Adelberger, K.L. 1996b, AJ, 112, 352
- (56) Steidel, C.C., Pettini, M., & Hamilton, D. 1995, AJ, 110, 2519
- (57) Steidel, C.C., & Hamilton, D. 1993, AJ, 105, 2017
- (58) Steidel, C.C., & Hamilton, D. 1992, AJ, 104, 941
- (59) Tenorio-Tagle, G., Silich, S. A., Kunth, D., Terlevich, E., & Terlevich, R. 1999, MNRAS, 309, 332
- (60) Trentham, N., Kormendy, J., & Sanders, D. B. 1999, AJ, 117, 2152
- (61) Valdes, F. 1982, FOCAS User’s Manual (NOAO, Tucson)
- (62) Williams, R. E., et al. 1996, AJ, 112, 1335
| Field Name | Field Center | Area () | Area () | # Galaxies () | Area () | # Galaxies () |
|---|---|---|---|---|---|---|
| (J2000) | (arc min)2 | (arc min)2 | (arc min)2 | |||
| CDFa | 00 53 23.7 +12 34 00 | 78.42 | 1.72 | 7 | 1.18 | 5 |
| Q0201 | 02 03 51.6 +11 34 09 | 75.77 | 1.35 | 3 | 1.21 | 3 |
| Q0256 | 02 59 08.6 +00 11 41 | 72.28 | 1.17 | 6 | ||
| B2 0902+34 | 09 05 30.2 +34 07 55 | 41.93 | 2.63 | 10 | 1.77 | 6 |
| HDF | 12 36 52.3 +62 12 59 | 75.32 | 2.96 | 14 | 2.29 | 10 |
| WESTPHAL | 14 17 14.5 +52 24 36 | 226.93 | 9.03 | 30 | 4.12 | 15 |
| 3C324 | 15 49 49.6 +21 29 07 | 44.29 | 1.85 | 6 | 0.56 | 2 |
| SSA22a | 22 17 34.2 +00 15 01 | 77.75 | 5.75 | 22 | 1.73 | 6 |
| SSA22b | 22 17 34.2 +00 06 18 | 77.60 | 0.59 | 2 | ||
| DSF2237a | 22 40 08.5 +11 52 34 | 83.38 | 0.64 | 1 | 0.61 | 1 |
| DSF2237b | 22 39 34.3 +11 51 44 | 81.62 | 2.43 | 17 | 1.71 | 15 |
| TOTAL | 935.29 | 30.12 | 118 | 15.18 | 63 |
| Pointing | Objects | Exposure () | Exposure () |
|---|---|---|---|
| (sec) | (sec) | ||
| CDFa-C8 | C8,MD10 | 2400 | |
| CDFa-C1 | C1,MD2 | 3780 | 1620 |
| CDFa-C22 | C22,M19,C19 | 3780 | 4620 |
| Q0201-C6 | C6,MMD21 | 3480 | 3780 |
| Q0201-B13 | B13 | 2700 | 2400 |
| Q0256-M13 | M13,C15,MD22 | 5220 | |
| Q0256-M17 | M17,MD32,MD34 | 4260 | |
| B20902-C6 | C6,M11,MD31 | 3780 | 3240 |
| B20902-MD21 | MD21 | 3240 | 3240 |
| B20902-D11 | D11,D12,MD32 | 1080 | 1620 |
| B20902-MD11 | MD11,MD14,MD18 | 2160 | |
| HDF-MM23 | MM23,oC37,oMD49 | 6000 | 4680 |
| HDF-DD15 | DD15,MM28 | 3780 | 1620 |
| HDF-CC24 | CC24,oC38,oM5,MM25 | 2160 | |
| HDF-DD3 | DD3,MM9,MM7 | 3120 | 3240 |
| HDF-MM18 | MM18,MM17 | 3240 | 3240 |
| WESTPHAL-CC70 | CC70,MM69,DD49 | 3240 | 3240 |
| WESTPHAL-DD8 | DD8,MMD14,MMD16,MM8 | 3240 | 3240 |
| WESTPHAL-C11 | C11 | 3240 | |
| WESTPHAL-CC13 | CC13 | 2700 | |
| WESTPHAL-CC32 | CC32,MMD53,MMD54 | 3240 | |
| WESTPHAL-CC79 | CC79,MMD115 | 3000 | |
| WESTPHAL-MMD17 | MMD17,MMD20,MM13 | 6420 | 2520 |
| WESTPHAL-CC63 | CC63,MMD91 | 3240 | 3180 |
| WESTPHAL-MMD11 | MMD11 | 1080 | 1620 |
| WESTPHAL-CC1 | CC1 | 3240 | |
| WESTPHAL-CC43 | CC43,CC45,DD29 | 3180 | 3240 |
| WESTPHAL-MMD109 | MMD109,MMD112 | 1620 | |
| WESTPHAL-MMD113 | MMD113,MMD11 | 1080 | |
| WESTPHAL-MMD23 | MMD23,MM11 | 1620 | |
| 3C324-C1 | C1,C2,MD5 | 4200 | |
| 3C324-D7 | D7,C12 | 1080 | 1380 |
| 3C324-C3 | C3 | 1620 | |
| SSA22a-D14 | D14,MD42,MD40,M31 | 1860 | |
| SSA22a-D3 | D3,MD3 | 7800 | 2700 |
| SSA22a-MD46 | MD46,MD50 | 3360 | |
| SSA22a-aug96D1 | aug96D1,M8 | 3780 | |
| SSA22a-C16 | C16,M13,M11 | 3240 | |
| SSA22a-C36 | C36 | 3240 | 3240 |
| SSA22a-C6 | C6,M4,MD4 | 6960 | 4860 |
| SSA22a-blob1 | C11,C15,M10 | 2160 | |
| SSA22a-blob2 | M14,MD14 | 2160 | |
| SSA22b-oct96D8 | oct96D8,MD11 | 2880 | |
| DSF2237a-C2 | C2 | 1860 | 2700 |
| DSF2237b-M20 | M20,C26,M19,MD56,MD57,M17,M18 | 7380 | 7920 |
| DSF2237b-MD2 | MD2,MD10 | 3240 | |
| DSF2237b-D28 | D28,MD81,MD80,C43 | 3240 | 3240 |
| DSF2237b-D3 | D3,D4,MD9,C1 | 6480 | 4860 |
| Object Name | RA (J2000) | Dec (J2000) | |||||
|---|---|---|---|---|---|---|---|
| CDFa-C22 | 00 53 09.42 | +12 36 00.5 | 23.97 | 0.73 0.08 | 0.90 0.50 | 3.18 0.23 | 3.046 |
| CDFa-M19 | 00 53 11.04 | +12 36 12.3 | 25.29 | 0.84 0.15 | 0.93 0.75 | 2.79 | |
| CDFa-C19 | 00 53 11.27 | +12 35 39.9 | 24.63 | 0.81 0.13 | 1.96 0.30 | 3.79 0.24 | 2.667 |
| CDFa-C8 | 00 53 32.85 | +12 32 11.4 | 23.72 | 0.96 0.08 | 2.16 0.40 | 3.071 | |
| CDFa-MD10 | 00 53 32.22 | +12 31 56.3 | 25.42 | 0.48 0.16 | 2.10 0.60 | ||
| CDFa-C1 | 00 53 34.74 | +12 30 30.6 | 23.53 | 0.69 0.06 | 1.29 0.18 | 2.69 0.21 | 3.110 |
| CDFa-MD2 | 00 53 36.31 | +12 30 31.2 | 23.88 | 0.75 0.06 | 1.52 0.23 | 2.96 0.24 | 2.871 |
| Q0201-C6 | 02 03 41.81 | +11 34 41.5 | 23.92 | 0.62 0.07 | 0.40 0.55 | 2.39 0.42 | 3.052 |
| Q0201-MMD21 | 02 03 41.66 | +11 34 44.8 | 24.67 | 0.51 0.12 | 1.46 0.47 | 2.72 0.28 | |
| Q0201-B13 | 02 03 49.23 | +11 36 10.8 | 23.34 | 0.03 0.08 | 1.72 0.13 | 2.81 0.15 | 2.167 |
| Q0256-C15 | 02 59 00.02 | +00 11 38.6 | 24.23 | 0.69 0.09 | 2.46 0.46 | 3.385 | |
| Q0256-M13 | 02 58 58.83 | +00 11 25.4 | 24.48 | 0.96 0.12 | 2.89 0.38 | 3.227 | |
| Q0256-M17 | 02 59 19.86 | +00 12 32.4 | 24.04 | 1.10 0.11 | 1.54 | ||
| Q0256-MD22 | 02 59 00.79 | +00 11 40.3 | 24.54 | 0.74 0.11 | 2.30 0.51 | ||
| Q0256-MD32 | 02 59 18.11 | +00 12 41.5 | 23.61 | 0.89 0.07 | 2.61 0.25 | ||
| Q0256-MD34 | 02 59 20.21 | +00 13 02.9 | 24.02 | 0.72 0.08 | 3.88 0.14 | ||
| B20902-D11 | 09 05 23.01 | +34 09 40.1 | 22.97 | 0.29 0.06 | 0.89 0.27 | 2.97 0.13 | 2.837 |
| B20902-D12 | 09 05 23.45 | +34 09 45.0 | 25.46 | -0.12 0.10 | -0.23 | 2.96 | |
| B20902-MD32 | 09 05 26.24 | +34 09 28.8 | 24.03 | 0.73 0.10 | 1.25 0.37 | 2.52 0.41 | 2.860 |
| B20902-C6 | 09 05 20.58 | +34 09 07.7 | 24.13 | 0.45 0.08 | 0.73 0.54 | 2.39 0.45 | 3.098 |
| B20902-M11 | 09 05 19.58 | +34 09 04.0 | 24.19 | 1.18 0.16 | 1.36 0.43 | 2.82 0.32 | 3.300 |
| B20902-MD31 | 09 05 20.27 | +34 09 29.6 | 24.74 | 0.55 0.12 | 3.77 0.24 | ||
| B20902-MD21 | 09 05 20.08 | +34 07 19.7 | 24.18 | 1.06 0.16 | 1.03 0.49 | 2.51 0.32 | 3.017 |
| B20902-MD11 | 09 05 35.20 | +34 06 25.2 | 24.27 | 1.04 0.16 | 2.22 0.48 | 3.392 | |
| B20902-MD14 | 09 05 36.58 | +34 06 37.0 | 24.68 | 0.97 0.14 | 3.44 0.28 | ||
| B20902-MD18 | 09 05 35.23 | +34 06 53.2 | 24.51 | 0.41 0.12 | 2.01 | 2.869 | |
| HDF-CC24 | 12 36 51.81 | +62 15 16.3 | 24.33 | 0.76 0.12 | 2.72 0.40 | 3.333 | |
| HDF-DD3 | 12 36 47.60 | +62 10 54.1 | 24.25 | 0.58 0.09 | 1.45 0.30 | 2.82 0.32 | 2.942 |
| HDF-DD15 | 12 36 48.97 | +62 15 43.4 | 23.61 | 0.62 0.07 | 0.36 0.49 | 2.39 0.37 | 3.135 |
| HDF-MM7 | 12 36 47.75 | +62 10 32.9 | 24.79 | 0.67 0.17 | 1.02 0.68 | 2.29 | 2.985 |
| HDF-MM9 | 12 36 51.45 | +62 10 42.7 | 24.73 | 0.78 0.16 | 4.04 0.19 | 2.972 | |
| HDF-MM17aaThis galaxy is in the central Hubble Deep Field (HDF), and is referred to as “4-52.0” in Williams et al. (1996) and “HDF/NIC 813/814” in Papovich et al. (2001). | 12 36 47.67 | +62 12 56.8 | 24.46 | 1.00 0.15 | 1.52 0.45 | 3.54 0.25 | 2.931 |
| HDF-MM18bb This galaxy is in the central HDF, and is referred to as “1-54.0” in Williams et al. (1996) and “HDF/NIC 522” in Papovich et al. (2001). | 12 36 44.01 | +62 13 11.9 | 24.10 | 1.00 0.11 | 1.63 0.21 | 3.46 0.16 | 2.929 |
| HDF-MM23 | 12 37 02.64 | +62 14 27.0 | 24.61 | 1.09 0.16 | 1.58 0.47 | 3.65 0.24 | 3.214 |
| HDF-MM25 | 12 36 50.72 | +62 14 45.6 | 24.82 | 0.74 0.17 | 2.45 0.57 | 3.105 | |
| HDF-MM28 | 12 36 46.64 | +62 15 18.1 | 25.04 | 0.70 0.18 | 1.01 0.70 | 2.89 0.53 | 3.371 |
| HDF-oC37 | 12 37 03.18 | +62 14 52.1 | 25.25 | 0.40 0.16 | 0.99 0.75 | 2.14 0.40 | 2.925 |
| HDF-oC38 | 12 36 48.81 | +62 15 03.6 | 24.97 | 0.67 0.18 | -0.81 0.61 | 3.47 0.32 | 3.114 |
| HDF-oMD49 | 12 37 04.25 | +62 14 47.2 | 24.78 | -0.09 0.11 | 2.20 0.24 | 4.21 0.19 | 2.212 |
| HDF-oM5 | 12 36 50.46 | +62 14 45.5 | 24.98 | 0.93 0.16 | 2.93 0.53 | 3.097 | |
| WESTPHAL-CC79 | 14 17 13.70 | +52 36 16.5 | 24.28 | 0.87 0.14 | 3.17 0.40 | 3.061 | |
| WESTPHAL-MMD115 | 14 17 15.48 | +52 36 12.6 | 23.97 | 0.65 0.11 | 1.62 0.41 | 3.203 | |
| WESTPHAL-MMD109 | 14 17 27.43 | +52 35 49.0 | 23.94 | 0.84 0.11 | 3.05 0.20 | 2.715 | |
| WESTPHAL-MMD112 | 14 17 26.57 | +52 35 59.2 | 25.34 | 0.63 0.20 | 2.84 | ||
| WESTPHAL-MMD113 | 14 18 24.85 | +52 36 10.0 | 23.29 | 0.45 0.08 | 2.71 0.24 | 2.730 | |
| WESTPHAL-MMD111 | 14 18 23.71 | +52 36 09.2 | 25.03 | 0.08 0.15 | 3.22 0.49 | ||
| WESTPHAL-CC70 | 14 17 31.43 | +52 34 25.6 | 23.75 | 0.55 0.08 | 1.28 0.24 | 2.41 0.31 | 2.992 |
| WESTPHAL-MM69 | 14 17 30.62 | +52 34 17.2 | 25.24 | 0.83 0.21 | 1.49 0.57 | 3.24 0.42 | |
| WESTPHAL-DD49 | 14 17 29.23 | +52 34 31.5 | 23.50 | 0.17 0.06 | 1.33 0.18 | 3.35 0.13 | 2.806 |
| WESTPHAL-CC63 | 14 18 23.10 | +52 32 46.9 | 23.50 | 1.14 0.12 | 1.83 0.14 | 2.60 0.21 | 3.133 |
| WESTPHAL-MMD91 | 14 18 22.93 | +52 32 35.9 | 23.84 | 0.49 0.09 | 1.11 0.35 | 2.73 0.32 | 2.738 |
| WESTPHAL-CC43 | 14 17 25.47 | +52 29 37.9 | 23.87 | 1.04 0.15 | 1.24 0.33 | 3.30 0.16 | 3.081 |
| WESTPHAL-CC45 | 14 17 27.68 | +52 29 50.4 | 24.83 | 0.67 0.18 | 1.59 0.53 | 3.03 0.41 | 2.758 |
| WESTPHAL-DD29 | 14 17 25.92 | +52 29 32.1 | 24.82 | 0.32 0.13 | 1.60 0.42 | 3.86 0.24 | 3.240 |
| WESTPHAL-CC32 | 14 18 14.45 | +52 28 04.7 | 24.17 | 0.55 0.11 | 2.40 0.46 | 3.197 | |
| WESTPHAL-MMD53 | 14 18 12.63 | +52 28 06.6 | 25.22 | 0.36 0.16 | 3.98 0.25 | ||
| WESTPHAL-MMD54 | 14 18 14.46 | +52 28 16.0 | 24.64 | 0.45 0.13 | 2.98 0.45 | 3.017 | |
| WESTPHAL-MMD23 | 14 17 21.95 | +52 23 39.1 | 24.22 | 0.82 0.14 | 2.81 0.32 | 2.857 | |
| WESTPHAL-MM11 | 14 17 22.02 | +52 23 27.0 | 25.24 | 0.61 0.20 | 3.59 0.32 | ||
| WESTPHAL-CC13 | 14 18 02.47 | +52 24 36.5 | 23.64 | 1.06 0.14 | 2.42 0.37 | 3.396 | |
| WESTPHAL-MMD17 | 14 18 09.56 | +52 23 32.1 | 24.56 | 0.91 0.17 | 2.04 0.24 | 2.49 0.55 | 2.869 |
| WESTPHAL-MMD20 | 14 18 09.63 | +52 23 37.2 | 24.59 | 0.63 0.16 | 1.87 0.30 | 2.15 0.50 | 2.799 |
| WESTPHAL-MM13 | 14 18 12.15 | +52 23 30.4 | 25.40 | 0.69 0.21 | 3.96 0.27 | 2.856 | |
| WESTPHAL-west3-C11 | 14 18 17.63 | +52 23 46.2 | 24.25 | 1.22 0.16 | 2.69 0.40 | 3.137 | |
| WESTPHAL-DD8 | 14 18 25.44 | +52 23 22.4 | 24.47 | 0.68 0.14 | 1.09 0.56 | 2.77 0.46 | 2.841 |
| WESTPHAL-MMD14 | 14 18 24.72 | +52 23 19.8 | 24.92 | 0.82 0.20 | 1.62 0.42 | 3.08 0.41 | |
| WESTPHAL-MMD16 | 14 18 23.61 | +52 23 28.8 | 24.73 | 0.92 0.17 | 1.88 0.30 | 4.06 0.19 | |
| WESTPHAL-MM8 | 14 18 23.92 | +52 23 07.7 | 24.13 | 1.04 0.16 | 1.74 0.21 | 3.25 0.19 | 2.829 |
| WESTPHAL-MMD11 | 14 18 09.73 | +52 22 01.3 | 24.05 | 1.04 0.16 | 2.67 0.10 | 4.54 0.11 | 2.979 |
| WESTPHAL-CC1 | 14 18 21.98 | +52 21 22.0 | 23.83 | 1.02 0.15 | 2.78 0.32 | 2.984 | |
| 3C324-D7 | 15 49 52.96 | +21 30 59.1 | 23.88 | 0.52 0.08 | 0.78 0.49 | 3.01 0.20 | |
| 3C324-C12 | 15 49 53.95 | +21 31 06.7 | 25.04 | 0.54 0.15 | 0.78 0.71 | 3.34 0.45 | |
| 3C324-C3 | 15 49 47.10 | +21 27 05.5 | 24.14 | 0.85 0.13 | 2.57 0.41 | 3.283 | |
| 3C324-C1 | 15 49 54.27 | +21 26 33.2 | 24.33 | 0.62 0.14 | 3.12 0.26 | 2.873 | |
| 3C324-C2 | 15 49 53.98 | +21 26 35.6 | 24.26 | 0.54 0.10 | 3.19 0.26 | 2.880 | |
| 3C324-MD5 | 15 49 54.46 | +21 26 34.6 | 25.48 | -0.08 0.24 | 3.93 0.27 | ||
| SSA22a-MD46 | 22 17 27.28 | +00 18 09.9 | 23.30 | 0.42 0.09 | 2.34 0.29 | 3.090 | |
| SSA22a-MD50 | 22 17 26.83 | +00 18 30.2 | 25.18 | 0.20 0.17 | 3.18 0.47 | ||
| SSA22a-D14 | 22 17 35.29 | +00 17 24.1 | 24.32 | 0.19 0.14 | 2.07 0.46 | 3.018 | |
| SSA22a-MD42 | 22 17 35.83 | +00 17 19.8 | 25.33 | 0.06 0.17 | 4.04 0.25 | ||
| SSA22a-MD40 | 22 17 35.96 | +00 17 08.3 | 24.89 | 0.70 0.19 | 2.21 0.57 | 3.015 | |
| SSA22a-M31 | 22 17 36.87 | +00 17 12.4 | 25.41 | 0.42 0.18 | 3.22 0.44 | ||
| SSA22a-C36 | 22 17 46.10 | +00 16 43.1 | 24.06 | 0.78 0.13 | 1.23 0.37 | 3.07 0.23 | 3.065 |
| SSA22a-C16 | 22 17 31.96 | +00 13 16.1 | 23.64 | 0.98 0.10 | 2.86 0.20 | 3.061 | |
| SSA22a-M13 | 22 17 31.46 | +00 12 55.2 | 25.46 | 0.74 0.24 | 2.96 | ||
| SSA22a-M11 | 22 17 31.77 | +00 12 51.3 | 25.35 | 0.50 0.18 | 2.85 | ||
| SSA22a-M14 | 22 17 39.05 | +00 13 30.1 | 25.47 | 0.75 0.24 | 2.99 0.62 | 3.091 | |
| SSA22a-MD14 | 22 17 37.93 | +00 13 44.2 | 24.14 | 0.86 0.14 | 1.96 0.43 | ||
| SSA22a-C11 | 22 17 25.68 | +00 12 35.3 | 24.20 | 0.47 0.12 | 2.82 0.32 | 3.108 | |
| SSA22a-C15 | 22 17 26.12 | +00 12 55.3 | 25.19 | 0.55 0.19 | 3.50 0.32 | 3.092 | |
| SSA22a-M10 | 22 17 26.79 | +00 12 21.1 | 24.45 | 1.03 0.18 | 2.32 0.51 | 3.098 | |
| SSA22a-aug96D1 | 22 17 24.00 | +00 12 02.8 | 23.60 | 0.32 0.09 | 2.79 0.12 | 2.202 | |
| SSA22a-M8 | 22 17 25.11 | +00 11 56.8 | 24.72 | 0.89 0.19 | 3.64 0.24 | ||
| SSA22a-D3 | 22 17 32.42 | +00 11 33.0 | 23.37 | 0.97 0.10 | -0.60 0.40 | 2.24 0.32 | 3.086 |
| SSA22a-MD3 | 22 17 31.89 | +00 11 38.3 | 24.60 | 0.15 0.13 | 1.40 0.47 | 2.17 0.50 | 2.483 |
| SSA22a-C6 | 22 17 40.93 | +00 11 26.0 | 23.44 | 0.79 0.09 | 0.36 0.44 | 2.01 0.37 | 3.099 |
| SSA22a-M4 | 22 17 40.92 | +00 11 27.9 | 24.83 | 0.76 0.19 | 0.93 0.68 | 2.68 0.56 | 3.091 |
| SSA22a-MD4 | 22 17 39.95 | +00 11 39.6 | 24.25 | 0.24 0.12 | 1.03 0.49 | 2.92 0.32 | 2.611 |
| SSA22b-MD11 | 22 17 23.07 | +00 03 42.2 | 25.23 | 0.37 0.15 | 3.14 0.47 | ||
| SSA22b-oct96D8 | 22 17 23.52 | +00 03 57.3 | 23.53 | 0.77 0.08 | 2.87 0.18 | 3.323 | |
| DSF2237a-C2 | 22 40 08.30 | +11 49 04.9 | 23.55 | 1.13 0.10 | 1.47 0.20 | 3.02 0.17 | 3.318 |
| DSF2237b-D28 | 22 39 20.25 | +11 55 11.4 | 24.46 | 0.32 0.08 | 1.34 0.49 | 2.42 0.52 | 2.934 |
| DSF2237b-MD81 | 22 39 21.72 | +11 55 10.5 | 24.16 | 0.31 0.07 | 2.23 0.17 | 4.27 0.14 | 2.819 |
| DSF2237b-MD80 | 22 39 22.23 | +11 55 08.3 | 25.37 | 0.94 0.20 | 1.16 0.77 | 3.08 0.37 | |
| DSF2237b-C43 | 22 39 21.57 | +11 54 44.9 | 24.35 | 0.70 0.11 | 1.73 0.34 | 1.85 | 2.885 |
| DSF2237b-M20 | 22 39 38.88 | +11 52 22.1 | 24.20 | 1.12 0.13 | 1.33 0.43 | 2.96 0.20 | 3.156 |
| DSF2237b-C26 | 22 39 38.02 | +11 52 11.4 | 24.73 | 0.57 0.12 | 1.03 0.60 | 2.64 0.50 | 3.251 |
| DSF2237b-M19 | 22 39 38.04 | +11 52 20.6 | 24.80 | 0.96 0.18 | 1.47 0.53 | 2.79 0.56 | 3.259 |
| DSF2237b-MD56 | 22 39 39.00 | +11 52 19.2 | 25.43 | 0.65 0.17 | 1.81 0.41 | 3.10 0.39 | |
| DSF2237b-MD57 | 22 39 39.92 | +11 52 27.2 | 24.56 | 0.73 0.13 | 0.95 0.66 | 2.51 0.55 | 3.331 |
| DSF2237b-M17 | 22 39 39.87 | +11 52 06.5 | 24.67 | 1.03 0.18 | 1.06 0.60 | 2.53 0.55 | 3.020 |
| DSF2237b-M18 | 22 39 40.16 | +11 52 16.0 | 25.33 | 0.76 0.16 | 0.78 0.72 | 2.83 | |
| DSF2237b-MD2 | 22 39 29.89 | +11 47 12.5 | 24.17 | 0.90 0.12 | 2.28 0.36 | 2.505 | |
| DSF2237b-MD10 | 22 39 30.58 | +11 47 34.3 | 25.04 | 1.01 0.19 | 2.87 0.53 | 3.115 | |
| DSF2237b-D3 | 22 39 18.91 | +11 47 40.4 | 24.19 | 0.51 0.09 | 1.07 0.49 | 2.02 0.37 | 2.931 |
| DSF2237b-D4 | 22 39 18.75 | +11 47 40.5 | 24.35 | 0.17 0.10 | 1.13 0.56 | 2.20 0.29 | 2.935 |
| DSF2237b-MD9 | 22 39 17.68 | +11 47 39.2 | 24.97 | 0.45 0.07 | 0.31 0.56 | 2.47 | |
| DSF2237b-C1 | 22 39 16.90 | +11 47 47.5 | 24.99 | 0.37 0.12 | 1.60 0.51 | 2.95 0.32 | 3.064 |
| Object Name | (Myr) | SFR () | ||
|---|---|---|---|---|
| CDFa-C1 | 0.08 | 905 | 35 | 10.5 |
| CDFa-C19 | 0.38 | 203 | 156 | 10.5 |
| CDFa-C22 | 0.13 | 1278 | 36 | 10.7 |
| CDFa-C8bbThe best-fit ages for the marked galaxies, when unconstrained, were younger than . Such young ages are physically implausible, and therefore we restricted the best-fit ages to be at least . The best-fit quantities listed for marked galaxies reflect this constraint, and provide statistically acceptable fits for marked galaxies. | 0.26 | 10 | 275 | 9.4 |
| CDFa-MD2 | 0.20 | 321 | 65 | 10.3 |
| Q0201-C6 | 0.08 | 321 | 23 | 9.9 |
| Q0201-B13 | 0.04 | 2500 | 14 | 10.5 |
| Q0256-C15 | 0.02 | 905 | 12 | 10.0 |
| Q0256-M13 | 0.15 | 404 | 32 | 10.1 |
| B20902-C6 | 0.05 | 509 | 15 | 9.9 |
| B20902-D11 | 0.09 | 1278 | 53 | 10.8 |
| B20902-M11 | 0.21 | 143 | 80 | 10.1 |
| B20902-MD11 | 0.17 | 30 | 69 | 9.3 |
| B20902-MD21 | 0.23 | 35 | 99 | 9.5 |
| B20902-MD32 | 0.24 | 35 | 110 | 9.6 |
| HDF-CC24 | 0.08 | 806 | 19 | 10.2 |
| HDF-DD15 | 0.10 | 227 | 42 | 10.0 |
| HDF-DD3 | 0.12 | 719 | 23 | 10.2 |
| HDF-MM17 | 0.30 | 321 | 104 | 10.5 |
| HDF-MM18 | 0.32 | 203 | 179 | 10.5 |
| HDF-MM23aaThe best-fit ages for marked galaxies, when unconstrained, were older than the age of the universe at the galaxy’s redshift. The best-fit quantities listed for these galaxies reflect the constraint that the age of a galaxy should not be older than the age of the universe. Such a constraint still provides statistically acceptable fits for marked galaxies. | 0.18 | 2000 | 36 | 10.8 |
| HDF-MM25 | 0.09 | 360 | 11 | 9.6 |
| HDF-MM28aaThe best-fit ages for marked galaxies, when unconstrained, were older than the age of the universe at the galaxy’s redshift. The best-fit quantities listed for these galaxies reflect the constraint that the age of a galaxy should not be older than the age of the universe. Such a constraint still provides statistically acceptable fits for marked galaxies. | 0.05 | 1800 | 8 | 10.1 |
| HDF-MM9aaThe best-fit ages for marked galaxies, when unconstrained, were older than the age of the universe at the galaxy’s redshift. The best-fit quantities listed for these galaxies reflect the constraint that the age of a galaxy should not be older than the age of the universe. Such a constraint still provides statistically acceptable fits for marked galaxies. | 0.24 | 2100 | 49 | 11.0 |
| HDF-oC37 | 0.11 | 114 | 9 | 9.0 |
| HDF-oC38aaThe best-fit ages for marked galaxies, when unconstrained, were older than the age of the universe at the galaxy’s redshift. The best-fit quantities listed for these galaxies reflect the constraint that the age of a galaxy should not be older than the age of the universe. Such a constraint still provides statistically acceptable fits for marked galaxies. | 0.15 | 2000 | 18 | 10.5 |
| HDF-oM5 | 0.29 | 55 | 81 | 9.6 |
| WESTPHAL-CC1bbThe best-fit ages for the marked galaxies, when unconstrained, were younger than . Such young ages are physically implausible, and therefore we restricted the best-fit ages to be at least . The best-fit quantities listed for marked galaxies reflect this constraint, and provide statistically acceptable fits for marked galaxies. | 0.34 | 10 | 516 | 9.7 |
| WESTPHAL-CC13 | 0.11 | 227 | 51 | 10.1 |
| WESTPHAL-CC32 | 0.06 | 454 | 16 | 9.9 |
| WESTPHAL-CC43 | 0.23 | 454 | 104 | 10.6 |
| WESTPHAL-CC45 | 0.23 | 255 | 33 | 9.9 |
| WESTPHAL-CC70 | 0.10 | 321 | 32 | 10.0 |
| WESTPHAL-CC79 | 0.18 | 641 | 45 | 10.4 |
| WESTPHAL-DD49 | 0.17 | 1139 | 68 | 10.9 |
| WESTPHAL-CC63bbThe best-fit ages for the marked galaxies, when unconstrained, were younger than . Such young ages are physically implausible, and therefore we restricted the best-fit ages to be at least . The best-fit quantities listed for marked galaxies reflect this constraint, and provide statistically acceptable fits for marked galaxies. | 0.36 | 10 | 942 | 10.0 |
| WESTPHAL-DD8 | 0.32 | 15 | 175 | 9.4 |
| WESTPHAL-MM8 | 0.37 | 40 | 324 | 10.1 |
| WESTPHAL-MMD109bbThe best-fit ages for the marked galaxies, when unconstrained, were younger than . Such young ages are physically implausible, and therefore we restricted the best-fit ages to be at least . The best-fit quantities listed for marked galaxies reflect this constraint, and provide statistically acceptable fits for marked galaxies. | 0.41 | 10 | 662 | 9.8 |
| WESTPHAL-MMD113 | 0.23 | 81 | 156 | 10.1 |
| WESTPHAL-MMD115bbThe best-fit ages for the marked galaxies, when unconstrained, were younger than . Such young ages are physically implausible, and therefore we restricted the best-fit ages to be at least . The best-fit quantities listed for marked galaxies reflect this constraint, and provide statistically acceptable fits for marked galaxies. | 0.13 | 10 | 71 | 8.9 |
| WESTPHAL-MMD23 | 0.32 | 20 | 219 | 9.6 |
| WESTPHAL-MMD54 | 0.10 | 1278 | 14 | 10.3 |
| WESTPHAL-MMD91 | 0.16 | 286 | 42 | 10.1 |
| WESTPHAL-west3-C11 | 0.29 | 15 | 223 | 9.5 |
| 3C324-C1 | 0.12 | 1434 | 20 | 10.4 |
| 3C324-C2 | 0.12 | 1700 | 22 | 10.6 |
| 3C324-C3 | 0.07 | 641 | 19 | 10.1 |
| SSA22a-aug96D1 | 0.17 | 321 | 37 | 10.1 |
| SSA22a-C11 | 0.08 | 1139 | 18 | 10.3 |
| SSA22a-C15aaThe best-fit ages for marked galaxies, when unconstrained, were older than the age of the universe at the galaxy’s redshift. The best-fit quantities listed for these galaxies reflect the constraint that the age of a galaxy should not be older than the age of the universe. Such a constraint still provides statistically acceptable fits for marked galaxies. | 0.12 | 2000 | 11 | 10.3 |
| SSA22a-C16 | 0.21 | 181 | 109 | 10.3 |
| SSA22a-C36 | 0.17 | 571 | 48 | 10.4 |
| SSA22a-C6bbThe best-fit ages for the marked galaxies, when unconstrained, were younger than . Such young ages are physically implausible, and therefore we restricted the best-fit ages to be at least . The best-fit quantities listed for marked galaxies reflect this constraint, and provide statistically acceptable fits for marked galaxies. | 0.20 | 10 | 204 | 9.3 |
| SSA22a-D14 | -0.01 | 571 | 6 | 9.6 |
| SSA22a-M10bbThe best-fit ages for the marked galaxies, when unconstrained, were younger than . Such young ages are physically implausible, and therefore we restricted the best-fit ages to be at least . The best-fit quantities listed for marked galaxies reflect this constraint, and provide statistically acceptable fits for marked galaxies. | 0.30 | 10 | 212 | 9.3 |
| SSA22a-M14 | 0.15 | 571 | 12 | 9.8 |
| SSA22a-M4 | 0.13 | 321 | 17 | 9.7 |
| SSA22a-D3bbThe best-fit ages for the marked galaxies, when unconstrained, were younger than . Such young ages are physically implausible, and therefore we restricted the best-fit ages to be at least . The best-fit quantities listed for marked galaxies reflect this constraint, and provide statistically acceptable fits for marked galaxies. | 0.29 | 10 | 540 | 9.7 |
| SSA22a-MD3 | 0.24 | 15 | 54 | 8.9 |
| SSA22a-MD4 | 0.14 | 641 | 21 | 10.1 |
| SSA22a-MD40 | 0.21 | 20 | 45 | 9.0 |
| SSA22a-MD46 | 0.01 | 806 | 22 | 10.2 |
| SSA22b-oct96D8aaThe best-fit ages for marked galaxies, when unconstrained, were older than the age of the universe at the galaxy’s redshift. The best-fit quantities listed for these galaxies reflect the constraint that the age of a galaxy should not be older than the age of the universe. Such a constraint still provides statistically acceptable fits for marked galaxies. | 0.06 | 1900 | 32 | 10.8 |
| DSF2237a-C2 | 0.15 | 719 | 76 | 10.7 |
| DSF2237b-C1aaThe best-fit ages for marked galaxies, when unconstrained, were older than the age of the universe at the galaxy’s redshift. The best-fit quantities listed for these galaxies reflect the constraint that the age of a galaxy should not be older than the age of the universe. Such a constraint still provides statistically acceptable fits for marked galaxies. | 0.05 | 2100 | 6 | 10.1 |
| DSF2237b-C26 | 0.05 | 1139 | 9 | 10.0 |
| DSF2237b-D28 | 0.06 | 719 | 10 | 9.9 |
| DSF2237b-D3 | 0.16 | 30 | 46 | 9.1 |
| DSF2237b-D4 | -0.04 | 1278 | 5 | 9.8 |
| DSF2237b-M19 | 0.20 | 161 | 40 | 9.8 |
| DSF2237b-M20 | 0.21 | 227 | 69 | 10.2 |
| DSF2237b-MD10 | 0.29 | 35 | 88 | 9.4 |
| DSF2237b-MD2bbThe best-fit ages for the marked galaxies, when unconstrained, were younger than . Such young ages are physically implausible, and therefore we restricted the best-fit ages to be at least . The best-fit quantities listed for marked galaxies reflect this constraint, and provide statistically acceptable fits for marked galaxies. | 0.39 | 10 | 377 | 9.6 |