Photometric Variability of the Gravitational Lens 0142-100 (UM 673) 111Based on observations made with a) the 60 cm Bochum and the ESO 90 cm Dutch telescopes, at La Silla, Chile, b) the 1.2 m telescope at Kryonerion Observatory, Greece, c) the 1.3 m telescope at Skinakas Observatory, Crete, Greece, and d) the European Space Agency OGS telescope operated on the island of Tenerife by the Instituto de Astrofísica de Canarias in the Spanish Observatorio del Teide of the Instituto de Astrofísica de Canarias.
Abstract
We present the results of a photometric CCD monitoring of the gravitational lens system UM 673, that took place from 1995 to 2000. In total, the doubly-imaged quasar was observed in the -band during 29 photometric nights, using optical telescopes with dimensions in the range 0.6 m to 1.3 m. We detected a significant variability in the total light of the UM 673 system, that is, in the light of the two QSO images plus the lensing galaxy. With respect to the magnitude of the gravitational lens system at its discovery, in 1986, UM 673 was 0.3 magnitude brighter. Furthermore, our December 1996 measurements show that between November 1995 and October 1997 the system became even brighter, reaching a magnitude difference of 0.5 magnitude with respect to its discovery value. We also present magnitudes and colours of seven field stars situated in the vicinity of the lens, based on a 3.5-month monitoring during the year 2000.
1 Introduction
Surdej et al. (1987, 1988) presented UM 673 () as a “new case of gravitational lensing”. The two lensed images originate from a quasar at a redshift , while the lensing galaxy is much closer to the Milky Way (). The angular separation between component and was found to be , while the magnitude of the QSO images and the lens galaxy, at the time of discovery, was , and magnitude, resulting in a total magnitude , with a standard deviation of the order of 0.2 magnitude. They concluded that UM 673 appeared to be one of the most luminous quasars, due to the amplification of image by gravitational lensing.
A spectroscopic study of this gravitational lens was published by Smette et al. (1992), in order to investigate the size of the corresponding clouds. Since they found that the equivalent widths of the lines in the spectra of and are well correlated, they concluded that both light beams actually cross the same clouds. Data from this paper were used by Miralda & Rees (1993) to test their model for the minihalo of the forest for the case of UM 673.
Daulie et al. (1993) observed UM 673 from 1987 to 1993. The observations were performed in the -band, to eliminate any possible contamination originating from the deflecting galaxy. They mainly derived the magnitude difference of the two QSO components, because the observing conditions were of modest quality for most of the nights. The photometric zero point was computed for the nights of 1988 October 31, 1988 December 17 and 1991 October 27. The respective joint magnitude of the two QSO components (no contribution from the galaxy in the -band) was 168, 169 and 167. Their results led to the conclusion that the quasar was not showing any significant variability, but the accuracy of the relative photometry was of the order of 0.05 to 0.2 magnitude. The mean -band magnitude difference was . In a later report based on an ESO Key-program for photometric monitoring of gravitational lenses, Courbin (1995) confirmed the above conclusions.
During a 2-days workshop held in Hambourg, Borgeest (1993) presented some preliminary results from the 1988-1994 monitoring of the lens. The relative photometry of component , with respect to a reference magnitude , was indicating variations of the order of 0.2 magnitude! Unfortunately, nothing more was ever published, and therefore no additional information concerning the reduction method used or the reference magnitude could be found.
In a recently published paper concerning observations of gravitational lenses, Lehár et al. (2000) reported on observations of UM 673 performed in November 1994. The magnitude of the components , , and the galaxy was and respectively, resulting in an integrated magnitude of . The error on the total magnitude is of the order of .
The Sloan Digital Sky Survey () also observed UM 673. Having their own photometric system under preparation (Fukugita et al., 1996), they presented their measurements in a preliminary red filter, designated as (see section 4). Observations in the filter were performed in 1995 November 24 and 1996 December 12. For the first period, Richards et al. (1997) reported , while for the second period Newberg et al. (1999) reported .
We report in this paper about a photometric monitoring through the years 1995-2000, with conclusions to significant variations in the total light of the gravitational lens system. We also present magnitudes and colours of seven field stars, situated in the neighborhood of UM 673. These results, based on data which were accumulated during a period of 3.5 months, consist in a preliminary tool for directly checking the photometric variability of the quasar.
2 Observations
2.1 Sites and instrumentation
During the six-year monitoring period, we performed CCD photometry of UM 673 from four different observing sites. In detail, we observed at:
(a) La Silla (Chile) in November 1995, December 1996 and October 1997. During the first two periods, we used the 0.6 m (f/15) Bochum telescope, in conjunction with the TH7882 CCD (384576, 22 m2 pixels); in 1997, the observations were performed with the 0.9 m Dutch (f/11) telescope and the Tektronix TK512CB CCD (512512, 27 m2 pixels). The above configurations gave a scale of 0.55 pixel-1 and 0.463 pixel-1 , corresponding to a field of view of 3.2 and , respectively. All observations were carried out through the standard Johnson filter. The exposure time for the first, second, and third period was 180, 300 and 1200 sec, respectively.
(b) Kryonerion (Greece) in 1998 October 29, using the 1.2 m (f/13) telescope and the Class I SI502 CCD chip (512512, 24 m2 pixels), resulting in a scale of 0.30 pixel-1 with a field of view of 2.65. The images were taken using the filter, with an integration time of 120 sec per exposure. A dark current subtraction was also included in the preliminary data reduction pipeline.
(c) Tenerife (Spain) in 2000 August 23, using the 1.0 m OGS telescope (f/13.3 at the Ritchey-Chrétien) combined with a Thomson CCD (10241024, 19m2 pixels) giving a scale of 0.3 pixel-1 and a field of view of 5.12. This time the object was observed in both the and filters, with a same exposure time of 120 sec.
(d) Skinakas, Crete (Greece) from 2000 September to 2000 December, using the 1.3 m (f/7.7) Ritchey-Chrétien telescope. The SI003B CCD chip (10241024, 24 m2 pixels) was the detector, giving a scale of 0.5 pixel-1 and a field of view of 8.57. The observations were performed in the standard Johnson and filters, with an exposure time of 240 sec per image.
Most of the nights UM 673 was monitored for many hours and we have obtained, in total, images from 29 clear nights. Individually, the median seeing at the Bochum telescope was 15 and better at the Dutch telescope, around 11. For the night 1998 October 29 the seeing varied between 20 - 30, while on 2000 August 23 it was of sub-arsecond quality. Finally, a value between 08 to 15 was measured for the period September - December 2000. The observational details are summarized in Table 1.
2.2 Photometric standards
No study has ever been performed on neighbouring field stars to check the variability of the quasar, since UM 673 lies in a quasi-empty region of the sky. Therefore, the only possibility for almost all sets of observations (the Skinakas data were the single exception), was to use photometric standard stars (equatorial in our case) to calibrate our measurements (extinction and zero point correction).
We mainly used the blue star HD 12021 for the 1995 - 1998 missions. This photometric standard (HIPPARCOS identifier HIP 9155) has been extensively observed by different observers (Klemola, 1962; Landolt, 1983; Cousins, 1984; Menzies et al., 1991; Grenon, 1992) and its properties are known with high precision. Its equatorial co-ordinates are: and ; Menzies et al. (1991) report: 0.015 and . In 2000 August 23 the calibration was performed by taking exposures at different airmasses of the photometric standard 113191 (Landolt, 1992). For the Skinakas observations, apart from HD 12021 we also used the Geneva photometric standard with identification GEN +7.0093407 (Landolt, 1992). ¿From the photometric standards observed in each mission a mean extinction coefficient and zero point were computed for every (photometric) night, which were then applied to the data of UM 673.
3 Data reduction and results
3.1 Photometry of UM 673
The data reduction was performed by developing scripts in the ESO-MIDAS environment. We applied aperture photometry on our CCD frames in order to study the photometric behavior of the total light of UM 673, which is composed of the two lensed images and the lensing galaxy. We used a circular aperture of 15″ to 185 diameter for this purpose, depending on the observing run conditions (i.e. exposure time, quality of optics, seeing). The “no-man’s-land” was properly set, to avoid contamination from the faint galaxy seen at the south of UM 673. A precise calculation of the sky background near the gravitational lens was performed by using a 25 width ring, external to “no-man’s-land”.
The incorporation of errors, apart from the aperture photometry errors, included the uncertainty due to the extinction correction and the zero point correction, as computed with the help of the photometric standard stars. The reduction of the data showed that the contribution of the first factor on the daily averaged values was practically negligible (of the order of a few milli-magnitude), thanks to the numerous exposures and the good observing conditions. The error due to the zero point and extinction correction was of the order of 0055, 004, 0015, 004 and 0015 for the 1995 to 2000 missions, respectively.
Table 2 contains the -band photometric results. Column 2 presents the daily averages for each run, with their accuracy, composed of all exposures of each night. Column 3 contains the mean value and its standard deviation for each run. Our results, together with the two -band measurements available in the literature (Surdej et al. (1988), Lehár et al. (2000)) are plotted in Fig. 1. The variability of the gravitational lens system is clearly seen in the graph.
3.2 Reference stars in the vicinity of UM 673
Thanks to the relatively large field of view of the configuration of the Skinakas 1.3 m telescope, it was possible to perform aperture photometry on ten field stars in the neighborhood of UM 673, which were present in the majority of our frames. Although almost all of them are fainter than the lens, an optimized combination of several factors (i.e. photometric conditions, high quality telescope optics, precise tracking by means of an autoguider) resulted in a large set of good quality data (81 frames in and 60 frames in , obtained during a period of 3.5 months), from which significant information on these field stars could be extracted.
The variability of the field stars was checked by properly co-adding all the frames of the given night and then performing aperture photometry on them. This operation gave a set of eight frames per filter. For every frame we computed the magnitude difference, , of the star with respect to the star and finally obtained a mean magnitude difference, , for every pair of stars in the whole data set. The results obtained from the differential photometry showed that for most cases the mean errors in the magnitude differences were between 0.01-0.03 magnitude, except for three stars. Therefore, we finally decided to reject them, and to use the rest for checking the variability of the lens.
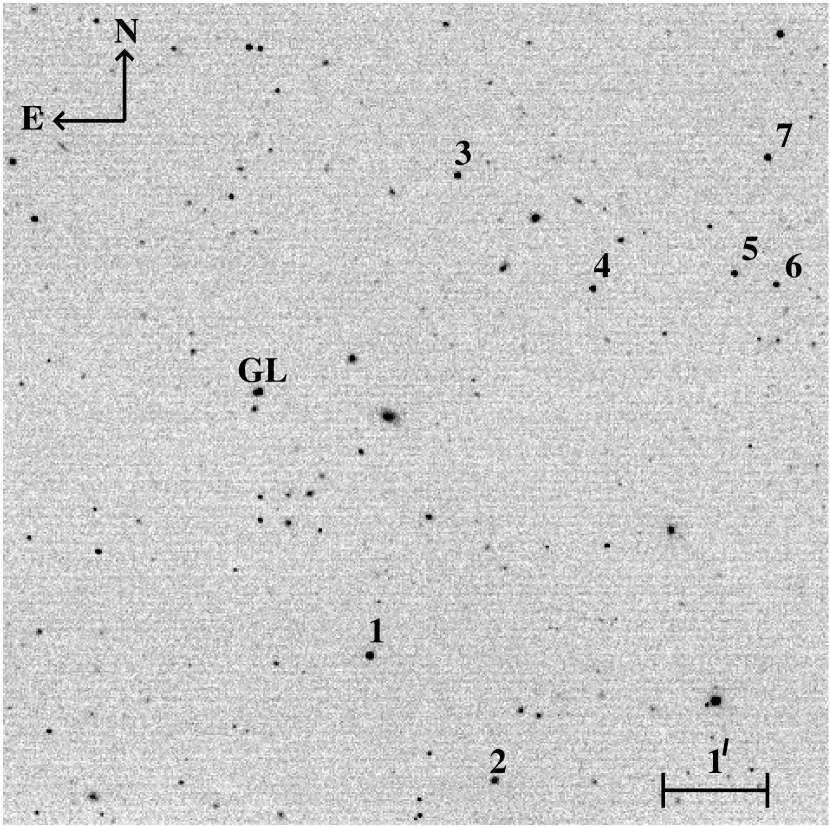
A finding chart with the identification of the field stars is given in Fig. 2. By using the same photometric standards that were used for the lens, we performed a zero-point and extinction correction, converting the instrumental values to and magnitudes. Second order extinction correction and colour transformation were not performed. We also performed a preliminary astrometric identification with the help of the software, developed by E. Downey (2000)111 - An Interactive Astronomical Ephemeris Program for Windows is available at http://www.ClearSkyInstitute.com/xephem. By correlating our results with the co-ordinates presented in Newberg et al. (1999), we identified the seven field stars. Table 3 lists the RA-Dec co-ordinates of the reference stars, their magnitude and colour, including errors associated with the determination of the instrumental magnitudes.
4 Discussion on the variability of the lens
Although it is approximately fifteen years since the discovery of the lens, UM 673 has hardly been observed. Consequently, the very few existing measurements can not provide a clear view concerning the photometric behavior of the gravitational lens system before 1995.
The closest (in time) observations to our measurements are those performed by the , with a photometric system consistsing of five passbands ( and ). Since the definition of the system is still under progress, the observations are performed using filters which are similar but not identical to the final ones, designated as and .
UM 673 was observed by the group in 1995 November 24, and in 1996 December 12. For the first period, Richards et al. (1997) report , while for the second period Newberg et al. (1999) report and , respectively. The transformation of the measurements to the Johnson and Cousins photometric system is a complicated task (cf Krisciunas et al. (1998) and Newberg et al. (1999)) and, as a consequence, a direct comparison of the with our measurements is not possible. Nevertheless, since both we and the have data obtained during the same periods (November 1995 and December 1996), we tried to derive some additional conclusions on the variability of the lens by comparing the observations obtained by in the two different periods.
The comparison of the 1995 and 1996 measurements yielded ambiguous results, since the decrease of the magnitude shows that the lens became brighter, while a comparison of the and measurements gave the opposite conclusion. As it is mentioned in Newberg et al. (1999), the main task of the 1996 observations was to explore the detection of QSOs, based on colour selection criteria. For this reason, observations were performed even if the conditions were non-photometric. As a consequence, we conclude that a comparison of the 1995 and 1996 measurements does not give any supplementary information on the variability of the quasar.
The instrumentation used during our 1995-1996 missions did not allow us any additional exploitation of the data (e.g. profile fitting of the QSO components). Hence, both a microlensing scenario and an internal variability of the quasar could equivalently explain the brightening of UM 673. However, our measurements, which are characterized by a photometric precision of the order of a few hundredths of a magnitude, clearly demonstrate the 1996 peak in brightness. At the same time, they indicate that since 1997 the quasar seems to be in a less variable state, but the situation of a quiet phase can not be ruled out.
5 Conclusions
We have been monitoring the gravitational lens UM 673 through the years 1995 - 2000. To measure the total light of the lens (component + component + lensing galaxy) we constrained ourselves to aperture photometry. The numerous observations obtained during each run (several hours per night), allowed us to reach a photometric precision of a few hundredths of a magnitude. The photometric calibration was performed with the help of several photometric standard stars. Although the observations were performed using several configurations, all measurements agree with the conclusion that the QSO has undergone a long term variability, that corresponds to a brightening in the total light of the system of 0.3 magnitude in respect to its discovery value, in 1987. From the agreement between the 1995 and 1997 measurements we see that this variability had its peak (additional 02 brightening) in 1996.
The magnitude of UM 673 we derived was 16.300.02 in November 1995, 16.080.01 in December 1996, 16.300.01 in October 1997, 16.230.05 in October 1998 and 16.340.01 for the last quarter of 2000 (Fig. 1).
Thanks to the optimized configuration of the Skinakas observatory, we managed to have and measurements of seven field stars in the vicinity of UM 673 during the period September - December 2000. Although more observations are needed for a better knowledge about the stability of these stars over a longer time-basis, the photometric reduction showed no significant variability at the level 002 - 003.
The measurements obtained after 1996 seem to form a plateau at around , indicating that since 1997 the quasar seems to be in a less variable, or even quiet, state. Nevertheless, we propose a systematic monitoring of UM 673 at a rate of a few images at fixed time intervals. With the help of the reference stars, differential photometry would directly show any new variability in the system. We also suggest new measurements with instruments allowing analysis of the spectra of the components for comparison with earlier ones, and photometric observations to derive the fluxes of the two QSO components.
The authors would like to acknowledge Prof. J. Surdej, for his useful comments. Finally, it is a pleasure to thank the referee, Dr. R. Schild, for his constructive suggestions.
This research (D.S.) was mainly carried out in the framework of the projects “Service Centres and Research Networks”, and “Pôles d’Attraction Interuniversitaires” P4/05, both initiated and financed by the Belgian Federal Scientific Services (DWTC/SSTC). T.N. acknowledges support from the project ”Chercheurs Supplémentaires aux Etablissements Scientifiques Federaux”. P.B. acknowledges support from a “P.EN.E.D.” program of the General Secretariat of Research and Technology of Greece, and the Royal Observatory of Belgium for financing his visit in Brussels.
Skinakas Observatory is a collaborative project of the University of Crete, the Foundation for Research and Technology-Hellas and the Max-Planck-Institut für Extraterrestrische Physik.
References
- Borgeest (1993) Borgeest, U. & Schramm, K.-J. 1993, in 1st Megaphot Workshop, ed. U. Borgeest, K.-J. Schramm, & J. von Linde (Hambourg: U. Grothe KG), 105
- Courbin (1995) Courbin, F. 1995, Highlights of Astronomy Vol. 10, p. 659
- Cousins (1984) Cousins, A.W 1984, SAAO Circul. No 8, 69-84
- Daulie et al. (1993) Daulie, G., Hainaut, O., Hutsmékers, D., Magain, P., Remy, M., Smette, A., Surdej, J. & Van Drom, E. 1993, in 31st Liège International Astrophysical Colloquium, Gravitational Lenses in the Universe, ed. Surdej, J., Fraipont-Caro, D., Gosset, E., et al., (Liège: Univ. of Liège Press), 181
- Fukugita et al. (1996) Fukugita, M., Ichikawa, T., Gunn, J.E., Doi, M., Shimasaku, K., & Schneider, D.P 1996, AJ, 111, 1748
- Grenon (1992) Grenon, M. 1992, private communication
- Klemola (1962) Klemola, A.R. 1962, AJ, 67, 740
- Krisciunas et al. (1998) Krisciunas, K., Margon, B., & Szkody, P. 1998, PASP, 110, 1342
- Landolt (1983) Landolt, A.U. 1983, AJ, 88, 439
- Landolt (1992) Landolt, A.U. 1992, AJ, 104, 340
- Lehár et al. (2000) Lehár, J. et al. 2000, ApJ, 536, 584
- Menzies et al. (1991) Menzies, J., Marang, F., Laing, J., Coulson, I.M., & Engelbrecht, C.A. 1991, MNRAS, 248, 642
- Miralda & Rees (1993) Miralda-Escudé, J., & Rees, M. 1993, MNRAS, 260, 617
- Newberg et al. (1999) Newberg H.J., Richards G.T., Richmond M., & Fan X. 1999, ApJS, 123, 377
- Richards et al. (1997) Richards, G.T, Yanny, B., Annis, J., Newberg, H.J., McKay, T.A., York, D.G., & Fan, X. 1997, PASP, 109, 39
- Smette et al. (1992) Smette, A., Surdej, J., Shaver, P.A., Foltz, C.B., Chaffee, F.H., Weymann, R.J., Williams, R.E., & Magain, P. 1992, AJ, 389, 39
- Surdej et al. (1988) Surdej, J. et al. 1988, A&A, 198, 49
- Surdej et al. (1987) Surdej, J. et al. 1987, Nature, 329, 695

| Date | Instrument | Detector | Filter | Exposure time |
|---|---|---|---|---|
| (telescope) | (CCD type) | (sec) | ||
| 1995 Nov 03/09-10 | 0.6 m Bochum | TH 7882 | R | 180 |
| 1996 Dec 09-19 | 0.6 m Bochum | TH 7882 | R | 300 |
| 1997 Oct 22-26 | 0.9 m Dutch | Tektronix TK512CB | R | 1200 |
| 1998 Oct 29 | 1.2 m Kryonerion | Class I SI502 | R | 120 |
| 2000 Aug 23 | 1.0 m OGS | Thomson | R | 120 |
| 2000 Sep 03/11/18 | 1.3 m Skinakas | Tektronix SI003B | R | 240 |
| 2000 Nov 02-03/23 | 1.3 m Skinakas | Tektronix SI003B | R | 240 |
| 2000 Dec 14-15 | 1.3 m Skinakas | Tektronix SI003B | R | 240 |
| Date | ||
|---|---|---|
| 1995 Nov 03 | 16.27 0.06 | |
| 1995 Nov 09 | 16.31 0.06 | 16.30 0.02 |
| 1995 Nov 10 | 16.32 0.06 | |
| 1996 Dec 09 | 16.11 0.05 | |
| 1996 Dec 10 | 16.12 0.05 | |
| 1996 Dec 11 | 16.10 0.05 | |
| 1996 Dec 12 | 16.09 0.05 | |
| 1996 Dec 13 | 16.05 0.05 | |
| 1996 Dec 14 | 16.07 0.05 | 16.08 0.01 |
| 1996 Dec 15 | 16.08 0.05 | |
| 1996 Dec 16 | 16.11 0.05 | |
| 1996 Dec 17 | 16.07 0.05 | |
| 1996 Dec 18 | 16.08 0.05 | |
| 1996 Dec 19 | 16.04 0.05 | |
| 1997 Oct 22 | 16.29 0.02 | |
| 1997 Oct 23 | 16.30 0.02 | |
| 1997 Oct 24 | 16.30 0.02 | 16.30 0.01 |
| 1997 Oct 25 | 16.30 0.02 | |
| 1997 Oct 26 | 16.29 0.02 | |
| 1998 Oct 29 | 16.23 0.05 | 16.23 0.05 |
| 2000 Aug 23 | 16.30 0.02 | |
| 2000 Sep 03 | 16.34 0.02 | |
| 2000 Sep 11 | 16.35 0.02 | |
| 2000 Sep 18 | 16.31 0.03 | |
| 2000 Nov 02 | 16.35 0.02 | 16.34 0.01 |
| 2000 Nov 03 | 16.34 0.02 | |
| 2000 Nov 23 | 16.35 0.02 | |
| 2000 Dec 14 | 16.34 0.02 | |
| 2000 Dec 15 | 16.35 0.02 |
| No of star | RA (2000) Dec (2000) | ||
|---|---|---|---|
| (hms)() | (mag) | (mag) | |
| 1 | 01 45 12.05 09 47 49 | 15.92 0.02 | 0.51 0.03 |
| 2 | 01 45 07.15 09 49 01 | 16.61 0.02 | 0.94 0.03 |
| 3 | 01 45 08.73 09 43 13 | 17.12 0.02 | 0.33 0.03 |
| 4 | 01 45 03.43 09 44 18 | 17.37 0.02 | 0.84 0.04 |
| 5 | 01 44 57.90 09 44 09 | 17.42 0.02 | 0.84 0.04 |
| 6 | 01 44 56.26 09 44 15 | 17.80 0.02 | 0.42 0.04 |
| 7 | 01 44 56.63 09 43 02 | 16.75 0.03 | 0.38 0.04 |