Ionized Gas in Spheroids: The SAURON Survey
Abstract
Early results are reported from the SAURON survey of the kinematics and stellar populations of nearby cluster and field E, S0, and Sa galaxies. We present maps of the H and [OIII] emission-line distribution and kinematics for NGC 5813 and NGC 7742.
1. Introduction
Studies with HST have revealed a variety of structures in the nuclei of nearby elliptical galaxies: stellar and/or gaseous disks, massive central black holes, unresolved nuclear spikes, and kinematically decoupled structures. Progress towards a better understanding of the properties of nearby galaxies requires a systematic investigation of the large-scale (ground-based) kinematics and line-strengths of a representative sample. Traditionally such studies relied on long-slit spectroscopy along at most a few position angles, but this is insufficient to unravel the rich internal kinematics of spheroids. For this reason we built the panoramic integral-field spectrograph SAURON for the William Herschel Telescope.
The design of SAURON is similar to that of the prototype integral-field spectrograph TIGER and its successor OASIS built for the CFHT (Bacon et al. 1995, 2000). The field of view is with spatial sampling of . SAURON provides 1577 spectra in the wavelength range from 4810 to 5350Å. Of these, 146 are sky spectra away from the main field. A complete description of the design and construction of SAURON, and the corresponding data reduction software is given in Bacon et al. (2001).
We are carrying out a systematic study of nearby cluster and field E, S0 and Sa galaxies. The aim is to determine the intrinsic shapes of the galaxies, their orbital structure, the mass-to-light ratio as a function of radius, the age and metallicity of the stellar components, the dynamical role of decoupled cores and nuclear black holes, the relation between the stellar (and gaseous) kinematics, and the star formation history. Here we illustrate the variety of gas morphologies and kinematics displayed by nearby spheroids by presenting SAURON maps of the H and [OIII] emission-line gas for one elliptical and one spiral galaxy of our sample, NGC 5813 and NGC 7742, respectively.
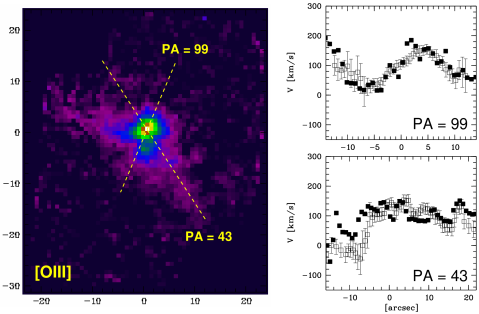
2. The giant elliptical galaxy NGC 5813
NGC 5813 is an E1-2 galaxy located in the Virgo-Libra Cloud (Tully 1988) with absolute magnitude . It contains a weak unresolved radio continuum source (Birkinshaw & Davies 1985; Krajnovic & Jaffe, in prep.). It has typical LINER emission-line ratios, but no X-ray emission (Ho, Filippenko & Sargent 1997). HST imaging shows dust filaments inside the kinematically decoupled core (Carollo et al. 1997). Ground-based H+[NII] narrow-band imaging reveals an elongated ionized gas distribution (Caon et al. 2000).
We observed NGC 5813 on March 29 and 30 and April 4, 2000. The seeing was 1′′ on the first two nights and on the last. Figure 1 shows the total intensity of the [OIII] emission, together with a comparison of the SAURON data and the Caon et al. (2000) long-slit data along two position angles.111Colour versions of Figures 1 and 2 can be found in de Zeeuw et al. (2001). The map is a mosaic obtained by merging two SAURON pointings which overlap on the nucleus. The morphology of the [OIII] emission exhibits complex filamentary structure, most likely not yet in equilibrium with the potential of the central region, despite the relatively short crossing time of 107 yr. This is confirmed by the disorganized SAURON velocity field (see also de Zeeuw et al. 2001).
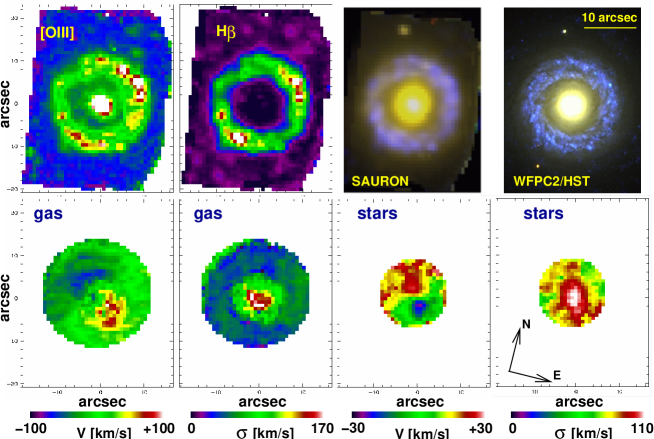
3. Counter-rotating gas in the spiral galaxy NGC 7742
NGC 7742 is a nearly face-on spiral galaxy classified as S(r)b in the RC3 (), and it is an example of the latest spirals included in our sample. The galaxy contains an inner stellar ring with bright HII regions, flocculent spiral arms, a significant amount of neutral hydrogen, molecular gas, and dust (de Vaucouleurs & Buta 1980; Roberts et al. 1991; Wozniak et al. 1995). The nucleus is classified as a transition LINER/HII object (Ho et al. 1997).
Figure 2 displays SAURON maps based on a single pointing taken on October 13, 1999, with a seeing of . Most of the H and [OIII] emission is confined to the ring of star formation surrounding the bulge. H is dominant everywhere in the ring, and the ratio [OIII]/H ranges from 0.06 to 0.14. In the center the ratio is larger than 20. Figure 2 also shows a colour-coded SAURON reconstructed image and a similar image based on WFPC2 exposures. The SAURON map does not have the spatial resolution of HST, but it does demonstrate that our analysis technique is capable of providing accurate emission-line maps.
The bottom panels of Figure 2 display the mean velocity and velocity dispersion fields of the gas and the stars in NGC 7742. The galaxy is observed close to face-on, and the amplitude of the velocities is accordingly modest. The zero-velocity directions are well-defined, and their position angles are consistent with each other (PA= for the stars and PA= for the gas). However, the gas and stars rotate in opposite sense. This suggests a merger or an accretion event in the history of the galaxy.
4. Conclusion
We built SAURON to efficiently measure the stellar and gaseous kinematics and linestrength distributions of early-type galaxies. The two examples shown here illustrate SAURON’s ability to measure the two-dimensional emission-line distributions. The results presented in de Zeeuw et al. (2001) show that early-type galaxies display a diversity of line-strength distributions and kinematical structures much richer than previously assumed. Integral-field spectroscopy is a mature technique, superior to long-slit studies because of the fundamental advantage of complete spatial coverage.
The detailed SAURON maps, together with high spatial resolution data from OASIS and HST, will be used for modeling of the dynamics by means of Schwarzschild’s (1979) orbit superposition method. When combined with the constraints on the stellar populations derived from the line-strength distributions this will provide much needed insight into the fundamental properties of early-type galaxies and bulges.
It is a pleasure to thank the ING staff for enthusiastic and competent support on La Palma.
References
Bacon R., et al. 1995, A&AS, 113, 347
Bacon R., Emsellem E., Copin Y., Monnet G., 2000, in Imaging the Universe in Three Dimensions, eds W. van Breugel & J. Bland-Hawthorn, ASP Conf. Ser., 195, 173
Bacon R. et al. 2001, MNRAS, in press (astro-ph/0103451)
Birkinshaw M., Davies R.L. 1985, ApJ, 291, 32
Caon N., Macchetto F.D., Pastoriza M., 2000, ApJS, 127, 39
Carollo C.M., Franx M., Illingworth G.D., Forbes D., 1997, ApJ, 481, 710
Ho L.C., Filippenko A.V., Sargent W.L.W., 1997, APJS, 112, 315
Roberts M., Hogg D., Bregman J., Forman W., Jones C., 1991, ApJS, 75, 751
Schwarzschild M., 1979, ApJ, 288, L33
Tully R.B., 1988, Nearby Galaxies Catalogue (Cambridge University Press)
Wozniak H., Friedli D., Martinet L., Martin P., Bratschi P., 1995, A&AS, 11, 115
de Vaucouleurs G., Buta R., 1980, AJ, 85, 637
de Zeeuw P.T. et al. 2001, MNRAS, submitted