MSX, 2MASS, and the LMC: A Combined Near and Mid Infrared View
Abstract
The Large Magellanic Cloud (LMC) has been observed by both the Midcourse Space Experiment (MSX) in the mid-infrared and the Two Micron All Sky Survey (2MASS) in the near-infrared. We have performed a cross-correlation of the 1806 MSX catalog sources and nearly 1.4 million 2MASS catalogued point and extended sources and find 1664 matches. Using the available color information, we identify a number of stellar populations and nebulae, including main sequence stars, giant stars, red supergiants, carbon- and oxygen-rich asymptotic giant branch (AGB) stars, planetary nebulae, H II regions, and other dusty objects likely associated with early-type stars. 731 of these sources have no previous identification. We compile a listing of all objects, which includes photometry and astrometry. The 8.3 m MSX sensitivity is the limiting factor for object detection: only the brighter red objects, specifically the red supergiants, AGB stars, planetary nebulae and HII regions, are detected in the LMC. The remaining objects are likely in the Galactic foreground. The spatial distribution of the infrared LMC sources may contribute to understanding stellar formation and evolution and the overall galactic evolution. We demonstrate that a combined mid- and near-infrared photometric baseline provides a powerful means of identifying new objects in the LMC for future ground-based and space-based follow-up observations.
1 Introduction
Among our nearest galactic neighbors, the Magellanic Clouds, with their relative proximity, low line-of-sight extinction, lower mean metallicity, and large numbers of stellar populations, can provide us with vital information about our own Milky Way and galactic evolution in general. A multitude of studies at a large variety of wavelengths have been conducted on the Clouds for decades. Large-scale optical surveys, such as the Magellanic Clouds Survey (Zaritsky, Harris, & Thompson 1997), are compiling results on a large number of stellar objects and nebulae. To obtain a view particularly of the post-main-sequence stellar populations in these galaxies one needs to turn to the infrared (IR). Two recent infrared surveys have provided a wealth of new data on the Large Magellanic Cloud (LMC) in the wavelength regime from 1.2 to 25 m. At near-IR wavelengths, the Two Micron All Sky Survey (2MASS) has detected nearly 2 million stars in the area also surveyed by the Midcourse Space Experiment (MSX) mid-IR survey.
MSX provides an improvement over previous mapping of the LMC in the mid-IR by the US/Netherlands/UK IR Astronomical Satellite (IRAS). The smaller detector footprint of the MSX detector arrays, as compared to IRAS, avoids the confusion problems encountered by the IRAS survey in some areas of the LMC, and allows a more precise determination of source position, which is of great importance when attempting to compare these mid-IR observations with the 2MASS near-IR observations. The MSX A band [6.8 – 10.8 m] is also more sensitive than the IRAS 12 m band [7 – 15 m], so therefore we can catalog 1806 sources to a limiting magnitude 7.5. The utility of mid-IR observations in identifying post-main-sequence stars in the LMC was demonstrated by IRAS, which, with a detection limit of magnitude , detected several hundred extreme evolved stars (such as OH/IR stars) in the LMC. At the distance modulus of the LMC, only the extremely red objects at the brighter end of the mid-IR magnitude scale could be detected by IRAS. By extending the LMC mid-IR survey nearly two magnitudes fainter we expect to see some of the less extreme members of the LMC giant branch populations and other objects. 2MASS observations, extending to mag at a signal-to-noise ratio (SNR) of 10, have detected and yielded information on first-ascent red giant branch, asymptotic giant branch (AGB), and obscured AGB populations of the LMC (Nikolaev & Weinberg 2000). These red populations have also been inventoried and analyzed using the DENIS point source catalogs by Cioni et al. (2000) and other papers by the DENIS team. By combining the near-IR and mid-IR data, we greatly expand the color baseline and acquire additional insight into the AGB and other red stars in the LMC, as well as discovering objects with unusual IR excesses. In this paper we present the results of our merging of the MSX and 2MASS LMC datasets and discuss the nature of the various IR-bright sources in that galaxy, many of which are previously unidentified. This study provides a foundation for future studies of the LMC by the SIRTF and SOFIA missions.
2 Observations
2.1 The MSX LMC Observations
Details on the MSX spacecraft and experiments can be found in Price et al. (2001). The IR telescope on MSX, known as SPIRIT III, is a 35-cm clear aperture off-axis telescope with five line-scanned IR focal-plane arrays and an aperture-shared interferometer. The entire system was cooled by a single solid H2 cryostat. The Si:As BiB arrays had eight columns of detectors, each consisting of 192 rows of square pixels. A block consisting of half the columns in each array was offset by half a pixel, providing Nyquist sampling in the cross-scan direction. The system parameters are presented in Table 1.
In addition to the primary Galactic Plane survey experiments (Price et al. 2001), MSX experiments also collected IR imaging radiometer data on selected high-density regions, including the LMC and the SMC. The selected area scans were executed at a slower scan rate than the Galactic Plane and IRAS Gap long scans (0.05∘ s-1 vs. 0.125∘ s-1), resulting in a slight increase in single scan sensitivity (cf. Table 1 in this paper with Egan et al. 1999, Table 1). The sensitivity of band B, which was designed for experiments looking into the Earth’s atmosphere, is such that no useful data were obtained for the LMC. The MSX LMC observations covered 100 square degrees, centered on , (J2000). The full dataset includes six separate data collection events, interleaved to provide a minimum of four redundant passes over each area in the field.
The final data products for the LMC include FITS format images and a source catalog. Both products are available through the NASA/IPAC IR Science Archive (IRSA)111http://irsa.ipac.caltech.edu.. The image data includes full resolution image plates and a large-format full-resolution mosaic. Images were constructed using the method described in Price et al. (2001), after pointing refinement, dark current correction, and artifact mitigation have been applied. The large-format mosaics of the galaxy are pixel FITS images in MSX bands A, C, D, and E, covering the full 100 square degree area surveyed by MSX. The mosaics use 36″ sampling, with the resolution of the images degraded to 72″. The full resolution image plates consist of 25 pixel, or , FITS images, in each band. These are sampled on 6″ centers. The actual resolution of these data is 20″. The image products combine all of the available scans over a given area. For four scans, this results in a sensitivity increase of a factor of two in SNR over the single scan survey data.
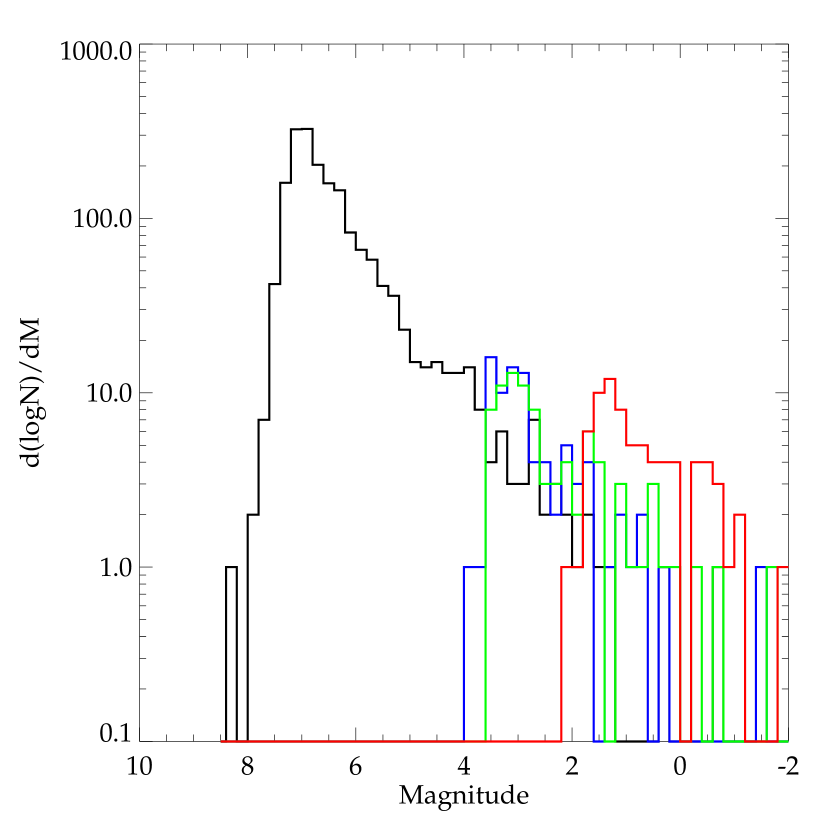
A preliminary version of the LMC point source catalog, produced to support the WIRE mission PV phase, was released in 1999 through IRSA. It is this catalog on which the analysis presented in this paper is based. The point source processing was identical to that described for the Galactic Plane and also the Areas Missed By IRAS survey MSX Point Source Catalogs, described by Egan et al. (1999). Sources were extracted from individual scan legs, and redundant scans were used to confirm point source detections and increase the reliability of the catalog. In Figure 1 we show the number of sources as a function of magnitude ( vs. mag). Here, we use the conversion to zero magnitude for a flux density of 58.49 Jy in band A, 26.51 Jy in band C, 18.29 Jy in band D, and 8.75 Jy in band E (Cohen, Hammersley & Egan 2000). Version 1 of the LMC point source catalog contains 1806 sources. Due to the fact that MSX band A was approximately 10 times more sensitive than the other bands, most sources are detected only in this band. Given the increased sensitivity due to coaddition of the image data, sources up to a factor of two fainter will be detectable in the images for all bands. Version 2 of the MSX Point Source Catalog (PSC), which will contain point source extractions from all of the MSX IR data collections, including the LMC, will extract point sources from the co-added images in bands C, D, and E, using the prior knowledge of the band A source positions. This will yield a much higher fraction of sources with multi-color MSX mid-IR data. This catalog is currently in preparation.
We have cross-referenced the MSX LMC sources with the catalog produced by Schwering (1989) and Schwering & Israel (1990) from the IRAS Additional Observation (AO) program scans. These scans covered a smaller area than the MSX survey (approximately 70 square degrees). The goal of the IRAS AO survey catalog was to provide a deep (magnitude 6, or 150–200 mJy, at 12 m) IR survey of the LMC. The scans yielded a catalog containing 1823 sources (802 of which were not contained in the IRAS Point Source Catalog). Of the Schwering & Israel sources, 1575 have reported 12 m fluxes and 1578 have 25 m measurements. We found that only 47% of the IRAS sources correspond with MSX sources. Overlaying the IRAS sources on the A-band mosaic of the LMC, we find that only 71% of the cataloged 12 m sources correspond to emission detected at 8.3 m by MSX.
The sources not seen in the MSX 8.3 m observations tend to be associated with Schwering & Israel sources having uncertain flux values at 12 m (denoted by a colon in their tabular data). More than half (56%) of these sources do not have MSX counterparts (either point sources, extended emission, or multiple MSX sources) vs. only of those with IRAS 12 m flux values with which Schwering & Israel were more confident. Plotting the Schwering & Israel sources on an IRAS vs. color-magnitude diagram, the sources not seen in the MSX 8.3 m data are found to be the faintest ( Jy) and reddest () sources on the diagram. Of the total 801 Schwering & Israel sources in this quadrant of the color-magnitude diagram, 610 (254 with uncertain 12 m flux listings) are not seen at 8.3 m. While some of the MSX non-detections may indicate spurious sources in the Schwering & Israel catalog, it appears that most are likely cases of cool, far-IR emission sources which are below the detection limit in the MSX 8.3 m band.
2.2 The 2MASS LMC Observations
2MASS has surveyed the entire sky in the near-IR from Mt. Hopkins, AZ, and the Cerro Tololo InterAmerican Observatory (CTIO). The cameras on the two automated 1.3-m telescopes observed simultaneously in three channels, (1.25 m), (1.65 m), and (2.17 m), using HgCdTe detector arrays, sampling the sky in strips. Coadded images, with 7.8-s total integration, are produced from six dithered frames, after rebinning to 1′′ pixels. The 2MASS Production Processing System provides final Atlas Images and source extractions with precise photometric calibration and astrometric positions, with 10 sensitivities of 15.8 mag at , 15.1 at , and 14.3 at .
The LMC was observed as part of routine nightly southern operations in 1998 – 2000. Production processing resulted in nearly 7.1 million source extractions for the LMC in a working point source database, which also includes image artifacts, such as filter glints and diffraction spikes from bright stars, as well as confused objects, detection upper limits, and multiple source apparitions due to scan overlaps. Nikolaev & Weinberg (2000) discuss the results of analysis on the working point source database for the LMC. Subsequently, artifacts, which can be well-characterized and identified, were eliminated, and duplicate sources were removed, as part of the catalog generation process for the 2MASS Second Incremental Data Release (2IDR) in 2000 March. The 2IDR contains 47% of the sky, including most of the observed field of the LMC, which is comprised of 1,399,637 point sources and 12311 extended sources.
Two relatively small sections of the galaxy (15.6 and 14.8 square degrees, respectively) were not part of the 2IDR. The first section, spanning approximately right ascension to and declination ° to 66° (J2000), coincidentally, had the highest source density. The second, covering to and ° to 64° (J2000), is somewhat less dense. Data for these sections were drawn from the working point source database, and therefore may be contaminated by artifacts and confused and duplicate sources. The combined released and unreleased datasets form the basis of our near-IR/mid-IR point source cross-correlation and subsequent analysis. We have also cross-correlated the MSX PSC with the 2MASS extended source catalog (XSC), drawn from both the 2IDR and the working database for the two strips of unreleased data.
3 Analysis
3.1 Correlating The Observations
The MSX and 2MASS catalogs have been cross-referenced using a simple positional correlation, requiring the position error goodness-of-fit statistic, , to be less than , where
For a two-dimensional normal error distribution, we expect 99.99 of the source matches to be found within this limit. Figure 2 shows the distribution of values for matches between the MSX catalog and the 2IDR. The figure also shows the cumulative fraction of source matches as a function of , which for a truly normal distribution of errors would yield 68.3% of sources with , 95.4% with , and 99.73 with . The distribution of the statistic found for this dataset is quite close to this, giving us confidence that most of the position matches are true. The driving uncertainty in these matches is that of the MSX position, which is of order in both in-scan ( and cross-scan () directions. (This is somewhat better than the quoted uncertainties in the MSX PSC Version 1.2 [Egan et al. 1999], since the subsequent LMC pointing refinement used 2MASS and MSX IR Astrometric Catalog [Egan & Price 1996] stars, which yielded more pointing update stars per square degree for the LMC refinement vs. the Galactic Plane boresight pointing refinement, and reduced the MSX LMC positional uncertainties.) 2MASS positional uncertainties222See Cutri et al. (2001), the 2MASS 2IDR Explanatory Supplement, at http://www.ipac.caltech.edu/2mass/releases/second/doc/explsup.html. are generally on the order of . Given the high source density, especially in the LMC bar, many MSX sources had multiple 2MASS matches with , though the percentage is smaller than was expected. In these cases, we have retained the match which had the smaller positional error, except in a dozen cases for which both 2MASS sources were within 1 (rms) of the MSX position. In these cases, the redder (in ) of the 2MASS sources was chosen to be the true match.
Of the 1806 MSX catalog sources, 1664 had positional matches with 2MASS point sources. Of these, 1488 were in the area covered in the 2IDR, and 176 are in the unreleased regions. In Tables 2 and 3 we list the first 45 sources from both the released and unreleased 2MASS datasets, respectively. (The full list of sources is electronically available from the CDS database.) In both tables we give the 2MASS source positions and magnitudes, the MSX A-band magnitude, and the source type based on our cross-correlated MSX-2MASS colors (see below).
Of the 1664 matched sources, 1036 had unique 2MASS matches (i.e., only one 2MASS source fell within ). Most of the multiply matched sources were fairly clear-cut cases, with one match of the pair lying within and the other with . 142 MSX sources remained unmatched with 2MASS point sources and are listed in Table 4. We have also run the MSX PSC against the SIMBAD database, with a match radius (). These cross-references have also been included in Tables 2 – 4.
3.2 Colors of Cross-Identified Sources
Most (1576 in number) of the cross-identified sources have measurements in at least four bands, the 2MASS , , and the MSX A band. These bands can be used to identify six color axes (, , , , , ). We have used a variant of a “fuzzy clustering” algorithm (see, e.g., Höppner et al. 1999) for -dimensional data to find clusterings of sources with similar color characteristics. These clusters identify specific populations of celestial objects for those populations that have unique colors. Processing first only the 1488 matched 2IDR objects through the algorithm (since they are expected to be far less contaminated by artifacts and multiple apparitions than is true for the unreleased data), we find 19 distinct groups. Some of the groups are subgroups of a parent type, e.g., the method distinguishes between oxygen-rich AGB stars of spectral types both earlier and later than subtype M6. We have combined these subgroups under their main group type and come up with a total of 11 major categories.
We have assigned categories for all matched sources and include the source types in Tables 2 – 4. We note that 14% (228) of the stars are not assigned candidate types, either because they fall between the chosen category boundaries (true for 160 sources) or are saturated in one or more 2MASS bands.
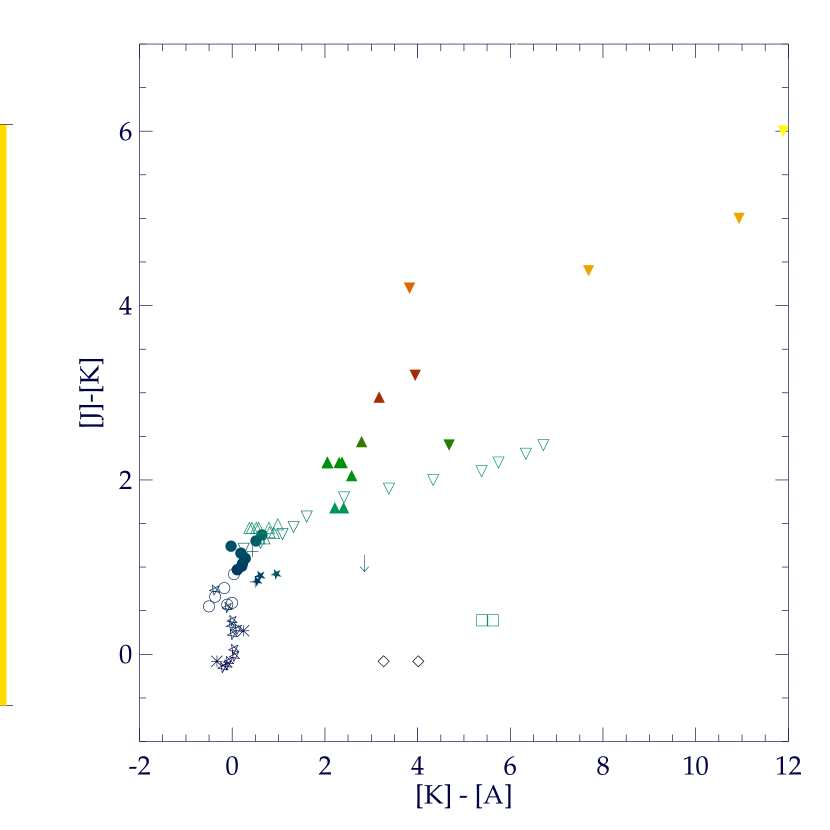
Six-dimensional data is difficult to represent; additionally, it is not clear that all of the colors yield completely independent information. To simplify the analysis we have chosen the three axes which most clearly illustrate the object type distinctions. Figure 3 is a vs. A color-color diagram, where the colors of the points represents the color. Photometric uncertainties (rms) in each color are also shown. The vs. A color plane shows several obvious groupings, while the color is able to further separate the other groups. To identify the sources contained in the cluster-analysis categories, we have examined the colors expected for the various source types by the Wainscoat et al. (1992) “SKY” model of the Galaxy and compared these to the observed colors. Absolute magnitudes in the MSX A band were supplied for each of the 87 objects by M. Cohen (priv. comm.). Figure 4 is the model analog to Figure 3.
The 11 categories occupying the three-axis color-color diagram in Figure 3 and the number of sources assigned to each group, are as follows:
-
•
I - Early dwarfs. These stars occupy the region defined by A, . There are 50 candidates in the sample.
-
•
II - Late dwarfs, defined by A, . Our sample contains 19 candidates.
-
•
III - Early giants (primarily G III and K III spectral types), occupying the region of the diagram, A, . There are 251 objects in this category.
-
•
IV - Late giants. The M III types are contained in the region bounded by A, . There are 176 candidates.
Category V contains a mixture of several types of stars. From Wainscoat et al. (1992) we see that the colors of red supergiants (RSGs) and early oxygen-rich and carbon-rich AGB stars are all quite similar. (By “early” we mean those stars with relatively little mass loss or obscuration of the central star at visible and near-IR wavelengths). To a lesser degree, we then use the color to distinguish between these objects, the RSGs being the bluest objects among this group on this axis, and the carbon stars being the reddest. However, we do not claim that these designations are exact. In fact, even using all six color axes, some confusion still exists between some of these sources. The designations below try to make the best separation between subtypes in this category:
-
•
Va - RSGs, enclosed by , , and A . We find 99 likely candidates.
-
•
Vb - Early oxygen-rich AGB stars, within the color ranges, , , and . We find 61 candidates.
-
•
Vc - Early carbon-rich AGB stars, having colors within the ranges, , , and . Only four stars appear to be early C-rich AGB stars.
Examining just the vs. A two-color diagram, category VI appears to be a monolithic group. The six-dimensional analysis of the observed colors and the SKY model reveal that it actually contains two distinct types of objects: the “late” (that is, high mass-loss rate, high obscuration) C-rich AGB stars (also known as “infrared” carbon stars; Chan & Kwok 1988) and their O-rich counterparts (generally OH/IR stars and H2O maser sources). In this category, the mixing is not as thorough as in category V, so the C-rich and O-rich sources are more easily separated. However, we still expect some confusion in the overlap region of these categories:
-
•
VIa - C-rich late AGB stars, within and , yielding a total of 108 likely IR carbon stars.
-
•
VIb - O-rich late AGB stars (OH/IR stars), within the region bounded by , , and . There are 337 likely OH/IR stars.
Category VII represents objects with rather unusual colors. The near-IR colors are blue, and on the color-color diagram they lie among the normal stars. However, they show a very large excess emission component at 8.3 m, indicative of dust associated with a stellar point source. The SKY model colors and the SIMBAD identifications show that the associations of the 2MASS sources and the MSX sources are indeed real. The objects in this group tend to be either planetary nebulae (PNe), or early (O- and B-type) stars associated with dust (i.e., HII regions, reflection nebulae, LBVs, dusty B stars, etc.). To some degree we can separate the objects based on the color, with the PNe being redder than the other objects. However, these objects tend to be among the fainter of the 2MASS sources. Therefore, confusion still exists in identifying these sources near the assumed boundary:
-
•
VIIa - PNe or PPNe, with colors , A , and , in accord with the range of colors seen in the SKY model for blue and red PNe, and for the known PNe from the SIMBAD identifications (see below). This yields a total of 76 candidate sources.
-
•
VIIb - HII regions, dusty reflection nebula-like objects, likely associated with star forming regions and OB associations, with , A , and . There are 254 candidates.
3.3 Identification of Specific Objects
As a check of the proposed object identifications resulting from the cluster-analysis and model colors, we have compared the 2MASS/MSX proposed spectral types to those contained in the SIMBAD database. 933 sources were returned with some type of identification, as listed in Tables 2–4. The relatively good agreement between the SIMBAD spectral types/object identifications and our object type assignments gives us a high degree of confidence in our method. As candidates become more IR-bright, they tend not to have optical counterparts and are therefore less likely to have spectral types. We discuss the detailed results of our cross-referencing here.
All of the stars in category I and almost two-thirds of category II have identifications (mostly HD numbers) in the SIMBAD database. Category I (early dwarfs) consists of B through F dwarfs (32 luminosity class V types), with a few emission-line stars, rounded out by ten subgiants, five A–F giants, and an A supergiant. Of the nineteen category II sources (late dwarfs), seven do not have spectral types in SIMBAD, and 11 have only spectral types without a luminosity class (three M, four K, and four G type stars). The only source in this category with both a spectral type and luminosity class, HD 33060, is listed as G8/K0III, a late giant.
The candidate giants (categories III [early] and IV [late]) show similar results. All but one source in category III have identifications in the SIMBAD database. Half of these sources are identified as G or K giants. Most of the remaining sources have only spectral types, primarily of G or K type, although six are classified as M-type stars. In category IV, 147 sources are listed in SIMBAD, and 95 of these have spectral type information. Of the 22 with both spectral types and luminosity classes, 19 are K giants. For stars without luminosity class information, 18 are K-type and 54 are M-type stars.
Category V, the supergiants and low mass-loss-rate AGB stars, contains less certain classifications. The supergiants are the least ambiguous, with 13 of the 99 candidates of M type and luminosity class Ia or Iab, and one classified as K5Iab. Only one of the four C-rich AGB candidates has a spectral type. The 61 O-rich AGB candidates include 2 Mira variables, a semi-regular variable, and 23 M-type stars, as well as two supergiants and a C-rich Wolf-Rayet star.
Category VI, which consists of the more heavily obscured AGB stars, have only a few reliable spectral-type identifications. Of the 337 O-rich candidates, only 55 appear in SIMBAD, and none of these have spectral types. One is classified as a PN, and a few are noted to be variable stars, but the majority (34) are simply listed as “IR sources” (mostly from IRAS PSC listings). We find a few spectral types among the C-rich candidates, with five of the 17 stars with SIMBAD references classified as carbon stars. The remainder are, again, simply listed as variable stars, or one, as member of a cluster.
In category VII, 40 of the 76 of the PN candidates have SIMBAD identifications. Seventeen are listed simply as “IR source”, while eight are “emission object” or “emission star.” Only one is actually listed as a PN, and the remaining types reflect a wide variety of unusual objects (e.g., nebulae, line sources, UV sources, radio sources). Our HII region candidates have similar sorts of SIMBAD identifications for 75 of the 254 sources. “IR sources” account for 28 of these objects, while eighteen are listed as HII regions, nebulae, or clusters. Fifteen are “emission objects,” and the remainder are stars or radio sources.
3.4 LMC and Foreground Stellar Populations
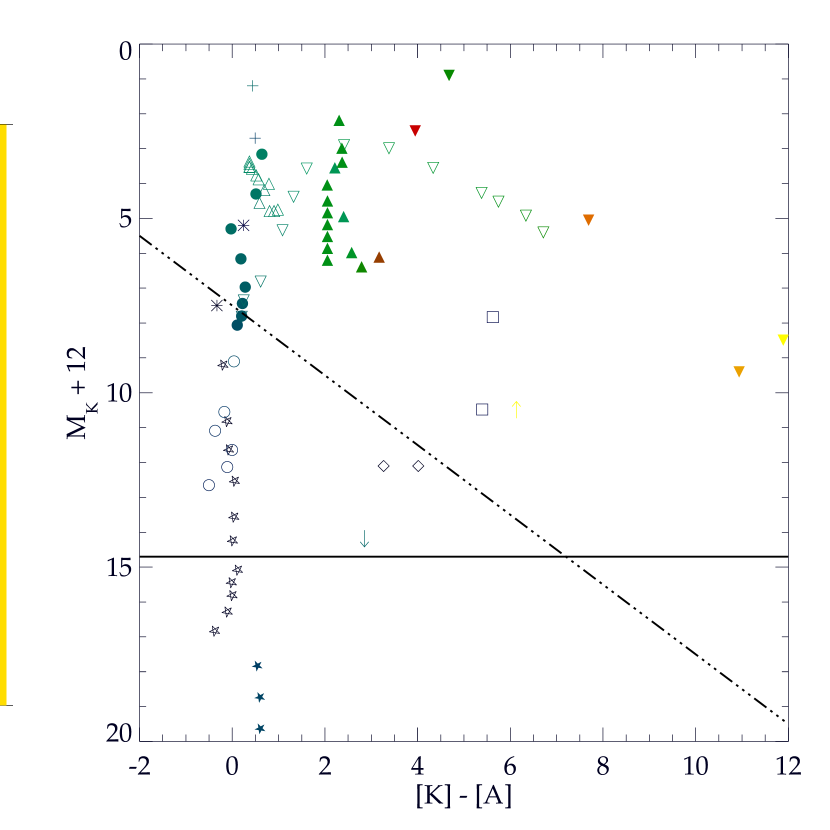
To properly study stellar populations in the LMC using our 2MASS/MSX cross-correlation, we must first separate the foreground Milky Way stars from the actual LMC sources. To do so, we can examine the vs. A color-magnitude diagram shown in Figure 5. The dashed line is the limit represented by the depth of the MSX survey in band A, approximately magnitude 8, and the solid line shows the magnitude limit for at SNR=10. The points have been color-coded to reflect their colors, so they can be more easily compared to the color-color diagram in Figure 3. In the color-magnitude diagram, the sources segregate into four distinct groups. From brightest to faintest at , we find: (1) A “crescent-shaped” group with , with A , in the range 0.75 to 0.5. For this group, , and its members encompass the elements of categories I–IV from the color-color diagram. (2) The knot of sources clustered at , with A , and , which corresponds primarily to category V, although some overlap exists with the M dwarfs. (3) Those sources with , A, and , encompassing mainly the members of category VI. (4) Finally, the PNe and HII regions of category VII can be seen as those sources generally with , A, and .
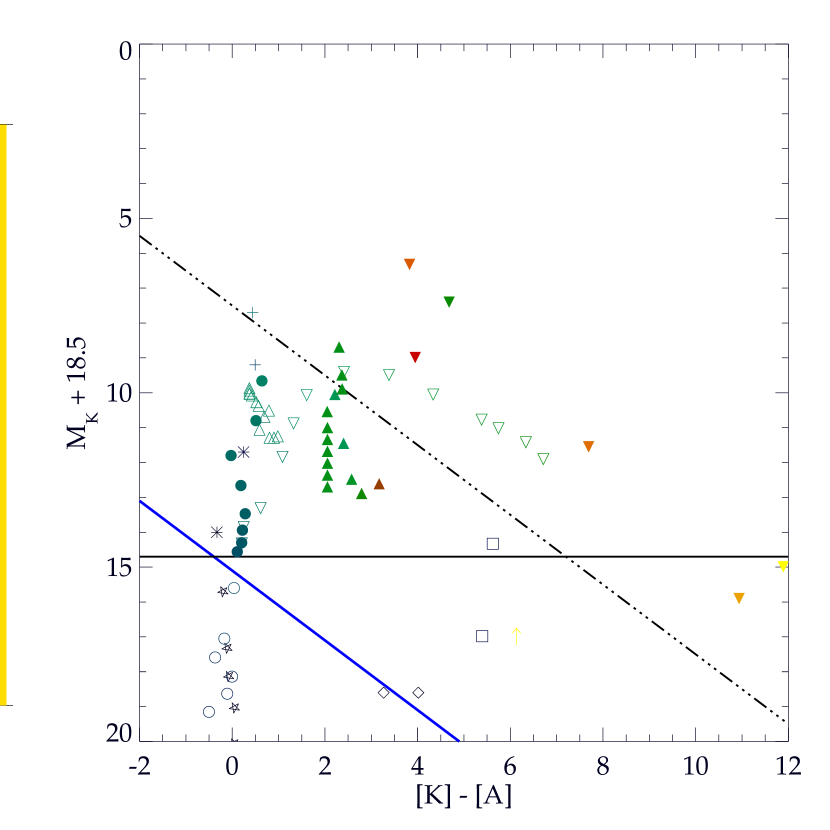
The apparent magnitude of a source in our sample will, of course, depend on the absolute magnitude, , of the source and its distance modulus, . Either the object is in the LMC, with (e.g., van Leeuwen et al. 1997, Gratton 1998, Koen & Laney 1998), or the object is in the Milky Way, with likely between 10 and 14 (1 kpc and 6 kpc, respectively). For convenience, we shall assume (2.5 kpc) as typical for foreground stars in the direction of the LMC. The SKY model contains the absolute magnitudes of each of the 87 source types which describe point sources in the Milky Way. We have modeled Figure 5 using these source types, for in Figure 6, and in Figure 7, ignoring differences between and .
Figure 6 indicates that a distance modulus of 12 represents the M giants in the diagram fairly well. However, we know from the color-color diagram that a number of the stars are likely G and K giants and main sequence stars, and that a few M dwarfs are in the sample. The figure implies that the more likely distance modulus for any G and K candidate giants is ( kpc), and that the main sequence stars we find are likely closer than 1 kpc, and probably more like 100 pc. From Figure 7 we see that T Tauri stars in the LMC are simply too faint to have been detected by MSX. This is also true for the main sequence and giant branch stars. The brightest M giants would be about magnitude 9 at 8.3 m if they were located in the LMC, one magnitude fainter than the MSX band A survey limit (however, these might possibly be detected in the co-added MSX image data). Most of the LMC M giants, while easily detectable by the 2MASS survey at , would have magnitude 13 at 8.3 m, undetectable by MSX (even in the co-added data). For the reddest M dwarfs in the sample, it appears that the furthest away they could be and still have been detected by MSX is 25 pc.
Figures 6 and 7 reveal that the reddest candidate objects, i.e., the heavily enshrouded AGB stars and the RSGs, are intrinsically so bright at that most in our sample must have , making them most surely extragalactic. The PN and most HII region candidates are generally fainter at , but given their colors, are also most likely extragalactic. It is possible that some of the earliest AGB star candidates (both C-rich and O-rich) could be extreme members of the Milky Way. Figure 7 suggests that the early carbon stars in the LMC would be about a magnitude too faint to have been detected in MSX band A (assuming they have the same limiting absolute magnitude in the LMC and the Milky Way). This likely explains the fact that we identify only five early AGB stars.
4 Discussion
4.1 Comments on Assigning Object Types
From the color-color diagrams the most difficult assignments are for the C-rich and O-rich AGB stars. These tend to blend together in color, especially for those with little dust emission. An added complication is the fact that the difference in metallicity between the Milky Way and the LMC makes it unlikely that the use of the Wainscoat et al. (1992) model yields entirely accurate results for these stars. However, the IR carbon stars appear to agree in color with the Wainscoat et al., which is corroborated by the SIMBAD cross-referencing. Thus, no a priori reason exists to believe that the colors for the low mass-loss rate (visual) carbon stars are incorrect.
We identify 61 early O-rich AGB stars in the sample, and only 4 (or, 6%) early C-rich AGB stars. Among the dusty AGB stars, we find 337 OH/IR-type stars, and 108 (or, 24%) IR carbon stars. Groenewegen & de Jong (1993) indicate that an approximately even number of O-rich and C-rich AGB stars are expected in the LMC, which contrasts with the 10–13% expected to be C-rich in the Milky Way (Hacking et al. 1985; Thronson et al. 1987). The lower metallicity of the LMC should result in an increased fraction of carbon stars. We see a lower percentage of C-rich stars than Groenewegen & de Jong expect, but this may be due to the fact that the O-rich population (OH/IR stars) is intrinsically brighter than their C-rich counterparts. Thus, more O-rich stars are observed by MSX, given its band A limiting magnitude.
One of the surprises of this study was the existence of the grouping of sources with A and , the category VII objects. We had found a fairly large number of stars with stellar near-IR colors, but with large mid-IR excess. Furthermore, the group segregates into two near-IR subgroups, a very blue one and a redder one. The Wainscoat et al. (1992) colors indicated that the redder (and, to a lesser degree, in ) group correspond most closely to the “red planetary” colors in the model. Of the few PNe identified in SIMBAD, these tend to fall in or near the colors defined for category VIIa.
Many of the stars we identify as PNe have spectral types indicating peculiar emission-line stars/objects, which is consistent with the PNe central stars. These identifications are the least likely in the sample, however, given the overlap with the HII region sources. It may be that a number of these are HII regions with more reddening than the others, rather than PNe.
To more adequately determine source types in Tables 2–4, it is clear that follow-up observations need to be made for many or all of the sources, including further imaging, but, particularly, spectroscopy. A preliminary set of optical spectroscopic observations by one of us (SVD) of a few objects in each of the categories (except HII regions) shows that our classification scheme has merit, particularly for the RSGs, AGB stars, and PNe. However, ground- and space-based IR spectroscopic and imaging observations are essential, especially for the more dust-obscured sources, such as the OH/IR and IR carbon stars.
4.2 Spatial Distribution of Object Types
Figures 8a and 8b show the location of objects in the 11 candidate categories distributed over the MSX 8.3 m image mosaic of the LMC. These figures can be quite useful in analyzing the validity of the identifications we have made on the basis of source color, and may also be of use in understanding star formation and evolution in LMC. Figure 8a shows the sources of luminosity class V and III, the most numerous being the giants. We have previously noted that the main sequence stars and giants in the sample must be foreground (Milky Way) objects, which we would not expect to be correlated with any structures in the LMC. Indeed, we see that these stars are distributed fairly randomly across the image, with no apparent clustering or association with any of the mid-IR emission in the LMC.
Figure 8b shows the distribution of the remaining sources, which we argue most likely belong to the LMC. The primary population are the extreme AGB stars. These are expected to be fairly massive (up to 8 ) and probably have ages of 1 Gyr. These sources are fairly widespread over the face of the LMC, with a concentration along the LMC bar. The next most populous groups are younger objects, i.e., large population of supergiants (99 in number, ages 0.5 Gyr), and a somewhat larger population (254 sources) of HII regions or reflection nebulae (expected to contain OB associations, ages 10–30 Myr). The mid-IR bright RSGs are confined to the central portions of the LMC, with two major clusterings. The first of these lies to the immediate west of the 30 Doradus complex, and northeast of the LMC bar, centered near , (note that SN 1987A is at the eastern edge of this cluster, at , , J2000). The second large cluster of supergiants is almost due north of the first, centered near , .
The largest concentrations of HII region candidates (category VIIb sources) trace the LMC bar, and many of the remaining HII regions are associated with other knots of mid-IR emission. There are also a large number of apparently randomly distributed category VIIb sources. An interesting comparison between the distribution of RSG and HII region candidates seen in the mid-IR and the distribution of the youngest LMC stars (bright main sequence dwarfs, blue loop stars and supergiants) identified by the DENIS near-IR survey (Cioni et al. 2000) can also be made. The contours defined in Cioni et al., their Figure 2, which trace the star count density of young ( Gyr) stars, are qualitatively very similar to the distribution of RSGs and HII regions in Figure 8b, including the enhancements in counts seen around the 30 Doradus and N11 regions. The distribution of HII regions tends (unsurprisingly) to trace the mid-IR extended emission. It is apparent that the current high-mass star formation in the LMC is strongly concentrated in or near the bar, although knots of mid-IR emission trace other regions of high-mass star formation throughout the LMC.
The stars we identified as “early” C-rich AGB stars are all found in the northeast quadrant of the LMC, while the “late” C-rich AGB stars are found in two primary areas, one just south of the LMC bar, and another in the northwest quadrant of the galaxy, around the N11 complex. The O-rich AGB stars are more widely distributed, but it appears that their distribution traces the areas of bright mid-IR emission.
The distribution of candidate PNe are fairly widespread over the face of the LMC, although there is some association with knots of mid-IR emission along the bar. The likely PNe are more closely associated with the central portions of the LMC than are the HII region members of category VII. There is a cluster of 6 PNe in the 30 Doradus complex, as well as another cluster of three sources about to the northwest. Another group of PNe runs through the middle of the bar.
4.3 Unmatched MSX Sources
There are 142 sources in the MSX PSC which did not have matches in the 2MASS PSC. A comparison of the magnitude distribution of the matched and unmatched MSX sources is shown in Figure 9. We have visually examined the 2MASS and MSX image data, and find that lack of matches can generally be explained by four reasons: 1) a source is too bright (i.e., saturated) in 2MASS, 2) a source is too faint in 2MASS, 3) a possible positional mismatch exists, 4) the 2MASS source is extended, or 5) something appears in the 2MASS () image, but was not detected, for whatever reason. The 2MASS point source processing for the 2IDR could not extract extremely bright sources, but instead, placeholders for these stars were put in the 2IDR PSC (with values 99.999 for magnitudes).
Five of the unmatched sources were far too bright for 2MASS. We have identified these stars, matched them with SIMBAD, and extracted their (inaccurate) magnitudes from the 2MASS working database: HD 31907 (M1III), ; HD 271114 (F0), ; WOH G 622 (M-type), ; HD 271928 (M4), ; and, HD 272138 (M2), . An additional five MSX sources have nearby 2MASS counterparts, and we suspect that the MSX pointing correction may have been locally inadequate in these cases, with an optimistic quoted positional uncertainty, resulting in a failure to make the proper match. Nineteen MSX sources appear correlated with relatively faint 2MASS sources which appear extended. Five of these faint sources are in fields with general nebulosity, i.e., brighter extended sources in the 2MASS XSC which are also correlated with MSX point sources; in fact, we can account for one “unmatched” 2MASS PSC source, since it is actually an extended source, matched with MSX (see below).
The overwhelming majority of unmatched sources do not appear on 2MASS images, likely because they are too faint for 2MASS (i.e., so red) that the magnitudes are below the detection limits. However, a fraction of the sources are probably spurious sources in the MSX PSC. Figure 9 shows that most of the unmatched sources are near the MSX detection threshold. One such spurious source is obvious in the case of MSX source no. 187, which inadvertantly survived the catalog compilation with a bad SNR calculation. Examination of the MSX image data indicates that 37 of these objects are unambiguous point sources in the co-added image, six appear to be multiple sources, and thus may have incorrect position information in the catalog, 29 are somewhat non-point-like, and associated with extended emission, 35 are at very low SNR on the image plate, but probably are real, and 30 have no identifiable counterpart on the image data and are likely spurious catalog sources.
4.4 MSX Sources without Category
Among the 228 MSX sources in Tables 2 and 3 without assignment to one of the 11 object categories, 85 of these have spectral type identification from SIMBAD. 68 (or 30%) of the uncategorized sources are saturated in the 2MASS bands, but most of these have SIMBAD identifications consistent with what are most likely foreground giant and dwarf stars. For the rest of the uncategorized sources, 31 (or 14%) are very red and relatively faint as seen by 2MASS, 9 (4%) are rather blue and faint, and 19 (8%) are blended or confused, such that the 2MASS and MSX colors are not representative of the individual objects, and three are clearly nebular (with an associated 2MASS point source). The blended objects either are of similar color, e.g., in a compact star cluster, but are just too confused, or, in several cases, are a pair of confused stars of very different colors. Among the nebular objects is a known HII region (LI-LMC 102), a source associated with N 105A, and a source associated with the emission object LHA 120-S 24. Among the faint, red objects is a known LMC PN (IRAS 045156710), and we suspect that others are in this category. We also suspect that many of the faint, blue sources are (compact) HII regions, based on their colors.
Yet, most (97, or 42%) appear stellar and have colors and SIMBAD identifications (for some) that indicate that these are likely AGB or RSG stars with a range of luminosities. Known sources in this group are HD 269953 (a LMC G0Ia star), WOH G 64 (a RSG, a known H2O maser source), and SHV 0510360-693335 (a long-period variable, possible carbon star). Many are quite red, and, therefore, possibly dusty. An extreme example is the unusually red MSX source no. 811, with , , and A=3.14. The fact that these stars did not fall directly into our object categories may indicate that the Wainscoat et al. (1992) colors for Galactic objects do not fit well the colors for these specific LMC sources. Along with the many sources in this study that fall into our categories, these uncategorized objects also deserve follow-up IR imaging and spectroscopic observations.
4.5 Extended Sources in 2MASS
There are 131 MSX sources matched with 2MASS extended sources across the LMC. Although 2MASS detects extended sources over the entire 100 square-degree field, the central region of the galaxy will have the preponderance of matched extended sources, since most of the MSX structure is concentrated there. The matched sources are generally faint. The majority (57%) appear nebular, while a large number (31%) appear point-like, and many of these are fairly red. About 12% of the extended sources are galaxies behind the LMC. Most of the extended sources fall in the same color regime as the candidate PNe and HII regions, and a few are near the area on the diagram for the AGB stars. The MSX footprint is large enough that many sources in the LMC that are extended, as seen by 2MASS, would be considered “point-like” and would fall into the MSX PSC. All of the matched extended sources are associated with matched MSX/2MASS point sources. This occurs, since many 2MASS extended sources contain associated point sources, such as ionizing stars within the nebulae, in the case of the candidate HII regions or reflection nebulae, or central stars within candidate PNe. Also, a few of the candidate AGB stars must show associated extended emission, e.g., circumstellar nebulae, as seen by 2MASS, which, together, are also bright in the MSX A band.
4.6 Future Directions
This work presents a classification scheme for resolved objects in external galaxies where near-IR and mid-IR colors are available. In addition to future large ground-based IR observing programs, the next opportunity for large-scale application of this work would be to undertake a survey of the LMC with the SIRTF IR Array Camera (IRAC) instrument. Like MSX, IRAC has an 8 m capability. Its projected sensitivity is approximately magnitude 12 in this band in the moderate integration mode. Combining an IRAC LMC survey with the 2MASS point source catalog would yield a much more complete population study of the LMC. The limits of such a survey are shown on the magnitude-color diagrams in Figures 5 and 7.
The magnitude=7.5 limit of the MSX A-band survey was too high to detect the majority of AGB stars with low-to-moderate mass loss. We see from Figure 7 that a SIRTF/2MASS survey will detect the entire LMC AGB population, as well as the fainter end of the PN population, assuming the Wainscoat et al. (1992) absolute magnitudes are similar to what the same stellar types would have under the metallicity conditions in the LMC.
Based on the IRAC performance provided by Hora, Fazio, & Willner (2000), an IRAC survey would detect sources at SNR=5 with the 30-s integration mode (A. Omont & G. Gilmore, priv. comm.). From the MSX 8.3 m source counts in Figure 1, confusion is estimated to set in at . Indeed, confusion is relatively minimal in the densest regions of the LMC at a magnitude limit of 14.7. For 2MASS, SNR5 occurs at . Thus, an IRAC [8 m] LMC survey is well-matched to the 2MASS survey of the LMC. Again, from Figure 1, more than a million LMC sources would be matched with , , , and the IRAC colors. 2MASS also conducted a “6X” survey (six times the normal survey integration time per scan) of the LMC, increasing the survey limit by about 1–1.5 magnitudes. We recommend such a SIRTF survey be done as one of the major Guest Observer projects.
5 Conclusions
MSX and 2MASS have both observed the LMC as part of their operations in the mid- and near-IR, respectively. We have performed a cross-correlation of the source catalogs from the two IR surveys and have found 1664 point source and 131 extended source matches. It is clear that the combination of near-IR and mid-IR colors can lift some of the degeneracy in the IR color-color diagram for sources in the LMC. For instance, in the 2MASS-only color plane, HII regions and PNe are indistinguishable from normal stars. With the MSX A-band as another axis to the color plane, such nebulae are much easier to identify and distinguish.
Based on the combined 2MASS/MSX colors, using the IR point source model by Wainscoat et al. (1992), and obtaining source names and spectral types from the SIMBAD database, when available, we have identified 11 categories of stellar populations and red nebulae, including main sequence stars, giant stars, RSGs, C- and O-rich AGB stars, PNe, H II regions, and other dusty objects likely associated with early-type stars. 731 of these sources were previously unidentified. Object detection is limited by the MSX 8.3 m (band A) sensitivity.
The spatial distribution of these IR sources can also add to our understanding of star formation and stellar evolution in the LMC, and of the evolution of the LMC as a member of an interacting system with the Milky Way, as well as a template for low-metallicity systems at higher redshift. Our compilation of MSX and 2MASS photometry and astrometry for these sources will provide a sample of objects for future observations and analysis by ground-based and space-based observatories, such as SIRTF and SOFIA.
References
- (1)
- (2) Chan, S.J., & Kwok, S. 1988, ApJ, 334, 362
- (3) Cioni, M.-R., et al. 2000, A&AS, 144, 235
- (4) Cohen, M., Hammersley, P.L., & Egan, M.P. 2000, AJ, 120, 3362
- (5) Egan, M.P., & Price, S.D. 1996, AJ, 112, 2862
- (6) Egan, M. P., et al. 1999, MSX Point Source Catalog Explanatory Guide, AFRL-VS-TR-1999-1522, (Springfield: NTIS)
- (7) Gratton, R.G. 1998, MNRAS, 296, 739
- (8) Groenewegen, M.A.T., & de Jong, T. 1993, A&A, 267, 410
- (9) Hacking, P., et al. 1985, PASP, 97, 616
- (10) Höppner, F., Klawonn, F., Kruse, R., & Runkler, T. 1999, Fuzzy Cluster Analysis, (New York: Wiley)
- (11) Hora, J.L., Fazio, G.G., & Willner, S.P, 2000, in Infrared Spaceborn Remote Sensing VIII, eds. M. Stojnik & B. F. Andresen, Proc. SPIE, 4131, 13-25
- (12) Koen, C., & Laney, C.D. 1998, MNRAS, 301, 582
- (13) Nikolaev, S., & Weinberg, M..D, 2000, ApJ, 542, 804
- (14) Price, S.D., Egan, M.P., Carey, S.J., Mizuno, D.R., Kuchar, T.A. 2001, AJ, 121, 2819
- (15) Schwering, P.B.W. 1989, A&AS, 79, 105
- (16) Schwering, P.B.W., & Israel, F.P. 1990, Atlas and Catalogue of Infrared Sources in the Magellanic Clouds (Dordrecht: Kluwer)
- (17) Thronson, H.A., Jr., Latter, W.B., Black, J.H., Bally, J., & Hacking, P. 1987, ApJ, 322, 770
- (18) van Leeuwen, F., Feast, M.W., Whitelock, P.A., & Yudin, B. 1997, MNRAS, 287, 955
- (19) Wainscoat, R.J., Cohen, M., Volk, K., Walker, H.J., & Schwartz, D.E. 1992, ApJS, 83, 111
- (20) Zaritsky, D., Harris, J., & Thompson, I. 1997, AJ, 114, 1002
- (21)
| Band | No. | Isophotal | 50% | Isophotal | Abs. | LMC Survey |
|---|---|---|---|---|---|---|
| Active | () | Peak | BW () | Photom. | Sens. | |
| Cols. | Intensity | Accuracy | (Jy) | |||
| A | 8 | 8.28 | 6.8–10.8 | 3.36 | 5% | 0.045 |
| B1 | 2 | 4.29 | 4.22–4.36 | 0.104 | 9% | 10 |
| B2 | 2 | 4.35 | 4.24–4.45 | 0.179 | 9% | 6 |
| C | 4 | 12.13 | 11.1–13.2 | 1.72 | 3% | 0.6 |
| D | 4 | 14.65 | 13.5–15.9 | 2.23 | 4% | 0.5 |
| E | 2 | 21.34 | 18.2–25.1 | 6.24 | 6% | 1.1 |
| MSX # | RA (J2000)aaIn decimal degrees. | Dec (J2000)aaIn decimal degrees. | A (8.3 m) | IR Type | SIMBAD Type | SIMBAD Name | |||
|---|---|---|---|---|---|---|---|---|---|
| 1 | 77.5366 | 64.3182 | 0.58 | M8IIIe | Mi*V* U Dor | ||||
| 2 | 75.9857 | 65.0121 | 2.46 | M4III | *HD 33213 | ||||
| 3 | 76.1875 | 64.5457 | 6.00 | 5.46 | 5.34 | 5.45 | A-K III | K0IIICN. | *HD 33293 |
| 4 | 76.6619 | 65.3762 | 5.89 | 5.12 | 5.33 | A-K III | K2III/IV | *HD 33616 | |
| 5 | 77.4312 | 64.3862 | 6.75 | 6.09 | 5.92 | 5.99 | A-K III | K3III | *HD 34016 |
| 6 | 78.0128 | 65.1757 | 6.21 | 5.96 | 5.92 | 6.17 | MS(V) | F5V | *HD 34349 |
| 7 | 77.4316 | 65.3665 | 8.84 | 8.07 | 7.71 | 6.23 | RSG | IRIRAS 050956525 | |
| 8 | 77.5507 | 65.3261 | 15.82 | 13.55 | 11.64 | 6.51 | OH/IR | ||
| 9 | 77.2655 | 63.9412 | 7.24 | 6.58 | 6.47 | 6.59 | A-K III | K2III | *HD 33895 |
| 10 | 77.5185 | 65.0441 | 6.94 | 6.37 | 6.20 | 6.49 | A-K III | K1III | *HD 34074 |
| 11 | 78.1615 | 64.2038 | 14.08 | 12.10 | 10.52 | 6.73 | OH/IR | ||
| 12 | 78.0665 | 65.3120 | 16.49 | 13.80 | 11.89 | 7.12 | OH/IR | ||
| 13 | 78.1952 | 64.2365 | 7.38 | 6.64 | 6.45 | 6.71 | MIII | *CPD64 428 | |
| 14 | 76.9128 | 64.5418 | 7.94 | 7.40 | 7.27 | 7.45 | A-K III | *HD 271019 | |
| 15 | 77.8264 | 65.4357 | 8.70 | 7.91 | 7.66 | 7.44 | MIII | M | V*SV* HV 2886 |
| 16 | 77.7092 | 64.2588 | 7.63 | 7.13 | 6.99 | 6.97 | A-K III | ? | *CD-64 178 |
| 18 | 77.1345 | 65.1374 | 12.10 | 11.03 | 10.40 | 7.92 | O AGB | ||
| 19 | 76.2801 | 65.3911 | 13.72 | 12.09 | 10.72 | 7.78 | C IR | ||
| 20 | 77.5189 | 66.4232 | 4.12 | K5III | *HD 34127 | ||||
| 21 | 76.3348 | 66.9185 | 15.58 | 14.60 | 13.61 | 6.09 | PN | IRIRAS 050536659 | |
| 22 | 76.1964 | 66.6751 | 14.18 | 13.75 | 12.96 | 6.06 | PN | IRIRAS 050476644 | |
| 23 | 76.1491 | 65.7629 | 6.99 | 6.40 | 6.24 | 6.51 | A-K III | K2III | *HD 33322 |
| 24 | 76.4292 | 66.8491 | 7.37 | 6.62 | 6.49 | 6.51 | A-K III | K1 | *HD 33530 |
| 25 | 75.7765 | 66.9101 | 7.18 | 6.64 | 6.48 | 6.77 | A-K III | K0III | *iCHD 33148 |
| 26 | 75.9988 | 65.4274 | 7.76 | 6.99 | 6.85 | 7.02 | MIII | M0 | *HD 270978 |
| 27 | 76.5882 | 66.7211 | 16.09 | 13.61 | 11.60 | 7.02 | OH/IR | ||
| 28 | 77.0320 | 65.8135 | 7.80 | 6.94 | 6.63 | 6.78 | MIII | M | *PV 2088 |
| 29 | 77.9111 | 66.8528 | 14.32 | 12.38 | 10.74 | 6.92 | OH/IR | ||
| 30 | 77.9575 | 66.4081 | 15.76 | 13.70 | 12.01 | 7.26 | OH/IR | ||
| 31 | 76.5891 | 65.9668 | 7.07 | 6.64 | 6.49 | 6.78 | A-K III | G8III/IV | **CCDM J05063-6558AB |
| 32 | 77.5074 | 65.8657 | 15.43 | 13.24 | 11.46 | 7.11 | OH/IR | ||
| 33 | 76.9190 | 66.8159 | 14.49 | 12.50 | 10.93 | 7.22 | |||
| 34 | 77.1513 | 65.5034 | 13.23 | 11.61 | 10.43 | 7.37 | C IR | ||
| 35 | 76.4690 | 66.0135 | 12.30 | 10.88 | 9.70 | 7.44 | C IR | ||
| 36 | 77.0451 | 66.2967 | 8.08 | 7.14 | 6.81 | 7.03 | MIII | M | *RM 1-206 |
| 37 | 77.5041 | 65.5461 | 7.70 | 7.20 | 7.03 | 7.29 | A-K III | K0 | *iCHD 271049 |
| 38 | 75.9547 | 66.3699 | 14.40 | 12.53 | 10.98 | 7.20 | OH/IR | ||
| 39 | 76.7218 | 65.6687 | 8.26 | 7.68 | 7.52 | 7.08 | MV | K7 | *iCHD 271012 |
| 40 | 75.8935 | 65.8078 | 17.06 | 14.51 | 12.35 | 6.80 | OH/IR | ||
| 41 | 76.5038 | 66.2110 | 15.50 | 15.08 | 14.66 | 7.72 | HII | ||
| 43 | 76.0588 | 67.2707 | 8.00 | 7.17 | 6.76 | 5.33 | O AGB | M4Ia | V*SV* HV 888 |
| 44 | 77.7934 | 67.8696 | 16.38 | 14.05 | 11.67 | 5.46 | OH/IR | *IRAS 051126755 | |
| 45 | 77.6718 | 68.6019 | 16.20 | 14.52 | 11.76 | 5.78 | OH/IR | IRIRAS 051086839 | |
| 46 | 75.9772 | 67.3135 | 16.03 | 14.08 | 12.34 | 6.16 | OH/IR | EmOLHA 120-N 17A | |
| 47 | 77.8077 | 67.6045 | 17.56 | 14.76 | 12.50 | 6.35 | OH/IR |
| MSX # | RA (J2000)aaIn decimal degrees. | Dec (J2000)aaIn decimal degrees. | A (8.3 m) | IR Type | SIMBAD Type | SIMBAD Name | |||
|---|---|---|---|---|---|---|---|---|---|
| 271 | 78.9226 | 67.9813 | 15.03 | 14.75 | 14.46 | 7.22 | HII | IRIRAS 051586802 | |
| 274 | 79.0249 | 66.5650 | 8.12 | 7.62 | 7.48 | 7.67 | A-K III | G0 | *HD 269233 |
| 298 | 80.0015 | 66.0577 | 6.71 | 6.51 | 6.46 | 6.78 | MS(V) | F2/F3IV/ | *HD 35474 |
| 299 | 79.1115 | 66.1327 | 8.14 | 7.56 | 7.43 | 7.44 | A-K III | M0 | *HD 271129 |
| 304 | 79.8203 | 67.8636 | 6.41 | 5.56 | 5.33 | 5.34 | MIII | K5III | V*V* AS Dor |
| 305 | 79.6362 | 67.5422 | 6.56 | 5.81 | 5.55 | 5.69 | MIII | K5 | *HD 35323 |
| 306 | 79.9574 | 66.4431 | 6.46 | 5.86 | 5.68 | 5.82 | A-K III | K1III | *HD 35461 |
| 307 | 79.7345 | 67.7513 | 17.59 | 15.61 | 12.82 | 6.27 | OH/IR | *IRAS 051906748 | |
| 308 | 79.3778 | 66.7270 | 14.26 | 13.76 | 13.13 | 6.58 | HII | *TRM 81 | |
| 309 | 80.0690 | 66.8817 | 16.14 | 15.24 | 13.85 | 6.94 | Cl*KMHK 786 | ||
| 310 | 80.0807 | 66.5966 | 14.38 | 12.36 | 10.86 | 6.59 | OH/IR | ||
| 311 | 79.4210 | 66.7041 | 15.90 | 14.54 | 13.76 | 6.84 | EmOLHA 120-S 24 | ||
| 312 | 79.9873 | 66.2309 | 10.04 | 9.29 | 9.17 | 7.49 | G5 | *HD 269339 | |
| 313 | 79.0806 | 67.2545 | 8.51 | 7.82 | 7.65 | 7.24 | MV | M | *WOH G 252 |
| 314 | 80.1444 | 66.7797 | 15.37 | 14.64 | 14.48 | 7.11 | HII | *TRM 80 | |
| 315 | 78.3561 | 67.4807 | 16.97 | 15.85 | 14.83 | 7.23 | |||
| 317 | 80.0489 | 67.7073 | 17.24 | 15.89 | 16.85 | 7.78 | HII | ||
| 318 | 79.8013 | 69.1518 | 15.16 | 14.70 | 12.87 | 5.26 | IRIRAS 051956911 | ||
| 319 | 79.3981 | 68.5931 | 5.95 | 5.45 | 5.36 | 5.51 | A-K III | G8III | *HD 35230 |
| 320 | 79.8182 | 69.3404 | 15.98 | 14.72 | 14.18 | 5.65 | HII | IRLI-LMC 810 | |
| 321 | 79.7656 | 69.4923 | 13.18 | 11.96 | 10.46 | 5.77 | V*AGPRS J051904.0269 | ||
| 322 | 79.0447 | 69.2447 | 16.33 | 15.34 | 13.40 | 6.07 | |||
| 323 | 79.1325 | 68.3692 | 12.19 | 11.68 | 10.53 | 6.05 | PN | A0:Iab: | Em*ARDB 184 |
| 324 | 79.8868 | 67.8790 | 7.06 | 6.28 | 6.00 | 6.09 | MIII | K5III | *HD 269352 |
| 325 | 79.1570 | 69.4540 | 15.25 | 12.96 | 11.09 | 6.44 | OH/IR | ||
| 326 | 80.2335 | 67.9843 | 6.61 | 6.03 | 5.88 | 6.14 | A-K III | K0III/IV | *iCHD 35665 |
| 327 | 79.7781 | 68.3601 | 14.56 | 14.19 | 13.56 | 6.62 | HII | EmOLHA 120-N 118 | |
| 328 | 80.2583 | 68.3543 | 7.16 | 6.53 | 6.33 | 6.46 | A-K III | K2III | V*NSV 1957 |
| 330 | 79.9719 | 68.0677 | 8.38 | 7.59 | 7.20 | 6.70 | MIII | M2Ia | V*SV* HV 2450 |
| 331 | 79.4936 | 69.2650 | 7.61 | 6.75 | 6.45 | 6.76 | MIII | M | *iA[L72] LH 41-4 |
| 332 | 79.2526 | 69.3252 | 14.94 | 12.52 | 10.73 | 6.58 | OH/IR | PNJacoby LMC 17 | |
| 334 | 79.5092 | 69.5374 | 16.60 | 15.40 | 15.05 | 6.80 | HII | ||
| 335 | 79.4070 | 69.2550 | 14.40 | 13.46 | 13.41 | 6.84 | HII | ||
| 336 | 79.4850 | 69.2455 | 13.96 | 12.94 | 12.62 | 6.78 | HII | ||
| 337 | 79.9945 | 68.8955 | 15.73 | 13.68 | 11.86 | 7.02 | OH/IR | ||
| 338 | 79.7347 | 67.9372 | 8.63 | 7.86 | 7.47 | 6.85 | RSG | ||
| 339 | 79.0428 | 68.8329 | 16.77 | 14.77 | 12.65 | 7.13 | OH/IR | ||
| 341 | 80.2518 | 69.3487 | 17.52 | 15.29 | 12.90 | 6.47 | OH/IR | ||
| 342 | 79.7475 | 68.7384 | 7.80 | 7.32 | 7.20 | 7.17 | A-K III | G8III | *HD 35447 |
| 343 | 79.5135 | 68.4658 | 6.95 | 6.54 | 6.42 | 6.85 | A-K III | G2IV: | *iCHD 35294 |
| 344 | 79.3441 | 69.3376 | 9.80 | 9.32 | 8.81 | 5.97 | ?… | V*HD 35231 | |
| 345 | 79.6747 | 67.9613 | 16.84 | 15.03 | 12.91 | 7.13 | OH/IR | ||
| 346 | 79.6173 | 68.0678 | 17.92 | 15.63 | 14.82 | 6.93 | |||
| 347 | 80.0490 | 68.6315 | 16.48 | 15.06 | 15.28 | 7.35 | HII | ||
| 348 | 79.7875 | 69.4555 | 14.03 | 12.22 | 10.75 | 7.53 | C IR |
| MSX # | RAaaIn decimal degrees. | DecaaIn decimal degrees. | A | B | C | D | SIMBAD | SIMBAD | NotesbbExplanation of Notes. N1 is the number of MSX scan legs in which the source was detected, which is a possible measure of the source’s reliability. N2 is a code for the source appearance in the MSX A-band coadded image: blank = point source in MSX image; 2 = multiple/blended source at position; 3 = extended emission source at position; 4 = very low SNR source, possibly not real; and, 5 = no apparent emission. N3 is a code for the source appearance in the 2MASS images: blank = source not seen in 2MASS images; 2 = extended 2MASS emission; 3 = very bright (saturated) 2MASS star; 4 = possible positional mismatch; and, 5 = possible faint emission at source position in 2MASS images. | ||
|---|---|---|---|---|---|---|---|---|---|---|---|
| (J2000) | (J2000) | (8.3 m) | (12.1 m) | (14.7 m) | (21.3 m) | Type | Name | N1 | N2 | N3 | |
| 17 | 77.5329 | 64.3681 | 7.15 | 3 | |||||||
| 42 | 75.3938 | 68.0987 | 2.79 | 2.12 | 1.94 | 1.77 | M7 | Mi*V* RX Dor | 5 | ||
| 58 | 75.4509 | 67.7917 | 7.00 | 4 | 4 | ||||||
| 63 | 76.2797 | 68.0524 | 7.22 | *[O96] D066 - 170 | 2 | 3 | |||||
| 84 | 76.2687 | 68.9635 | 5.90 | 4 | |||||||
| 86 | 76.2171 | 70.1256 | 6.30 | IRAS 050527011 | 5 | 3 | |||||
| 133 | 76.1563 | 70.9103 | 5.26 | 3.40 | 3.58 | 0.59 | ?… | EmOLHA 120-N 191A | 4 | 3 | 5 |
| 145 | 76.1065 | 70.7265 | 6.62 | 5 | 2 | ||||||
| 185 | 74.6938 | 73.2010 | 7.37 | 2 | 5 | ||||||
| 187 | 77.9137 | 73.7902 | 9.80 | 2 | 5 | ||||||
| 272 | 78.4541 | 67.1250 | 7.32 | 2 | |||||||
| 282 | 78.8922 | 65.5438 | 2.42 | 2.31 | 2.21 | F0 | *HD 271114 | 4 | 3 | ||
| 284 | 78.5873 | 65.3136 | 7.53 | 2 | 5 | ||||||
| 288 | 78.4921 | 66.4102 | 7.63 | 3 | 4 | ||||||
| 302 | 78.6732 | 65.6551 | 7.37 | 3 | 4 | ||||||
| 329 | 79.6844 | 69.2407 | 6.63 | *iA[L72] LH 41-1095 | 2 | 3 | |||||
| 377 | 77.8470 | 70.3696 | 7.25 | 2 | 3 | ||||||
| 404 | 77.5649 | 72.6087 | 7.03 | 2 | 2 | ||||||
| 407 | 79.0652 | 71.5650 | 7.40 | 4 | 3 | ||||||
| 410 | 78.1202 | 72.7943 | 7.59 | 3 | 4 | 4 | |||||
| 414 | 79.5650 | 72.9557 | 7.32 | 2 | 5 | ||||||
| 415 | 79.9805 | 73.1202 | 7.30 | 3 | 4 | ||||||
| 437 | 80.8134 | 69.9353 | 6.24 | 4 | |||||||
| 463 | 79.7829 | 69.6295 | 5.59 | 2 | |||||||
| 509 | 80.7018 | 68.0194 | 6.87 | EmOLHA 120-N 44H | 4 | 2 | |||||
| 527 | 80.5818 | 65.7217 | 6.39 | 3.71 | *TRM 107 | 4 | 5 | ||||
| 573 | 81.9170 | 67.4465 | 7.06 | 4 | 3 | ||||||
| 576 | 80.7934 | 66.3788 | 7.38 | 3 | 3 | 2 | |||||
| 584 | 80.5128 | 67.9633 | 4.80 | RadMRC 0522680 | 2 | 3 | 2 | ||||
| 691 | 82.7145 | 72.7612 | 6.61 | 4 | |||||||
| 715 | 83.7326 | 73.6288 | 7.45 | 3 | 4 | ||||||
| 723 | 82.4082 | 72.8314 | 6.99 | 2 | 2 | ||||||
| 726 | 82.5995 | 72.8924 | 7.40 | 2 | 4 | 4 | |||||
| 739 | 83.3772 | 69.8767 | 6.78 | IRIRAS 053396954 | 4 | 2 | |||||
| 761 | 83.8210 | 71.2972 | 7.69 | 3 | 4 | ||||||
| 763 | 83.5603 | 69.7891 | 3.93 | 1.92 | 0.80 | 0.36 | IRIRAS 053466949 | 5 | |||
| 800 | 82.8883 | 68.4788 | 7.49 | 2 | 3 | 5 | |||||
| 808 | 83.2154 | 67.6843 | 6.08 | 1.81 | *[O96] D231 - 263 | 5 | 3 | 2 | |||
| 842 | 82.4906 | 65.8392 | 7.25 | *TRM 103 | 2 | ||||||
| 849 | 82.1467 | 66.5047 | 7.32 | 2 | 5 | ||||||
| 855 | 82.9190 | 64.5423 | 7.23 | 2 | 5 | 5 | |||||
| 859 | 83.8405 | 63.9374 | 7.37 | 2 | 5 | ||||||
| 865 | 84.1946 | 65.7923 | 7.49 | 3 | |||||||
| 868 | 83.8485 | 67.5824 | 4.82 | 3.24 | 1.98 | 0.01 | ?e… | *HD 37731 | 4 | 3 | 2 |
| 895 | 84.4955 | 69.1082 | 6.23 | 1.24 | 3 | ||||||
| 898 | 84.8831 | 69.0980 | 6.59 | 3 | 3 | 2 | |||||
| 902 | 84.6697 | 69.0020 | 6.92 | 2 | 3 | 2 | |||||
| 920 | 84.7287 | 69.1769 | 7.09 | 3 | 3 | ||||||
| 933 | 84.9117 | 69.7704 | 4.41 | 2.63 | 1.73 | 0.43 | *[DCL92] 220 | 4 | 3 | 2 | |
| 945 | 84.0293 | 69.5411 | 6.73 | 3 | 3 | ||||||
| 953 | 84.7232 | 69.5713 | 6.85 | 2 | 3 | ||||||
| 964 | 84.3330 | 69.7533 | 7.23 | 2 | 3 | ||||||
| 980 | 85.6505 | 71.5931 | 6.78 | 3 | |||||||
| 989 | 83.5356 | 71.9283 | 7.26 | 2 | |||||||
| 996 | 66.6111 | 71.9164 | 7.55 | 2 | 4 | ||||||
| 1002 | 66.2966 | 71.7966 | 7.89 | 3 | 4 | ||||||
| 1041 | 70.2596 | 66.3808 | 7.57 | 2 | 5 | ||||||
| 1059 | 66.7514 | 73.1858 | 7.40 | 2 | 4 | ||||||
| 1060 | 67.6442 | 72.7854 | 7.81 | 3 | 2 | ||||||
| 1062 | 68.4079 | 73.2724 | 7.07 | 4 | |||||||
| 1087 | 72.0591 | 66.5192 | 7.53 | 2 | 4 | ||||||
| 1094 | 72.7494 | 64.0787 | 7.34 | 2 | 4 | ||||||
| 1111 | 73.4342 | 66.1963 | 7.15 | IRIRAS 045356616 | 4 | ||||||
| 1114 | 72.9071 | 66.3558 | 7.63 | 3 | 5 | ||||||
| 1153 | 69.6848 | 72.8560 | 7.53 | 2 | 4 | ||||||
| 1154 | 69.5942 | 72.8798 | 7.49 | 3 | 4 | ||||||
| 1157 | 69.8409 | 73.3907 | 7.63 | 3 | 5 | ||||||
| 1158 | 71.9523 | 73.4623 | 7.44 | 2 | 5 | ||||||
| 1168 | 71.6976 | 71.8944 | 7.63 | 3 | 4 | ||||||
| 1224 | 73.5865 | 67.2854 | 4.29 | M1III | *HD 31907 | 4 | 3 | ||||
| 1231 | 74.4139 | 66.4537 | 6.37 | 4 | 3 | 2 | |||||
| 1232 | 74.1159 | 66.5335 | 6.45 | 1.35 | 4 | 3 | 2 | ||||
| 1245 | 73.4059 | 66.9893 | 7.59 | As*BSDL 164 | 3 | 3 | |||||
| 1255 | 73.8037 | 65.5139 | 7.27 | 2 | 4 | ||||||
| 1264 | 74.1492 | 64.7583 | 7.67 | 3 | 4 | ||||||
| 1279 | 74.1375 | 66.4000 | 6.39 | *PGMW 3010 | 2 | 3 | 2 | ||||
| 1288 | 74.5009 | 66.3388 | 7.35 | 2 | 4 | ||||||
| 1300 | 74.4323 | 68.9998 | 6.08 | K3III: | *HD 32439 | 4 | 2 | 4 | |||
| 1301 | 74.3282 | 68.4229 | 6.24 | As*LH 12 | 4 | 2 | 2 | ||||
| 1303 | 74.6752 | 68.1208 | 6.33 | IRIRAS 045886811 | 4 | 2 | |||||
| 1313 | 74.6771 | 69.2810 | 6.94 | 4 | |||||||
| 1347 | 73.2246 | 72.3514 | 6.67 | 4 | 2 | ||||||
| 1364 | 74.8847 | 66.5081 | 7.32 | 3 | |||||||
| 1368 | 75.8687 | 66.1220 | 7.37 | 2 | 5 | ||||||
| 1372 | 87.2271 | 72.4007 | 7.00 | 4 | 5 | ||||||
| 1374 | 87.0527 | 72.4243 | 7.83 | 3 | 5 | ||||||
| 1376 | 86.8816 | 73.2954 | 7.34 | 2 | 5 | ||||||
| 1391 | 85.5634 | 68.2017 | 6.50 | IRIRAS 054246813 | 4 | ||||||
| 1394 | 85.9433 | 67.4572 | 7.06 | *TRM 35 | 4 | 3 | 2 | ||||
| 1421 | 85.2201 | 64.2655 | 7.13 | 2 | |||||||
| 1423 | 86.0165 | 65.8995 | 6.44 | IRIRAS 054396555 | 4 | ||||||
| 1425 | 84.8841 | 66.0179 | 7.15 | 2 | 5 | ||||||
| 1426 | 85.3214 | 65.9173 | 7.44 | 3 | 5 | ||||||
| 1427 | 85.5904 | 64.8141 | 7.76 | 3 | 5 | ||||||
| 1450 | 85.7702 | 68.0107 | 7.25 | 2 | |||||||
| 1469 | 87.6096 | 69.9341 | 6.68 | 2 | |||||||
| 1496 | 87.8891 | 71.3262 | 7.20 | IRIRAS 055227120 | 4 | ||||||
| 1510 | 89.6105 | 73.3487 | 7.44 | 3 | 4 | ||||||
| 1518 | 90.5301 | 72.4556 | 6.04 | 4 | |||||||
| 1558 | 87.7577 | 66.3156 | 7.27 | 2 | 5 | ||||||
| 1559 | 87.2860 | 65.6227 | 7.63 | 3 | 3 | ||||||
| 1562 | 86.7848 | 64.6343 | 7.57 | 3 | 5 | 2 | |||||
| 1565 | 88.6607 | 64.9388 | 3.29 | 2.91 | 2.75 | 1.81 | M | *WOH G 622 | 4 | 3 | |
| 1574 | 88.2760 | 65.8905 | 7.34 | 2 | 4 | ||||||
| 1585 | 87.7560 | 66.6313 | 7.23 | 3 | 4 | ||||||
| 1588 | 87.1242 | 66.1807 | 7.59 | 3 | 5 | ||||||
| 1592 | 89.1615 | 67.8929 | 5.81 | C*IRAS 055686753 | 4 | ||||||
| 1601 | 89.6088 | 69.7401 | 7.06 | IRIRAS 055886944 | 4 | 4 | |||||
| 1603 | 90.1559 | 69.7474 | 7.07 | 2 | 4 | ||||||
| 1606 | 88.6677 | 70.2485 | 7.45 | 3 | 5 | ||||||
| 1612 | 91.4862 | 72.6481 | 4.10 | 3.31 | M4 | *HD 271928 | 4 | 3 | |||
| 1615 | 90.2007 | 73.2832 | 7.16 | 2 | 5 | 2 | |||||
| 1616 | 91.4891 | 73.3671 | 7.40 | 3 | 4 | ||||||
| 1617 | 92.1600 | 73.3898 | 7.44 | 3 | 4 | ||||||
| 1623 | 94.0324 | 73.1784 | 7.20 | 2 | 4 | ||||||
| 1630 | 91.6009 | 71.2280 | 7.32 | 3 | 5 | ||||||
| 1634 | 93.1559 | 71.9089 | 7.44 | 3 | 4 | ||||||
| 1647 | 89.0121 | 67.9521 | 7.23 | 2 | 5 | ||||||
| 1648 | 91.5333 | 69.1539 | 7.29 | 2 | 5 | ||||||
| 1649 | 90.5638 | 69.5798 | 7.38 | 3 | 4 | ||||||
| 1654 | 89.6045 | 66.9275 | 7.16 | 2 | 5 | ||||||
| 1657 | 88.4999 | 67.0307 | 7.26 | 2 | 4 | ||||||
| 1661 | 90.6877 | 67.5763 | 7.35 | 3 | 4 | ||||||
| 1664 | 88.7482 | 65.9538 | 7.35 | 2 | 4 | ||||||
| 1683 | 90.1857 | 64.9369 | 7.23 | 2 | 3 | 2 | |||||
| 1693 | 90.4521 | 66.9300 | 7.26 | 2 | 5 | ||||||
| 1712 | 92.1238 | 69.1775 | 7.51 | 3 | 5 | ||||||
| 1713 | 92.9640 | 69.8555 | 7.67 | 3 | 4 | ||||||
| 1718 | 93.3395 | 71.2765 | 7.42 | 3 | 4 | ||||||
| 1720 | 94.9976 | 72.7518 | 4.09 | M2 | *HD 272138 | 4 | 3 | ||||
| 1733 | 95.2990 | 72.2156 | 7.51 | 3 | 5 | ||||||
| 1740 | 93.3803 | 70.7388 | 7.25 | 2 | 4 | ||||||
| 1762 | 71.8456 | 71.2150 | 7.29 | 2 | 5 | ||||||
| 1764 | 74.0195 | 70.4696 | 7.30 | 2 | 5 | ||||||
| 1769 | 76.7236 | 65.7881 | 7.22 | 2 | 4 | ||||||
| 1770 | 77.9071 | 64.2270 | 7.04 | 2 | 3 | ||||||
| 1773 | 78.4313 | 72.3520 | 7.04 | 2 | 4 | ||||||
| 1783 | 82.7823 | 73.0388 | 7.11 | 2 | 4 | ||||||
| 1790 | 84.2975 | 66.8662 | 7.01 | 2 | |||||||
| 1792 | 83.9179 | 64.1715 | 6.92 | 2 | |||||||
| 1796 | 84.9444 | 69.2161 | 7.04 | 2 | 3 | ||||||
| 1800 | 86.5976 | 72.3855 | 7.26 | 2 | 3 | ||||||