email: pcoelho@usp.br, barbuy@iagusp.usp.br, thais@iagusp.usp.br 22institutetext: Observatoire de Paris, 61 av. de l’Observatoire, 75014 Paris, France
email: Marie-Noel.Perrin@obspm.fr 33institutetext: Observatório Nacional, rua General José Cristino 77, 20921-400 Rio de Janeiro, Brazil and Present address: UCO/Lick Observatory, University of California, Santa Cruz CA 95064, USA
email: ripisc@ucolick.org 44institutetext: Università di Padova, Dept. di Astronomia, Vicolo dell’Osservatorio 5, I-35122 Padova, Italy
email: ortolani@pd.astro.it 55institutetext: Universidade Federal do Rio Grande do Sul, Dept. de Astronomia, CP 15051, Porto Alegre 91501-970, Brazil
email: bica@if.ufrgs.br
Membership of 23 stars towards the bulge globular clusters NGC 6528 and NGC 6553 ††thanks: Observations collected at the European Southern Observatory - ESO, Chile
Low resolution spectra of 23 stars towards the bulge globular clusters NGC 6528 and NGC 6553 are analysed. Radial velocities and atmospheric parameters are derived in order to check their membership in the clusters. Effective temperatures were obtained from photometric data for stars with Teff 3800 K, whereas for cooler stars, they were derived from equivalent widths of TiO bands. Calibrations of W(TiO) as a function of stellar parameters based on a grid of synthetic spectra are presented. Metallicities were derived from a comparison of the observed spectra to a grid of synthetic spectra. The sample comprises evolutionary stages from the Red Giant Branch to the Horizontal Branch, with parameters in the range 3200 5000 K and -0.5 log g 2.4. The mean metallicities obtained for NGC 6528 and NGC 6553 are [Fe/H] -0.5 and -0.7, in both cases with [Mg/Fe] = +0.3; assuming the same overabundance for the elements O, Mg, Si, S, Ca and Ti, this gives [Z/Z⊙] = -0.25 and -0.45. Membership verification by means of low resolution spectra is a crucial step in preparing targets for high resolution spectroscopy with 8m class telescopes.
Key Words.:
Clusters: globular: NGC 6528, NGC 6553; Stars: abundances1 Introduction
The study of the stellar populations in the Galactic bulge is very important to constrain possible models of galaxy formation. In particular, the determination of the metallicities and abundance ratios of bulge stars, either from the field or in clusters, provides key information to help decide among the possible scenarios for the history of chemical enrichment of the Galaxy.
There are few previous studies of radial velocities and metallicity estimations of bulge stars from low resolution spectra. In the analysis of 400 field bulge stars by Sadler et al. (1996), metallicities and [Mg/Fe] values were estimated. Minniti (1995a,b) studied the membership of stars towards 7 bulge globular clusters.
The best studied among the bulge globular clusters are NGC 6528 ( = 18h04m49.6s, = -30o03’20.8”) and NGC 6553 ( = 18h09m15.7s, = -25o54’27.9”). Ortolani et al. (1995) have shown that, besides being old, these clusters have luminosity functions which are very similar to that of Baade’s Window, which indicates that they belong to the same stellar population.
NGC 6528 is located in the Baade Window, at a distance d⊙ = 7.83 kpc from the Sun, and NGC 6553 is relatively close to the Sun, at a distance d⊙ = 5.1 kpc (Barbuy et al. 1998). As they are both located in crowded fields, the measurement of radial velocities of individual stars is of crucial importance for the determination of their membership in the clusters.
Both clusters are known to be metal-rich. However, there is no consensus in the literature regarding their detailed metal abundances. Recently, Barbuy et al. (1999) analysed high resolution spectra of two giant stars of NGC 6553. An Iron abundance of [Fe/H] = -0.550.2 and abundance ratios [Na/Fe] [Al/Fe] [Ti/Fe] +0.5, [Mg/Fe] [Si/Fe] [Ca/Fe] +0.3 were derived. These ratios imply an overall metallicity [Z/Z⊙] -0.1. Cohen et al. (1999), analysing high resolution spectra of five red horizontal branch stars, obtained a mean metallicity [Fe/H] = -0.16 and an excess of the -element calcium to iron of about 0.3 dex, which imply an overall metallicity [Z/Z⊙] +0.1. Metal abundances of these clusters are also discussed in Barbuy et al. (1999) and Barbuy (2000).
In view of the disagreement between previous determinations of [Fe/H], it is important that abundance estimations be extended to a larger number of stars of both clusters. In this paper, we determine radial velocities, effective temperatures, gravities and estimations of metallicities [Fe/H] based on low resolution spectra for 23 stars towards NGC 6553 and NGC 6528, and verify their membership in these clusters.
In Sect. 2 the observations are described. The radial velocities derived are presented in Sect. 3. In Sect. 4 the stellar parameters are derived, and synthetic spectra are compared to observations to estimate metallicities. Concluding remarks are given in Sect. 5.
2 Observations
Low resolution spectra of individual stars of NGC 6528 and NGC 6553 were obtained in 1992 August and 1994 June, at the 1.5m ESO telescope at ESO (La Silla). The Boller & Chivens spectrograph was employed. In 1992 August the Thompson CCD # 18 with 10241024 pixels, with a pixel size of 19 m was used. A resolution of 8 Å and a spectral coverage of 4800-8800 Å were achieved. In 1994 June, the Ford Aerospace FA 2048 L, frontside illuminated, uncoated CCD detector (ESO # 24) with 20482048 pixels and pixel size 1515 m was used. The grating # 27 resulted in a spectral resolution 4 Å and a spectral coverage in the range 4800-7550 Å.
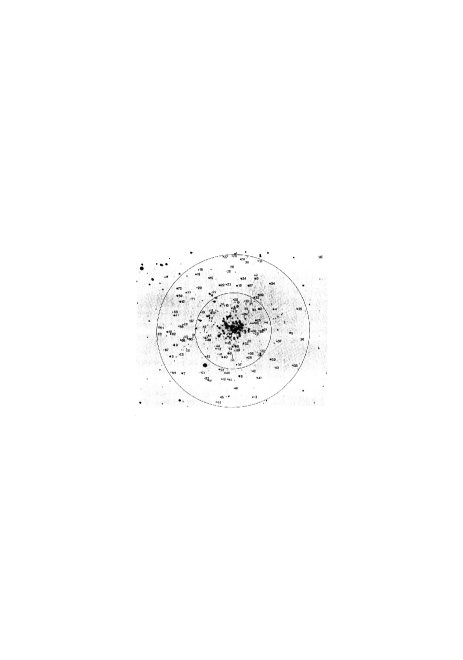
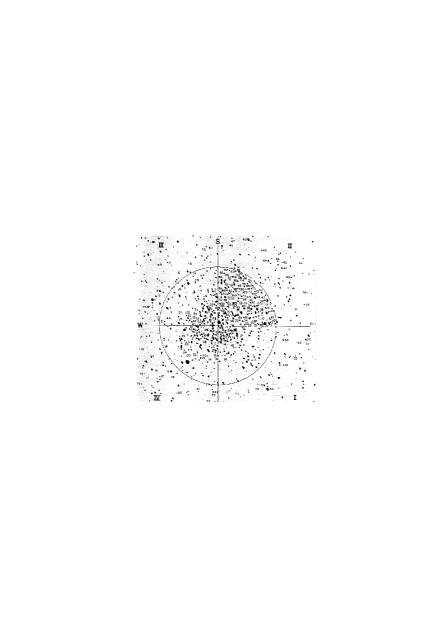
The log of observations is provided in Table 1. The stars are identified according to the charts by Hartwick (1975) for NGC 6553 and van den Bergh & Younger (1979) for NGC 6528. Spectra of a given star were co-added by weighting their S/N ratios; the final S/N are indicated in Table 1.
| Star | V | V-I | Exp. (s) | Date | S/N |
| NGC 6528 | |||||
| I 1 | 16.10 | 1.93 | 5400 | 06.08.92 | 190 |
| I 2 | 15.73 | 2.59 | 1800 | 16.06.94 | 25 |
| 5400 | 06.08.92 | 75 | |||
| I 5 | 15.37 | 2.22 | 2700 | 17.06.94 | 20 |
| I 6 | 15.89 | 3.54 | 2700 | 17.06.94 | 40 |
| II 8 | 15.71 | 2.19 | 2100 | 17.06.94 | 20 |
| II 14 | 15.76 | 3.47 | 2700 | 17.06.94 | 10 |
| I 23 | 17.19 | 1.70 | 1800 | 16.06.94 | 10 |
| I 24 | 16.89 | 1.66 | 4500 | 17.06.94 | 20 |
| I 25 | 16.11 | 2.09 | 4500 | 16,17.06.94 | 40 |
| I 27 | 15.90 | 3.08 | 1800 | 16.06.94 | 20 |
| 5400 | 06.08.92 | 100 | |||
| I 36 | 16.41 | 1.98 | 2100 | 17.06.94 | 20 |
| II 39 | 15.88 | 2.30 | 2100 | 17.06.94 | 30 |
| I 40 | 15.93 | 2.08 | 2100 | 17.06.94 | 20 |
| I 42 | 16.42 | 2.15 | 2100 | 17.06.94 | 30 |
| II 70 | 15.85 | 2.36 | 1800 | 16.06.94 | 20 |
| NGC 6553 | |||||
| III 2 | 16.89 | 1.95 | 1800 | 16.06.94 | 20 |
| III 3 | 15.82 | 2.41 | 3600 | 14,16.06.94 | 25 |
| 5400 | 07.08.92 | 100 | |||
| III 17 | 15.36 | 3.01 | 1800 | 14.06.94 | 30 |
| II 51 | 15.48 | 2.54 | 1800 | 17.06.94 | 10 |
| 5400 | 07.08.92 | 80 | |||
| II 52 | 16.84 | 1.93 | 1800 | 17.06.94 | 40 |
| 5400 | 07.08.92 | 230 | |||
| II 85 | 15.52 | 2.51 | 3600 | 14,16.06.94 | 55 |
| II 94 | 15.44 | 3.38 | 1800 | 17.06.94 | 20 |
| II 95 | 15.73 | 2.64 | 1800 | 17.06.94 | 35 |
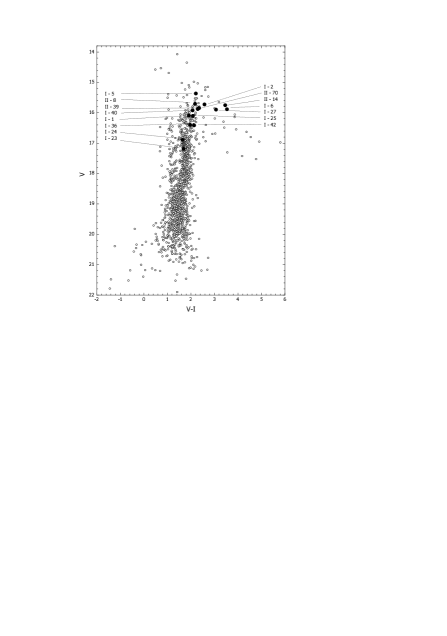
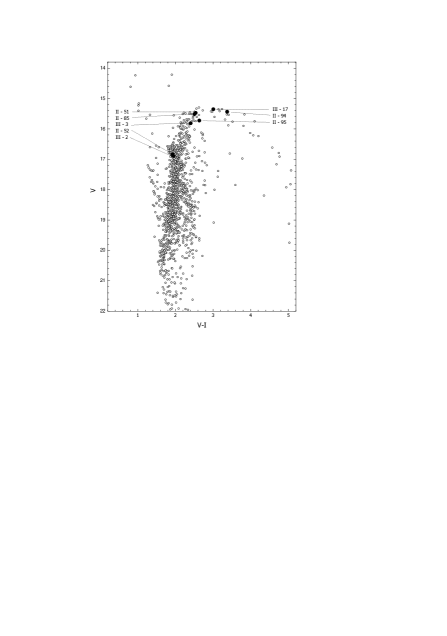
In Figs. 1 and 2 are shown the vs. Colour-Magnitude Diagrams of NGC 6528 and NGC 6553 using data obtained with the Hubble Space Telescope (Ortolani et al. 1995) where the sample stars are identified.
3 Radial velocities
The radial velocities were determined by means of three methods, as explained below and reported in Table 2. The observed radial velocities derived were transformed to heliocentric values using the observation dates given in Table 1.
(a) A Fourier cross-correlation was applied on the program spectra relative to selected template spectra. As templates, 12 G, K and M stars were selected from the Jacoby et al.’s (1984) library, which have approximately the same spectral resolution (4.5 Å) of the sample spectra. The templates adopted were the ones closest in spectral type to each of the program stars. The spectra of both sample and template stars were normalized and different regions in the spectra were defined in order to give highest peaks of cross-correlation for each considered template. The results obtained with this method are given in column 2 of Table 2. The r.m.s. of the values derived with each template spectrum is of the order of 15 km s-1. A systematic effect was identified for the coolest stars, since all of them appeared to show lower velocities when compared to the hotter stars of the same cluster and these values were not considered.
(b) Mean shifts between the observed wavelengths of identified absorption lines and laboratory wavelengths were measured (column 3 of Table 2). The r.m.s. of the values derived is of the order of 15 km s-1.
(c) the code HALO (Cayrel et al. 1991) derives radial velocities by comparing the observed spectrum to a grid of synthetic spectra, using a cross-correlation technique. The grid of synthetic spectra available (Barbuy et al. 2001) does not contain stars cooler than Teff 4000 K, and for this reason the errors should be higher for velocities of stars cooler than Teff 3700 K in which TiO bands are pronounced.
| Star | vr (km s-1) | ||
|---|---|---|---|
| method (a) | method (b) | method (c) | |
| NGC 6528 | |||
| I 1 | — | 262 | 174 |
| I 2 | 224 | 262 | 208 |
| I 5 | — | 261 | 224 |
| I 6 | 232 | 246 | 225 |
| II 8 | 289 | 283 | 271 |
| II 14 | — | 264 | 227 |
| I 23 | 221 | 251 | — |
| I 24 | 238 | 220 | 202 |
| I 25 | 265 | 257 | 231 |
| I 27 | — | 237 | 188 |
| I 36 | 244 | 249 | 229 |
| II 39 | 30 | 17 | 7 |
| I 40 | 246 | 236 | 244 |
| I 42 | 197 | 235 | 212 |
| II 70 | 230 | 263 | — |
| NGC 6553 | |||
| III 2 | -2 | -7 | -25 |
| III 3 | 5 | 17 | 18 |
| III 17 | 3 | 8 | -19 |
| II 51 | — | 60 | — |
| II 52 | -16 | -28 | -33 |
| II 85 | 35 | 56 | -4 |
| II 94 | -42 | -56 | -63 |
| II 95 | 11 | -12 | -9 |
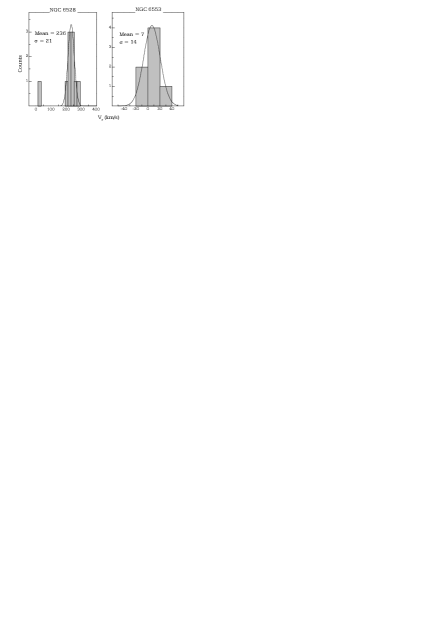
Histograms of radial velocities of individual stars (coolest stars excluded) corresponding to each method were built. Gaussian curves were fitted to each histogram, from which the radial velocity corresponding to each method was derived, as reported in Table 3 together with values from the literature. An example of this procedure is presented in Fig. 3 for the cross-correlation technique using IRAF. The final radial velocities adopted for the clusters correspond to the mean of the values derived from the three methods.
| vr ( km s-1 ) | Reference | |
| NGC 6528 | NGC 6553 | |
| 218 | 6.4 | 1,2 |
| 164.8 | -24.5 | 3 |
| 208 | 48 | 4 |
| 212 | 8.4 | 5 |
| 189 | — | 6 |
| 160 | -5 | 7 |
| 143 | -12 | 8 |
| 236 (21) | 7 (14) | 9 |
| 248 (11) | 1 (16) | 10 |
| 217 (9) | -10 (13) | 11 |
References to Table: 1 Barbuy et al. (1999); 2 Barbuy (2000); 3 Harris (1996); 4 Minniti (1995) (mean values excluding non-member stars); 5 Rutledge et al. (1997); 6 Armandroff & Zinn (1988); 7 Zinn & West (1984); 8 Zinn (1985); 9 present paper (cross-correlation method with IRAF; 10 present paper (mean wavelength shift with IRAF); 11 present paper (code HALO by a cross-correlation method)
4 Stellar parameters
4.1 Temperatures
The effective temperatures were estimated from , , and colours, based on the colour vs. Teff calibrations by Bessell et al. (1998), which in turn are based on NMARCS models by Plez et al. (1992) and their grid extensions. These effective temperatures are listed in Table 5. V and I colours were obtained with the Hubble Space Telescope (Ortolani et al. 1995) and J and K colours were obtained with the detector IRAC2 at the 2.2m telescope of ESO (Guarnieri et al. 1998).
For NGC 6528 the colour excesses adopted were E(VI) = 0.68 and E(BV) = 0.52 (Barbuy et al. 1998). For NGC 6553 E(VI) = 0.95 and E(BV) = 0.7 were adopted (Guarnieri et al. 1998). The and colours were dereddened assuming E(V-K)/E(B-V) = 2.744 and E(JK)/E(BV)=0.527 (Rieke & Lebofsky 1985).
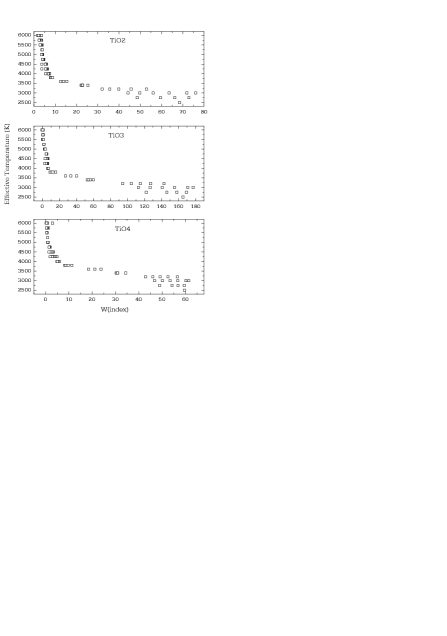
An independent method for the derivation of temperatures was based on calibrations of equivalent widths of TiO bands. The indices as defined in Table 4 were measured on the grid of synthetic spectra by Schiavon & Barbuy (1999) in the range of parameters 3000 5000 K, 0.5 log g 2.5 and [Fe/H] = 0.3. These indices are shown in Fig. 4 for a resolution of = 8 Å. Polynomial curves of the form Teff = f(W(TiO)) were derived and applied to the indices measured in the sample stars. The TiO indices are strongly sensitive to temperature for 3800 K as illustrated in Fig. 5. For 4000 K a degeneracy appears due to the fact that TiO bands are not present at these higher temperatures.

A more general polynomial of the form log W(TiO) = (a + b log Teff + c log + d [Fe/H] + e (log Teff)2 + f [Fe/H]2 + g [Fe/H] log Teff), valid in the range 2500 Teff 5000 K, -0.5 log g 2.5 and -0.5 Fe/H 0 was derived. The coefficients of the formula above are shown in Table 6 for convolutions of (FWHM) = 4 Å and 8 Å.
| Index | Blue continuum | Bandpass | Red continuum |
|---|---|---|---|
| TiO2 | 6033.6-6050.6 | 6300.0-6455.0 | 6525.0-6538.0 |
| TiO3 | 6525.0-6539.0 | 6617.6-6860.0 | 7036.0-7046.6 |
| TiO4 | 7036.0-7046.6 | 7053.0-7163.0 | 7534.2-7546.8 |
| Effective Temperatures (K) | ||||||||
| Star | TiO2 | TiO3 | TiO4 | Final | ||||
| NGC 6528 | ||||||||
| I 1 | 4305 | 4449 | — | — | — | — | — | 4400 |
| I 2 | 3673 | 3883 | — | — | 3922 | 3698 | 3506 | 3700 |
| I 5 | — | — | — | — | 3468 | 3053 | — | 3250 |
| I 6 | 3451 | 3890 | — | — | 3612 | 3585 | 3405 | 3550 |
| II 8 | 3963 | 3992 | — | — | 3776 | 4049 | 3789 | 3950 |
| II 14 | — | — | — | — | 3468 | 3053 | — | 3250 |
| I 23 | 4783 | 4770 | — | — | — | — | — | 4800 |
| I 24 | 4883 | 4707 | — | — | — | — | — | 4800 |
| I 25 | 4074 | 4092 | — | — | — | — | — | 4100 |
| I 27 | — | — | — | — | 3673 | — | 3001 | 3350 |
| I 36 | 4218 | 4216 | — | — | — | — | — | 4200 |
| I 40 | 4084 | 4137 | — | — | — | — | — | 4100 |
| I 42 | 3999 | 4149 | — | — | — | — | — | 4050 |
| II 70 | 3810 | 3951 | — | — | — | — | — | 3900 |
| NGC 6553 | ||||||||
| III 2 | 4828 | — | 4809 | 4559 | — | 3842 | 3776 | 3800 |
| III 3 | 4015 | — | 4221 | 3939 | 3782 | 3800 | 3775 | 3800 |
| III 17 | 3606 | — | 3966 | 3611 | 4052 | 3698 | 3503 | 3750 |
| II 51 | 3885 | — | 3966 | 3856 | 3281 | 3206 | — | 3250 |
| II 52 | — | — | — | — | 4241 | 3703 | 3752 | 3900 |
| II 85 | 3912 | — | 4140 | 3835 | — | — | — | 3950 |
| II 94 | 3506 | — | 3984 | 3432 | 4802 | 4408 | 3832 | 3650 |
| II 95 | — | — | — | — | — | — | — | 6500 |
The temperatures obtained and final values adopted are reported in Table 5. Photometric temperatures were adopted for stars for which the TiO temperature TTiO 3800 K, whereas for stars with TTiO 3800 K the mean of TiO temperatures were adopted.
| Coefficient | TiO2 | TiO3 | TiO4 | |||
|---|---|---|---|---|---|---|
| 4Å | 8Å | 4Å | 8Å | 4Å | 8Å | |
| a (constant) | 81.49 | 81.89 | 55.70 | 56.51 | -175.11 | -158.38 |
| b (log(Teff)) | -39.44 | -39.71 | -22.93 | -23.53 | 105.33 | 95.92 |
| c (log ) | -0.04 | -0.04 | -0.04 | -0.05 | -0.06 | -0.06 |
| d ([Fe/H]) | 9.28 | 9.14 | 3.40 | 3.21 | -7.42 | -5.10 |
| e (log(Teff)2) | 4.75 | 4.79 | 2.17 | 2.27 | -15.66 | -14.34 |
| f ([Fe/H]2) | -0.47 | -0.45 | -0.40 | -0.38 | -0.45 | -0.08 |
| g ([Fe/H] | ||||||
| log(Teff)) | -2.56 | -2.51 | -0.87 | -0.82 | 2.16 | 1.54 |
| 2 | 0.92 | 0.92 | 0.90 | 0.90 | 0.97 | 0.96 |
4.2 Gravities
Gravities were derived using the classical relation log g∗= 4.44 + 4log T∗/T⊙ + 0.4(Mbol-Mbol⊙) + log M∗/M⊙, adopting T⊙ = 5770 K, M∗ = 0.8 M⊙ and Mbol⊙ = 4.74 cf. Bessell et al. (1998). For deriving Mbol∗ we used the distance modulus adopting a total extinction AV = 2.43 for NGC 6553 and AV = 1.8 for NGC 6528 (Barbuy et al. 1998). The bolometric magnitude corrections were taken from Bessell et al. (1998).
The resulting Mbol∗ and gravities are given in Table 7. Taking into consideration the errors due to uncertainties in Teff and Mbol the final error in log g is estimated to be of 0.5 dex.
4.3 Metallicities
Spectrum synthesis calculations were used to fit the observed spectra. The calculations of synthetic spectra were carried out using the code described in Barbuy et al. (2000) where molecular lines of MgH A2-X2, CH A2-X2, CN A2-X2, C2 Swan A3-X3 and TiO C3-X3, A3-X3 and ’ B3-X3 systems are taken into account.
For atomic lines the laboratory oscillator strengths by Fuhr et al. (1988), Martin et al. (1988), Wiese et al. (1969), and laboratory values compiled by McWilliam & Rich (1994) were adopted whenever available, otherwise they were taken from fits to the solar spectrum (see discussion in Barbuy et al. 1999).
ATLAS9 and NMARCS models were employed. A grid of models using the ATLAS9 code (Kurúcz 1993) was created adopting a mixing length parameter = 0.5 (see Barbuy et al. 2001). NMARCS photospheric models for giants by Plez et al. (1992) and their unpublished extended grids were employed (see more details in Schiavon & Barbuy 1999).
The metallicities were obtained based on two methods, both using synthetic spectra:
(i) The observed spectra were compared to synthetic spectra in the range 5000–7500 . The metallicities were estimated by interpolating between synthetic spectra of [Fe/H]= 0.0, –0.3, –0.5 and –0.6, in all cases assuming [Mg/Fe] = +0.3, and the temperatures and gravities determined in Sects. 4.1 and 4.2.
(ii) Comparisons with a grid of synthetic spectra in the wavelength region 4600-5600 Å, using the differences method as described in Cayrel et al. (1991) and Barbuy et al. (2001), are carried out. In this method, the observed spectrum is divided by a reference synthetic spectrum. The resulting signal can be expressed as a linear combination of variations in temperature, gravity and metallicity. In conjunction with the grid of synthetic spectra, it is possible to establish the differences in Teff, log g and [Fe/H] between the program star and the reference synthetic spectrum through a perturbation method. The grid covers the range 4000 Teff 7000 K, 0.0 log g 5.0, -3.0 [Fe/H] +0.3, and [Mg/Fe] = 0.0 and +0.4. Fig. 6 shows the fit to NGC 6528 I-1.

In Table 7 are listed the temperatures, gravities, [Fe/H] and [Mg/Fe] obtained with methods (i) and (ii). Note that method (ii) tends to give lower metallicities relative to method (i). This may be due to limitations of the grid of synthetic spectra, which is being extended to cover wider ranges of parameters.
The stars NGC 6528 I-5, NGC 6553 III-2 and II-95 are probable non-members, given that their atmospheric parameters are incompatible with their location in the Colour-Magnitude Diagrams of the clusters. The star II-51 appears to be too cool (Table 7) with respect to its CMD locus (Fig. 2). However, considering that it could be a red variable, this star is tentatively classified as a possible member.
Mean metallicities of [Fe/H] = -0.5 for NGC 6528 and [Fe/H] = -0.7 for NGC 6553 were estimated from gaussian fits to the histograms of metallicities given in Table 7 (typical standard deviations are of 0.2 dex). These metallicities, together with the magnesium excess of [Mg/Fe] +0.3, and assuming that all other elements show an excess of +0.3 dex relative to iron, result in overall metallicities of [Z/Z⊙] = -0.25 and -0.45 for NGC 6528 and NGC 6553 respectively.
| Star | Mbol | log g | [Fe/H] | [Mg/Fe] | Method | |
|---|---|---|---|---|---|---|
| NGC 6528 | ||||||
| I 1 | -0.8 | 4400 | 1.7 | -0.4 | 0.3 | i |
| 4400 | 1.7 | -0.4 | 0.3 | ii | ||
| I 2 | -2.0 | 3700 | 0.9 | -0.5 | 0.3 | i |
| I 5 | – | 3250 | 0.7 | -0.5 | 0.3 | i |
| I 6 | -3.0 | 3550 | 0.4 | -0.6 | 0.3 | i |
| II 8 | -1.5 | 4000 | 1.2 | -0.5 | 0.3 | i |
| 4000 | 0.5 | -0.6 | 0.3 | ii | ||
| II 14 | -3.1 | 3250 | 0.2 | -0.5 | 0.3 | i |
| I 23 | 0.6 | 4800 | 2.4 | 0 | 0.3 | i |
| 4800 | 2.4 | -0.4 | 0.2 | ii | ||
| I 24 | 0.4 | 4800 | 2.3 | 0 | 0.3 | i |
| 4800 | 2.3 | -0.3 | 0.1 | ii | ||
| I 25 | -1.0 | 4100 | 1.4 | -0.6 | 0.3 | i |
| 4100 | 1.4 | -1.1 | 0.2 | ii | ||
| I 27 | -2.5 | 3350 | 0.5 | -0.3 | 0.3 | i |
| I 36 | -0.6 | 4200 | 1.7 | -0.6 | 0.3 | i |
| 4250 | 1.0 | -0.8 | 0.4 | ii | ||
| I 40 | -1.2 | 4100 | 1.4 | -0.4 | 0.3 | i |
| 4100 | 1.4 | -0.7 | 0.3 | ii | ||
| I 42 | -0.8 | 4050 | 1.5 | -0.4 | 0.3 | i |
| 4050 | 1.5 | -1.2 | 0.2 | ii | ||
| II 70 | -1.6 | 3900 | 1.1 | -0.6 | 0.3 | i |
| NGC 6553 | ||||||
| III 2 | – | 3800 | 2.0 | -0.7 | 0.3 | i |
| III 3 | -1.1 | 3800 | 1.3 | -0.7 | 0.3 | i |
| III 17 | -2.3 | 3750 | 0.8 | -0.7 | 0.3 | i |
| II 51 | – | 3250 | 0.8 | -0.4 | 0.3 | i |
| II 52 | 0.6 | 3900 | 2.0 | -0.6 | 0.3 | i |
| II 85 | -1.5 | 3950 | 1.2 | -0.6 | 0.3 | i |
| II 94 | -2.7 | 3650 | 0.6 | -1.1 | 0.3 | i |
| II 95 | – | 6500 | 2.7 | -0.4: | — | ii |
5 Conclusions
The study of individual stars in globular clusters along their evolutionary stages is of prime importance for an improved understanding of stellar evolution. Low resolution spectroscopy provides a means for the study of a large number of stars. In the present work we have measured radial velocities and estimated metallicities in 23 stars towards the globular clusters NGC 6528 and NGC 6553, which allows us to identify member stars. We also obtained their atmospheric properties to a first approximation. This is an important step before applying efforts to obtain high resolution spectroscopy with 8m class telescopes. The method presented here is also of interest for last generation multi-object instruments such as VLT-VIMOS.
The stars were analysed by comparisons between their observed spectra and a grid of synthetic spectra. TiO equivalent widths were used to estimate effective temperatures of stars cooler than 3800 K and a calibration of equivalent widths of TiO bands as a function of atmospheric parameters is presented.
Mean values of heliocentric radial velocities of vr = 234 km s-1 for NGC 6528 and vr = -1 km s-1 for NGC 6553 are derived.
Regarding membership, among the 23 stars observed we concluded that 4 of them are probable non-members. These are: NGC 6528 II-39, non-member due to a deviant radial velocity, and NGC 6528 I-5, NGC 6553 III-2 and II-95, non-members due to incompatibilities of atmospheric parameters vs. location in the Colour-Magnitude Diagrams.
NGC 6553 II-51 could be a non-member, or a red variable for which the spectrum was taken during a cool phase.
The basic stellar parameters derived show the interesting result that there is a trend for member giants of NGC 6528 to be more metal-poor than the two Horizontal Branch stars NGC 6528 I-23 and I-24, thus reproducing the discrepancy found between analysis of NGC 6553 giants by Barbuy et al. (1999) and Horizontal Branch stars by Cohen et al. (1999). Given the errors involved in the analysis of low resolution spectra, these results have to be checked with high resolution spectra, and further studies of this discrepancy will be possible only with a homogeneous analysis of stars ranging from the red giant branch to the HB, and also employing different sets of model atmospheres all along the evolutionary sequence.
In summary, we obtained for NGC 6528 and NGC 6553 metallicities of [Fe/H] = -0.5 0.3 and [Fe/H] = -0.7 0.3. Using [Mg/Fe] +0.3, and assuming that other elements show the same excess of +0.3 dex relative to iron, the results are [Z/Z⊙] = -0.25 and -0.45 for NGC 6528 and NGC 6553 respectively.
Acknowledgements.
We are grateful to A. Milone for having carried out part of the observations. We acknowledge partial financial support from CNPq and Fapesp. P. Coelho and T. Idiart acknowledge respectively the Fapesp Master fellowship no 98/07492-4, and Post-Doc fellowship no 97/13083-7. RPS acknowledges support provided by the National Science Foundation through grant GF-1002-99 and from the Association of Universities for Research in Astronomy, Inc., under NSF cooperative agreement AST 96-1361.References
- (1) Armandroff T.E., Zinn R., 1988, AJ 96, 92
- (2) Barbuy B., Bica E., Ortolani S., 1998, A&A 333, 117
- (3) Barbuy B., 2000, in The Chemical Evolution of the Milky Way: Stars vs. Clusters, Eds. F. Matteucci, Kluwer Acad. Pub., in press
- (4) Barbuy B., Renzini A., Ortolani S., Bica E., Guarnieri M.D., 1999, A&A 341, 539
- (5) Barbuy B., Perrin M.-N., Katz D., Cayrel R., Spite M., van ’t Veer-Menneret C., 2001, A&A, submitted
- (6) Bessell M.S., Castelli F., Plez B., 1998, A&A 337, 321
- (7) Carretta E., Gratton R.G., 1997, A&AS 121, 95
- (8) Cohen J.G., Gratton R.G., Behr B.B., Carretta E., 1999, ApJ 523, 739
- (9) Fuhr J.R., Martin G.A., Wiese W.L., 1988, Atomic Transition Probabilities: Iron through Nickel, Journal of Physical and Chemical Reference Data, vol. 17, no. 4
- (10) Guarnieri M.D., Ortolani S., Montegriffo P., Renzini A., Barbuy B., Bica E., Moneti A., 1998, A&A 331, 70
- (11) Cayrel R., Perrin M.-N., Barbuy B., Buser R., 1991, A&A 247, 108
- (12) Harris W.E., 1996, AJ 112, 1487
- (13) Hartwick F.D.A., 1975, PASP 87, 77
- (14) Jacoby G.H., Hunter D.A., Christian C.A., 1984, ApJ 419, 592
- (15) Kurúcz, R., 1993, CD-ROM 18
- (16) Martin G.A., Fuhr J.R., Wiese W.L., 1988, Atomic Transition Probabilities: Scandium through Manganese, Journal of Physical and Chemical Reference Data, vol. 17, no. 3
- (17) McWilliam A., Rich R.M., 1994, ApJS 91, 749 (MR)
- (18) Minniti D., 1995a, A&A 303, 468
- (19) Minniti D., 1995b, A&AS 113, 299
- (20) Schiavon R.P., Barbuy B., 1999, ApJ 510, 934
- (21) Ortolani S., Renzini A., Gilmozzi R., Marconi G., Barbuy B., Bica E., Rich R.M., 1995, Nature 377, 701
- (22) Plez B., Brett J.M., Nordlund , 1992, A&A 256, 551
- (23) Rieke G.H., Lebofsky M.J., 1985, ApJ 288, 618
- (24) Rutledge G.A., Hesser J.E., Stetson P.B., Mateo M., Simard L., Bolte M., Friel E.D., Copin Y., 1997, PASP 109, 883
- (25) Sadler E., Rich R.M., Terndrup D.M., 1996, AJ 112, 171
- (26) van den Bergh S., Younger F., 1979, AJ 84, 1305
- (27) Wiese W.L., Martin G.A., Fuhr J.R., 1969, Atomic Transition Probabilities: Sodium through Calcium, NSRDS-NBS 22
- (28) Zinn R., 1985, ApJ 293, 424
- (29) Zinn R., West, M.J., 1984, ApJS 55, 45