The beaming pattern and spectrum of radiation from inverse Compton scattering in blazars
Abstract
By including Klein–Nishina effects, we generalize previous calculations of the beaming pattern of photons produced by inverse Compton scattering. For an isotropic distribution of soft photons upscattered by nonthermal electrons with a power-law density distribution , embedded in a plasma moving with relativistic bulk speed we show that the observed radiation intensity is proportional to , where is the Doppler boosting factor. This agrees with previous computations performed in the Thomson limit, where the observed spectral index is and the beaming pattern . Independent of , Klein–Nishina effects limit the location of the peak energy of the observed spectral energy distribution such that , where is the energy of the seed photons in units of . Assuming that the seed photons originate in the broad line region, we demonstrate that the GeV emission of blazars is significantly modified by Klein–Nishina effects, the spectrum being softer than that calculated in the Thomson limit. We further show that the change in spectral index of the inverse Compton emission across can exceed the value of predicted by computations performed in the Thomson limit. The model spectra agree with OSSE and COMPTEL limits on this break without invoking the effects of differential absorption at the edge of a gamma-ray photosphere.
1 Introduction
Inverse Compton scattering, a process in which a nonthermal distribution of electrons boosts the energy of a ‘seed’ or ‘target’ photon by a large factor, is commonly thought to be responsible for the production of gamma-ray photons in blazars (Ulrich, Maraschi, & Urry, 1997). For very high energy electrons, the scattered photon can carry off a substantial fraction of the energy of the incoming electron. There have been several suggestions concerning the source of the target photons: optical/UV photons from an accretion disk (Dermer, Schlickeiser, & Mastichiadis, 1992; Böttcher, Mause & Schlickeiser, 1997), optical photons from the broad line region and infrared dust photons (Sikora, Begelman, & Rees, 1994; Blazejowski et al., 2000). The radiation mechanism for such targets is usually called external Comptonization (‘EC’). Synchrotron photons produced in the jet can also act as seed photons for inverse Compton scattering, a process referred to as synchrotron self-Compton (‘SSC’) scattering (Maraschi, Ghisellini, & Celotti, 1992; Bloom & Marscher, 1996; Inoue & Takahara, 1996; Mastichiadis & Kirk, 1997). The same synchrotron photons can serve as seed photons after being reflected back into the jet from the broad line clouds (Ghisellini & Madau, 1996). In those blazars that have strong emission lines, the EGRET-detected GeV emission is probably dominated by inverse Compton scattering of the broad line photons (Sikora, Begelman, & Rees, 1994; Sikora, et al., 1997). In this case, the plasma responsible for the GeV emission moves relativistically with a bulk Lorentz factor through an approximately isotropic photon field.
For such a ‘blob’ of plasma moving with velocity , at an angle to the observer’s line of sight, the beaming pattern of the observed power per unit solid angle and per unit frequency is for any process in which the emission is isotropic in the frame comoving with the blob (the ‘blob frame’). Here, is the familiar Doppler factor with , and is the spectral index of the radiation. An isotropic electron distribution and a tangled magnetic field, produce, in the blob frame, isotropic synchrotron and SSC emission, which is, therefore, characterized by this beaming factor (Begelman, Blandford, & Rees, 1984). The situation is different for inverse Compton scattering of photons on targets which are approximately isotropic not in the blob frame, but in the rest frame of the broad line region (‘lab. frame’). In the Thomson limit, Dermer (1995) has shown that the beaming pattern in this case is . In terms of the power-law index of the electron distribution, this is equivalent to . In § 2 we show that this expression arises immediately from the transformation properties of the electron distribution and is valid for arbitrary electron energy. Thus, in the case of EC emission, the beaming is most simply expressed in terms of the underlying electron distribution, whereas for SSC and synchrotron emission it can be obtained straightforwardly from the observed photon distribution. In addition to the beaming pattern for a power-law distribution, Dermer (1995) also demonstrated that a characteristic energy, such as a cut-off or break in the spectrum, is observed at a photon energy that scales as . This contrasts with the situation for synchrotron and SSC radiation, where the scaling is linear with . Once again, the difference can be understood from the transformation properties of electrons and photons, respectively. We show that the scaling changes when Klein-Nishina (‘KN’) effects intervene: for hard electron distributions () with an upper cut-off, the peak in the spectral energy distribution is limited to a value that is independent of , where is the energy of the seed photons in units of . (Energy units of are used throughout this work.)
Assuming that the EGRET-detected GeV emission from blazars is due to inverse Compton scattering of broad line region photons we show in § 3 that the spectra are significantly affected by KN effects, which result in a softening of the EGRET spectrum. This effect has been noted in connection with blazar spectra by Böttcher, Mause & Schlickeiser (1997), who computed model spectra using anisotropically distributed accretion disk photons as targets, rather than photons from the broad line region. We map the observed EGRET spectral indices to the index of the electron distribution, and find that these are grouped around the value , in agreement with recent theoretical work on particle acceleration in relativistic shocks (Bednarz & Ostrowski, 1998; Kirk et al., 2000; Achterberg et al., 2001). Synchrotron cooling or, alternatively, cooling by IC scattering in the Thomson limit produces a break of in the electron spectrum. The spectrum of IC radiation in the Thomson limit therefore shows a break of . However, some -ray sources that peak at MeV energies show a more pronounced break (McNaron-Brown et al., 1995), which has been interpreted as evidence for gamma-ray absorption by pair production (Blandford & Levinson, 1995; Marcowith, Henri & Pelletier, 1995). We show that spectral softening can explain these observations, provided the electron distribution is determined by synchrotron cooling. A summary of our results and their implications is presented in § 4.
2 The beaming pattern of inverse Compton radiation
Consider a blob of plasma moving relativistically with a bulk Lorentz factor and velocity , at an angle to the observer’s line of sight. In the frame of the blob the electrons are characterized by an isotropic power-law density distribution ,
| (1) |
where is the Lorentz factor of the electron, is a constant, and for , and zero otherwise. Under the assumption that , one can treat the electrons as a photon gas and make use of the Lorentz invariant quantity . The Lorentz factor of an electron in the lab. frame is then and the electron density in the lab. frame is
| (2) |
Given that the effective volume of the blob is (see Appendix A), where is the volume of the blob in the blob frame, the energy distribution of the effective number of electrons is:
| (3) |
Consider now that this electron distribution will Compton–scatter seed photons of an arbitrary angular distribution. Since , we can make the approximation usually made in synchrotron theory that the outgoing photons move in the same direction as the scattering electron. Therefore, when observing under a certain angle only electrons moving in this direction contribute to the Compton luminosity. Since the effective number of these electrons is proportional to , the Compton specific luminosity (observed luminosity per energy interval per solid angle) is also proportional to . Different seed photon angular distributions will introduce an angle–dependent multiplication term in the calculation of the external Compton luminosity. An extreme case of a photon angular distribution is a monodirectional photon beam propagating along the direction of motion of the blob, for which Dermer, Schlickeiser, & Mastichiadis (1992) calculated the beaming factor of Compton scattering to be . Note here that for the inverse Compton luminosity is zero. It can easily be shown that for a monodirectional photon beam propagating in the direction opposite to the direction of motion of the blob, as may be the case for the mirror model of Ghisellini & Madau (1996), the beaming factor is .
We now consider that the plasma blob is propagating through an environment permeated by an isotropic monoenergetic photon field of energy density . The lab. frame rate of scatterings per final photon energy interval for an electron of Lorentz factor is:
| (4) |
where is the Thomson cross section. Jones (1968) introduced the ‘head-on’ approximation in which the seed photons are treated as coming from the direction opposite to the electron velocity. Using this, which is valid for for , and the full KN cross-section for inelastic Compton scattering, he showed that
| (5) | |||
The maximum observed energy is
| (6) |
In the case of Thomson scattering (), Rybicki & Lightman (1979), assuming isotropic scattering in the electron frame, showed that
| (7) |
and that the maximum observed final energy is .
We now make the approximation that the outgoing photons are directed along the direction of the scattering electrons, which is justified provided the electron angular distribution varies slowly over angular scales . To obtain the specific luminosity one integrates the scattering rate (4) over the electron energy distribution (3), and multiplies the result by the observed photon energy and by the photon number density
| (8) |
In the Thomson case, for energies , where , the lower limit of the integration in equation (8) is , and the upper limit is . Performing the elementary integral using equation (7) we obtain:
| (9) | |||
For and we have . Since the integrand is then steeper than , the above result simplifies to
| (10) |
The beaming of the observed radiation is the direct outcome of the electron beaming, and it is characterized by the electron index . In the Thomson limit, the resulting spectrum is a simple power law with a spectral index and one can substitute for in equation (10) to recover the beaming pattern (equation 7 of D95). The spurious term in the result of D95, which, however, varies only slowly with for viewing angles of interest, was introduced by the approximation that the seed photons in the frame of the blob are coming from a direction opposite to the direction of the velocity of the blob. In both D95 and here the maximum observed energy , as well as any other characteristic energy, scale as , whereas in synchrotron and SSC they scale as . If, instead of observing at a fixed energy, we are interested in the specific luminosity measured at a break or cut-off in the spectrum, then the scaling of the break energy introduces an additional factor, so that the specific luminosity at the break scales as . The luminosity per logarithmic energy interval of the spectral feature, given by , then scales as , since .
In the KN case, for energies , where , the lower limit of integration in equation (8) is found by setting
| (11) |
In this case the integrand is also steeper that , and for , the integration is dominated by the lower limit which is independent of . Therefore, the beaming pattern is also valid in the general case of KN scattering. The maximum energy is given by equation (6), which is reduced to when the high energy tail of the electron energy distribution is well into the KN regime, , a behavior similar to that of synchrotron and SSC emission maximum observed energies. For electron indices , cannot exceed significantly the energy at which KN effects become important and the scattering cannot be considered elastic. For a given seed photon energy this sets in for electrons with energies . Setting this limiting value of in equation (6) we obtain , independent of and , provided the system is well into the KN regime, .
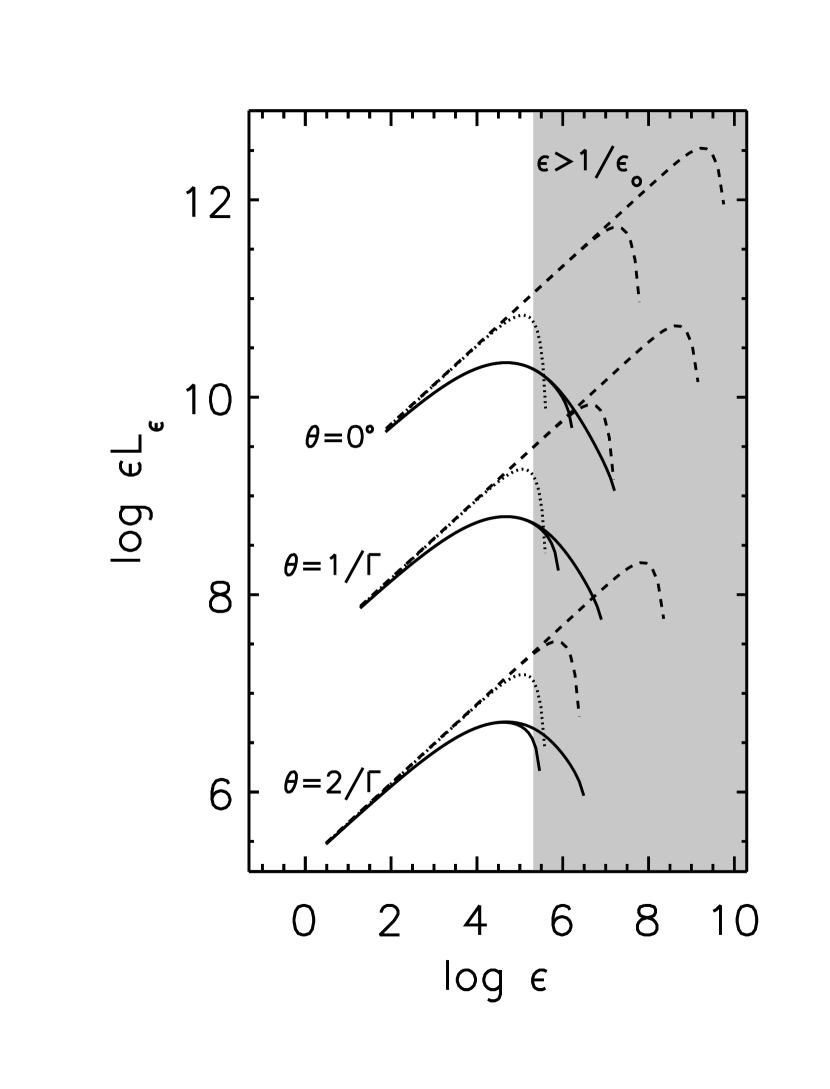
We demonstrate these points in figure 1, where we plot the inverse Compton spectral energy distribution for three different observing angles for both the Thomson and KN cases and for two different values of . We also plot the spectral energy distribution calculated using the approximation for , otherwise (e.g. Chiaberge and Ghisellini 1999, Blazejowski et al. 2000). In the Thomson case we use the analytical expression (2), while in the KN case we perform the integration in equation (8) numerically. The Thomson and the Klein Nishina distributions deviate from each other with the KN spectrum being softer. Note that the deviation is already significant at , which corresponds approximately to electrons with Lorentz factor in the lab. frame. Therefore, already at , the Thomson description is inadequate, and the KN formalism must be used. Both the maximum and peak energy of the Thomson spectral energy distribution scale as . Contrary to this behavior, in the KN case the maximum energy scales as , whereas the peak energy is insensitive to variations of both and and it is located at an energy . The exact value of is a function of the electron index , with steeper electron power laws being characterized by lower values. An increase in the upper cut-off of the electron distribution by a factor of 10 affects only the steep high energy tail of the observed KN spectral energy distribution, leaving the peak energy and the peak luminosity unchanged. In general, as long as the scattering is KN limited ( ) , the peak energy will be insensitive to variations of both and , in contrast to the Thomson calculation and the synchrotron and SSC cases. The result based on the step function cross section for , otherwise is practically identical to the Thomson one, up to the cutoff energy . In the case of external Compton scattering of optical-UV photons in blazars, where GeV, the spectrum calculated under this approximation in the EGRET regime is for practical purposes the same as that calculated in the Thomson regime.
As shown in figure 1, the KN spectral energy distribution resulting from a power law electron energy distribution is not a power law, and one cannot assign a unique spectral index to it. The beaming pattern at a given energy is expressed through the electron index and is not a simple function of the local spectral index — different parts of the spectrum have the same beaming pattern independent of the local spectral index. This is in contrast to synchrotron and SSC emission from a power law electron distribution, where the beaming pattern depends only on the local spectral index, the steeper parts of the spectrum having a more pronounced beaming behavior.
3 Applications to blazars
The spectra of the EGRET-detected blazars (Hartman, et al., 1999) are described by simple power laws over the energy range MeV – GeV with no indication of a cut-off at high energy. The photon indices of those EGRET-detected blazars that display strong emission lines cluster around (Mukherjee, et al., 1997), indicating that the peak energy of the –ray spectral energy distribution in general lies at energies below the EGRET range. X-ray (e.g., Kubo et al., 1998) OSSE, and COMPTEL observations (McNaron-Brown et al., 1995) confine this peak to between about and MeV.
If the observed radiation is inverse Compton emission from optical/UV broad line seed photons (), a peak at MeV arises from electrons with . Since , the scattering can be adequately approximated by elastic Thomson scattering. Therefore, the peak at MeV is not connected to KN effects and must result from a break in the electron energy distribution. On the other hand, the EGRET-observed flux is KN affected, and cannot be described by elastic Thomson scattering. The 2 GeV flux () results from electrons with , corresponding to , a regime in which the KN steepening of the spectrum relative to the Thomson case is significant.
In models in which particle acceleration competes with radiative losses and particle escape from the system, the electron energy distribution is characterized by , the Lorentz factor at which electrons are injected, , the electron Lorentz factor at which the radiative cooling time equals to the escape time, and , the electron Lorentz factor at which the acceleration time equals the radiative cooling time. Between and the electron distribution is a power law with index , while above the index steepens to , in the case where synchrotron cooling dominates. When the electron index , the peak of the inverse Compton spectral energy distribution is due to electrons with in the Thomson case, and the spectrum after the peak is expected to decrease abruptly. On the other hand, when the electron index , the peak of the inverse Compton spectral energy distribution is due to electrons with in the Thomson case, and the spectrum after the peak is expected to follow a power-law behavior, up to a cut-off energy associated with . In the case of the EGRET-detected blazars the fact that after the Thomson dominated peak at MeV there is a power law extension of the emission at least up to GeV indicates that the peak of the spectral energy distribution is associated with electrons at where the radiative cooling time equals the escape time from the system, and that the electron index .
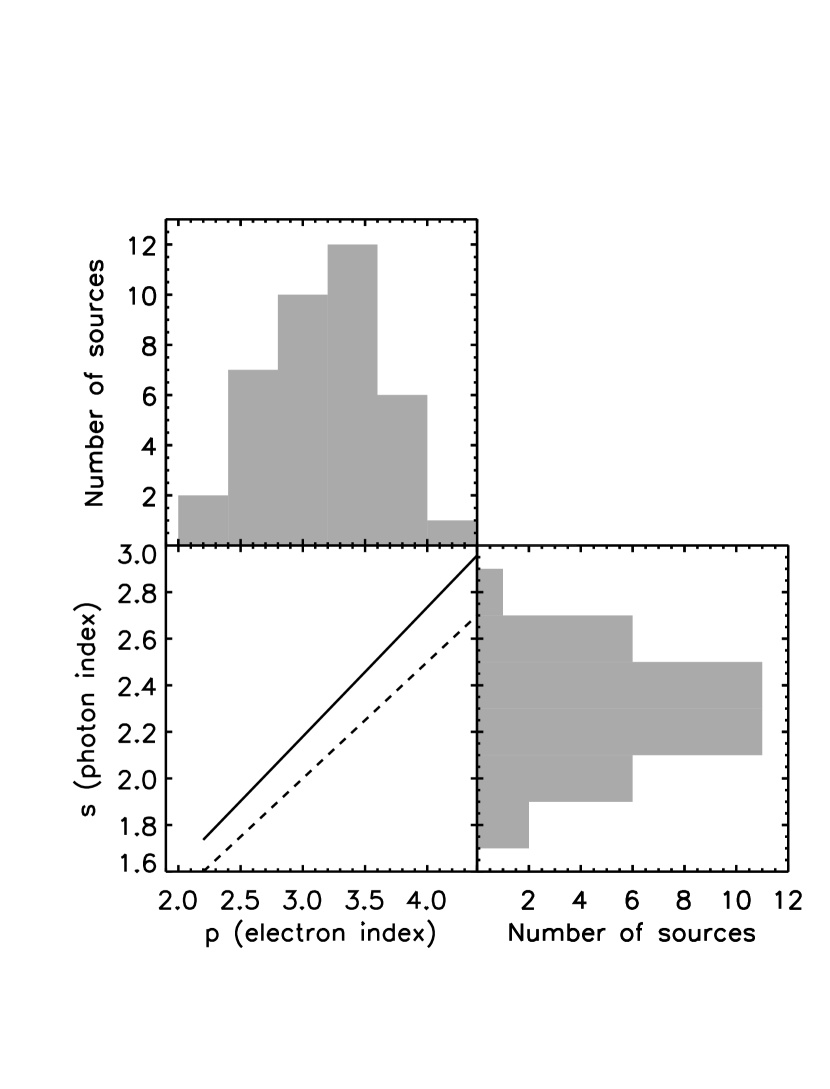
If the EGRET-observed flux were due to Thomson scattering, the observed photon index of a blazar would relate to the index of the electron power law via . However, since KN effects steepen the EGRET spectrum, application of this relation results in an electron index that is too steep, as can be seen in the lower left panel of figure 2, where we plot the KN corrected photon index (solid line) as well as the relation (dashed line). In this figure, the seed photon energy is , and the two-point spectral index is calculated here and throughout the paper using the luminosity of the model spectrum at MeV and GeV. The maximum electron Lorentz factor is assumed to be , since the EGRET observations show no evidence of a cut-off. Under this assumption the observed photon index is not a function of . For photon indices around the electron index that would result from Thomson scattering is steeper than the KN case by about . In the lower right panel of figure 2 we show a histogram of the observed photon indices of all blazars in the third EGRET catalog (Hartman, et al., 1999), except for sources with errors greater than in their photon index determination and also excluding the three X-ray selected BL Lacertae (MKN 421, MKN 501, PKS 2155-304), which, because they lack line emission in their spectra, are believed to be predominantly SSC emitters,
We see that the distribution peaks at (a careful calculation for all the broad line emitting blazars gives (Mukherjee, et al., 1997)). For each of these sources we calculate the electron index that would result in the observed photon index , taking into account the correction due to the redshift of the source, and plot the results in the upper left panel of figure 2. The results cluster in a wide interval around that includes the value . These values are expected from electron distributions with indices and , respectively, that steepen by above . Since the EGRET range is at energies higher than the peak of the spectral energy distribution, the observed photon indices are compatible with acceleration at both relativistic (Kirk et al., 2000; Achterberg et al., 2001) and non-relativistic shocks, which predict and respectively for the uncooled electron distributions. Unfortunately, however, the scatter in the observed indices is of the same order as the difference between the predictions, so that the data do not allow us to distinguish between these two cases.
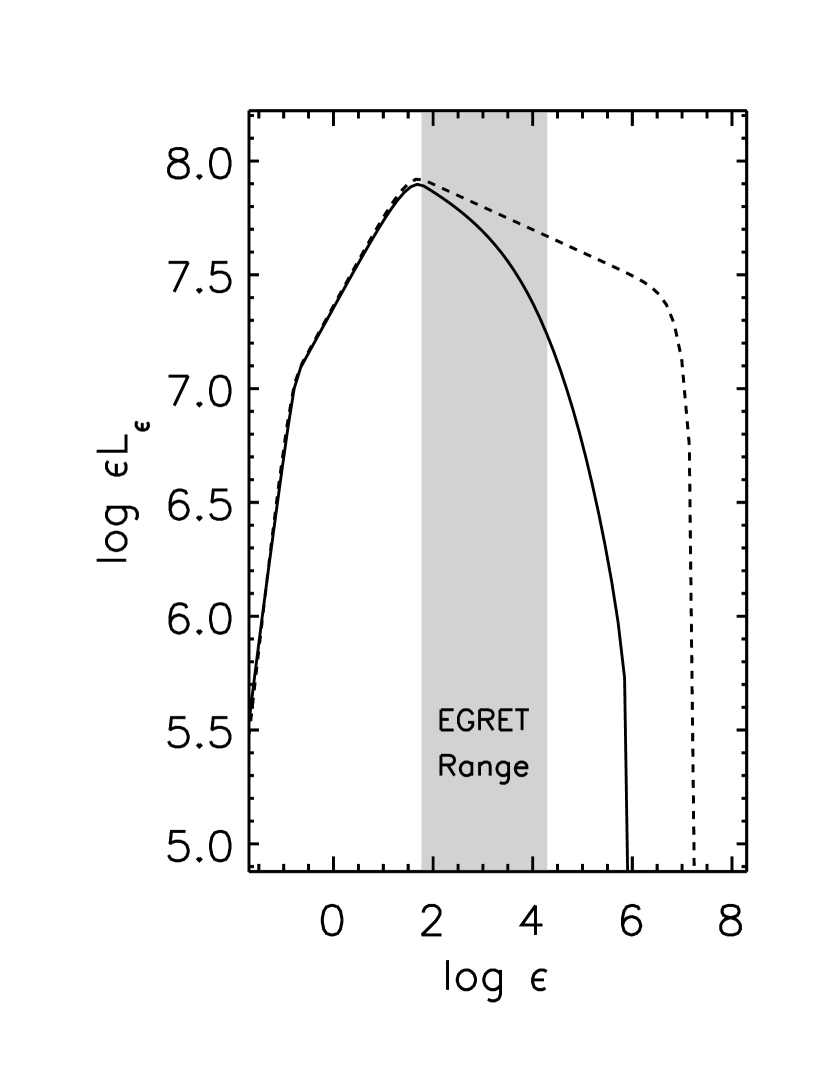
Simple electron cooling considerations predict a spectral break of in the transition before and after the peak energy of the observed energy distribution, as a result of the change in the electron index for synchrotron dominated cooling. This appears to conflict with the combined OSSE, COMPTEL and EGRET measurements of some blazars, which found spectral breaks (McNaron-Brown et al., 1995; Collmar et al., 1997). However, spectral breaks of between the COMPTEL and EGRET ranges are produced naturally for sources peaking at MeV energies, since the EGRET spectrum is softened by KN effects. We demonstrate this in figure 3, where we plot the spectral energy distribution due to inverse Compton scattering of optical seed photons by a broken power law electron distribution for both the KN (solid line) and Thomson calculation (broken line). The spectrum below the peak has a photon index , since below the peak . Above the peak and the Thomson spectrum has a a photon index , resulting in a break . The KN spectrum above the peak is steeper, and the two-point spectral index is calculated to be , which results in a spectral break .
4 Conclusions and discussion
In this paper we generalize the calculation (D95) of the beaming pattern of inverse Compton radiation to the KN regime. In terms of the electron index, , the beaming factor is , for arbitrary photon energy. The KN-limited spectrum produced by a power law electron distribution is curved, and the beaming pattern is not a simple function of the local spectral index as in the case of synchrotron emission or SSC. KN effects further limit the location of the peak of the spectral energy distribution to , where is the seed photon energy. This peak energy is independent of the Doppler factor and the maximum Lorentz factor of the electron distribution provided the scattering is KN limited (), but does depend on the electron index, with shifting to lower energies as the electron distribution becomes steeper. If the GeV spectrum of the EGRET blazars with strong emission lines is due to external Compton scattering of optical seed photons (), this component of the emission will steepen further due to KN effects at energies above , corresponding to energies TeV. Thus, even in the absence of absorption due to the extragalactic IR background, the TeV flux of this EC component is negligibly small.
In many cases, the spectra of blazars detected by EGRET and observed by OSSE and COMPTEL appear to peak in the region – MeV. Assuming that this emission is due to inverse Compton scattering of optical photons from the broad line region, the Thomson approximation is quite adequate at the peak energy. In this case, there should be a change in the spectral index measured on each side of the peak of , brought about by cooling via synchrotron or inverse Compton emission. In several cases, however, it appears that the spectra index determined from OSSE and COMPTEL measurements is harder than that in the EGRET-band by . This apparent difficulty has led to the development of models in which the spectral break arises not from cooling, but from the differential absorption by pair production at the edge of a gamma-ray photosphere (Blandford & Levinson, 1995; Marcowith, Henri & Pelletier, 1995).
Our results indicate, however, that the Thomson approximation is not adequate to describe the spectrum in the EGRET range. Assuming that synchrotron radiation is the dominant cooling mechanism, we have shown that the spectral break between the OSSE/COMPTEL and EGRET ranges can substantially exceed 0.5, without invoking absorption due to pair production. Our computation assumes that the dominant cooling mechanism is synchrotron radiation. This is reasonable because the inverse Compton flux is rarely observed to exceed the synchrotron flux by more than a factor of 10. Application of the beaming formula with implies for the ratio of the energy density in target photons to the energy density in the magnetic field . For we have , so that synchrotron cooling dominates. We note that the issue of the large () spectral breaks in MeV blazars will be accessible to detailed observation following the launch of INTEGRAL.
The spectral softening in the EGRET-band brought about by KN effects implies underlying electron spectra which are harder than would be expected from a naive application of the formula . As a result, the electron indices cluster around , which, allowing for cooling, corresponds to below the break at . This value is compatible with the predictions of shock acceleration theory at both at relativistic () and nonrelativistic shocks (). However, the quality of the data do not permit us to distinguish between these two possibilities.
The association of the peak of the spectral energy distribution with does not apply to all blazars. In X-ray bright objects, which include the TeV-emitting sources, the synchrotron spectral energy distribution is characterized by a sharp decline above the peak, as would be produced by a cut-off in the electron energy distribution, rather than a cooling break. Observations in the X-ray band of ‘hard lags’ (hard X-rays trailing in time behind soft X-rays) in MKN 421 (Maraschi, et al., 1999) suggest that at the peak energy the acceleration and loss time scales of the radiating particles are comparable (Kirk, Rieger, & Mastichiadis, 1997). The corresponding electron spectrum is hard: . This difference in electron spectrum may reflect a fundamental difference in the underlying particle acceleration mechanism in these two distinct classes of objects.
Appendix A The effective observed volume
Consider a blob containing a uniform distribution of electrons. In the rest frame of the blob, the differential number of electrons in interval moving within the solid angle is
| (A1) | |||||
where is the volume of the blob. In the lab. frame the blob moves along the -axis at speed , and the direction to the observer makes an angle with this axis. The radiation flux observed is proportional to the product of the single particle emissivity and the electron distribution integrated over the emitting volume at the retarded time. This can be written
| (A2) |
Apart from the argument of the delta function, the only dependence of the integrand on arises from the limits of the integration over the moving blob, so that
| (A3) |
where
| (A4) |
is the effective observed volume used in equation (3). To relate this to , we rewrite Eq. (A4) in terms of the spatial coordinates in the blob frame, keeping the time in the lab. frame. Since , and we have:
| which becomes, using | |||||
| (A5) | |||||
where we assume, without loss of generality, that lies in the - plane. Performing the integral over now yields
| (A6) | |||||
References
- Achterberg et al. (2001) Achterberg, A., Gallant, Y.A., Kirk, J.G., & Guthmann, A.W. MNRAS, submitted
- Bednarz & Ostrowski (1998) Bednarz, J., & Ostrowski, M. 1998 Phys. Rev. Letts. 80, 3911
- Begelman, Blandford, & Rees (1984) Begelman, M.C., Blandford, R.D., & Rees, M.J. 1984, Rev. Mod. Phys., 56, 255
- Blandford & Levinson (1995) Blandford, R.D., Levinson, A. 1995, ApJ, 441, 79
- Blazejowski et al. (2000) Blazejowski, M., Sikora, M., Moderski, R.& Madejski, G.M. 2000, ApJ, 545, 107
- Bloom & Marscher (1996) Bloom, S. D., & Marscher, A. P. 1996, ApJ, 461, 657
- Böttcher, Mause & Schlickeiser (1997) Böttcher, M., Mause, H., & Schlickeiser, R. 1997, A&A, 324, 395
- Chiaberdge & Ghisellini (1999) Chiaberge, M. & Ghisellini, G. 1999, MNRAS, 306 551
- Collmar et al. (1997) Collmar, W., et al. 1997, A&A, 328, 33
- Dermer, Schlickeiser, & Mastichiadis (1992) Dermer, C. D., Schlickeiser, R., & Mastichiadis, A. 1992, A&A, 256, L27
- Dermer (1995) Dermer, C. D. 1995, ApJ, 446, L63 (cited as “D95” in text)
- Ghisellini & Madau (1996) Ghisellini, G. & Madau, P. 1996, MNRAS, 280, 67
- Inoue & Takahara (1996) Inoue, S. & Takahara, F. 1996 ApJ, 463, 555
- Jones (1968) Jones, F. C. 1968, Phys. Rev., 167, 1159
- Hartman, et al. (1999) Hartman, R. C., et al. 1999, ApJS, 123, 79
- Kirk, Rieger, & Mastichiadis (1997) Kirk, J. G., Rieger, F. M., Mastichiadis, A. 1997, A&A, 333, 452
- Kirk et al. (2000) Kirk, J.G., Guthmann, A. W., Gallant, Y. A. & Achterberg, A. 2000, ApJ, 542, 235
- e.g., Kubo et al. (1998) Kubo, H., Takahashi, T., Madejski, G., Tashiro, M., Makino, F., Inoue, S., & Takahara, F. 1998, ApJ, 504, 693
- Maraschi, Ghisellini, & Celotti (1992) Maraschi, L., Ghisellini, G., & Celotti, A. 1992, ApJ, 397, L5
- Maraschi, et al. (1999) Maraschi et al. 1999, ApJ, 526, L81
- Marcowith, Henri & Pelletier (1995) Marcowith, A., Henri, G., Pelletier, G. 1995, MNRAS, 277, 681
- Mastichiadis & Kirk (1997) Mastichiadis, A., & Kirk, J. G. 1997, A&A, 320, 19
- McNaron-Brown et al. (1995) McNaron-Brown, K. et al. 1995, ApJ, 451, 575
- Mukherjee, et al. (1997) Mukherjee, R., et al. 1997, ApJ, 490, 116
- Rybicki & Lightman (1979) Rybicki, G. R. , & Lightman, A. P. 1979, Radiative Processes in Astrophysics (Willey: New York)
- Sikora, Begelman, & Rees (1994) Sikora, M., Begelman, M. C., Rees, M. J. 1994, ApJ, 421, 153
- Sikora, et al. (1997) Sikora, M., Madejski, G., Moderski, R., & Poutanen, J. 1997, ApJ, 484, 108
- Ulrich, Maraschi, & Urry (1997) Ulrich, M.-H., Maraschi, L., Urry, C.M. 1997, ARA&A, 35, 445