Analysis of the Hipparcos Observations
of the Extrasolar Planets and the Brown-Dwarf Candidates
Abstract
We analyzed the Hipparcos astrometric observations of 47 stars that were discovered to harbor giant planets and 14 stars with brown-dwarf secondary candidates. The Hipparcos measurements were used together with the corresponding stellar radial-velocity data to derive an astrometric orbit for each system. To find out the significance of the derived astrometric orbits we applied a “permutation” technique by which we analyzed the permuted Hipparcos data to get false orbits. The size distribution of these false orbits indicated the range of possibly random, false orbits that could be derived from the true data. These tests could not find any astrometric orbit of the planet candidates with significance higher than 99%, suggesting that most if not all orbits are not real. Instead, we used the Hipparcos data to set upper limits on the masses of the planet candidates. The lowest derived upper limit is that of 47 UMa — 0.014 , which confirms the planetary nature of its unseen companion. For 13 other planet candidates the upper limits exclude the stellar nature of their companions, although brown-dwarf secondaries are still an option. These negate the idea that all or most of the extrasolar planets are disguised stellar secondaries. Of the 14 brown-dwarf candidates, our analysis reproduced the results of Halbwachs et al. who derived significant astrometric orbits for 6 systems which imply secondaries with stellar masses. We show that another star, HD 164427, which was discovered only very recently, also has a secondary with stellar mass. Our findings support Halbwachs et al. conclusion about the possible existence of the “brown-dwarf desert” which separates the planets and the stellar secondaries.
1 Introduction
About fifty candidates for extrasolar planets have been announced over the past five years (e.g., Schneider 2001). In each case, precise stellar radial-velocity measurements indicated the presence of a low-mass unseen companion, with a minimum mass between 1 and about 10 Jupiter masses (). The actual masses of the companions are not known, because the inclination angles of their orbital planes cannot be derived from the spectroscopic data.
Precise astrometry of the orbit, from which we can derive the inclination, can yield the secondary mass, at least for the cases where the primary mass can be estimated from its spectral type. The Hipparcos accurate data, which have already yielded numerous orbits with small semi-major axes (ESA 1997; Söderhjelm 1999) down to a few milli-arc-sec (), could in principle be used for this purpose. The satellite data could be used either to detect small astrometric orbits of the stars that are known to host planet candidates, or to put upper limits to the size of the stellar astrometric motions, as was done by Perryman et al. (1996) for the first three planets discovered.
In principle, the analysis of the Hipparcos data of the stars hosting planet candidates together with their precise radial-velocity measurements can be a powerful technique. The idea is that the combination of the Hipparcos and the radial-velocity data can reveal small astrometric orbits which could not have been seen with the astrometric data alone. Mazeh et al. (1999) and Zucker & Mazeh (2000) were the first to apply this technique, followed by Halbwachs et al. (2000), Gatewood, Han & Black (2001) and Han, Black & Gatewood (2001).
However, such analyses, including our own (Mazeh et al. 1999 and Zucker & Mazeh 2000), can be misleading. As has been shown by Halbwachs et al. (2000), one can derive a small false orbit with the size of the typical positional error of Hipparcos — about 1 , caused by the scatter of the individual measurements. The astrometric orbit of CrB derived by Gatewood et al. (2001) and few of the astrometric orbits derived by Han et al. (2001) were suspicious in particular, because the inclination angles implied by those astrometric orbits were very small. Han et al. (2001) found eight out of 30 systems with an inclination smaller or equal to , four of which they categorized as highly significant. The probability of finding such small inclinations in a sample of orbits that are isotropically oriented in space is extremely small, indicating either a problematic derivation of the astrometric orbit, or, as suggested by Han et al. (2001), some serious orientation bias in the distribution of the inclination angles.
Indeed, two very recent independent studies of the statistical significance of the CrB orbit found by Gatewood et al. (2001) indicated that the finding is not highly significant. Pourbaix (2001), who studied the significance of the derived Hipparcos orbits of 42 stars that host planet candidates, found that the statistical significance of the CrB orbit is at the 99% level. He used an F-test to evaluate the improvement of the fit to the Hipparcos data resulting from the additional parameters of the binary orbit. He also concluded that the other orbits of Han et al. (2001) are statistically non significant. The use of the F-distribution assumes Gaussianity of the individual measurements, an assumption that might not be well justified for the Hipparcos data. Arenou et al. (1995) proved that the Hipparcos parallaxes and zero-points are Gaussian, but they do not analyze the distribution of the individual measurements of each star. We (Zucker & Mazeh 2001) avoided the assumption of Gaussianity by using the permutation test, which belongs to the class of distribution-free tests (e.g. Good 1994) and thus is more robust against modeling problems of the measurement process.
We performed the permutation test by generating simulated data from the very same astrometric measurements of CrB. If there was some evidence of an orbit in the measurements, it should be ruined by the permutation, and thus no random permutations would yield a comparable orbit. However, if the derived orbit was only spurious, some random permutations should be able to reproduce a similar effect. In a sense, we let the data “speak for themselves” and do not have to assume any specific distribution for the measurements or the errors. We found that the significance of the astrometric solution of CrB is at the 97.7% level.
The study of the significance of the CrB astrometric detection led us to check carefully all the announced extrasolar planet and brown dwarf candidates with available data. All together we present here an analysis of 47 planet candidates and 14 brown dwarfs. We first derive from the Hipparcos data the best astrometric orbit and then test unequivocally its significance, with an approach which is free of any assumptions about the errors of the Hipparcos measurements. All the derived orbits of the stars that harbor extrasolar planets turned out to be insignificant. Pourbaix and Arenou (2001) reached similar conclusions. Although the derived orbits are insignificant, we nevertheless used them to derive upper limits for the corresponding astrometric motions and for the masses of the unseen companions.
The previous study which derived upper limits for planet candidates (Perryman et al. 1996) searched the Hipparcos data for any possible astrometric orbital periodicity for each of the three stars considered then. They derived a periodgram from the corresponding astrometric amplitudes and obtained an upper limit for the stellar astrometric motion from the amplitude corresponding to the radial-velocity period. That algorithm does not utilize all the known radial-velocity elements. We, on the other hand, derive astrometric upper limits by combining the Hipparcos data together with all the radial-velocity information available, as we did in our previous work.
Section 2 presents our analysis, Section 3 the results for the whole sample and Section 4 concentrates on HD 164427, another star that hosts brown-dwarf candidate that is probably a massive companion. Section 5 discusses our finding.
2 Analysis
2.1 Orbital Solution
For each of the extrasolar planets and the brown-dwarf candidates we first derived the best astrometric orbit from the Hipparcos data, following closely our analysis of CrB (Zucker & Mazeh 2001). The analysis assumed that the spectroscopic and astrometric solutions have in common the following elements: the period, ; the time of periastron passage, ; the eccentricity, ; the longitude of the periastron, . In addition, the spectroscopic elements include the radial-velocity amplitude, , and the center-of-mass radial velocity . We have three additional astrometric elements — the angular semi-major axis of the photocenter, ; the inclination, ; the longitude of the nodes, . In addition, the astrometric solution includes the five regular astrometric parameters — the parallax, the position (in right ascension and declination) and the proper motion (in right ascension and declination). All together we had a 14-parameter model to fit to the spectroscopic and astrometric data.
For some extrasolar planets the discoverers made the individual stellar radial velocities available. Unfortunately, for many planets the individual velocities on which the discovery was based were not available to us. In such cases we used the published elements and their errors, as independent measurements of the elements, instead of the unavailable radial velocities.
The 14 elements are not all independent. From , and we can derive the projected semi-major axis of the primary orbit — , in physical units. This element, together with the inclination and the parallax, yields the angular semi-major axis of the primary, . Assuming the secondary contribution to the total light of the system is negligible, this is equal to the observed .
2.2 Statistical Significance
As pointed out by Halbwachs et al. (2000), the scatter of the actual measurements can cause a false “detection” of a very small semi-major axis, even without any real astrometric motion. To find the statistical significance of the derived astrometric orbit in each case we followed the permutation test (e.g. Good 1994) that we applied to CrB (Zucker & Mazeh 2001). For each star we generated simulated permuted astrometric positions by using the IAD Hipparcos measurements (ESA 1997) and permuting the actual timing of the observations, modifying the partial derivatives with respect to the five astrometric parameters (ESA 1997) accordingly. We then analyzed the permuted astrometric positions together with the actual radial-velocity data, deriving a new false astrometric orbit. This resampling process was repeated 1000 times for each star.
For most of the original measurements there are two stellar positions, one derived from the NDAC and the other from the FAST consortia. The two positions are, obviously, not independent, but have an assigned correlation. In our permutation we kept the pairing of the corresponding NDAC and FAST positions, while permuting the timings among the pairs. Thus, we actually applied separate permutations to the set of single measurements, where only one consortium produced a result, and to the set of paired permutations where there are two measurements for each timing. The partial derivatives of the residuals with respect to the basic astrometric parameters, which are part of the original IAD, had to be dealt with very carefully, and we had to re-compute them using the new timings (ESA 1997). In an earlier study this was not done correctly and it caused us to falsely assign a higher significance to the astrometric orbit of CrB. This emphasizes the importance of the careful calculation of the partial derivatives.
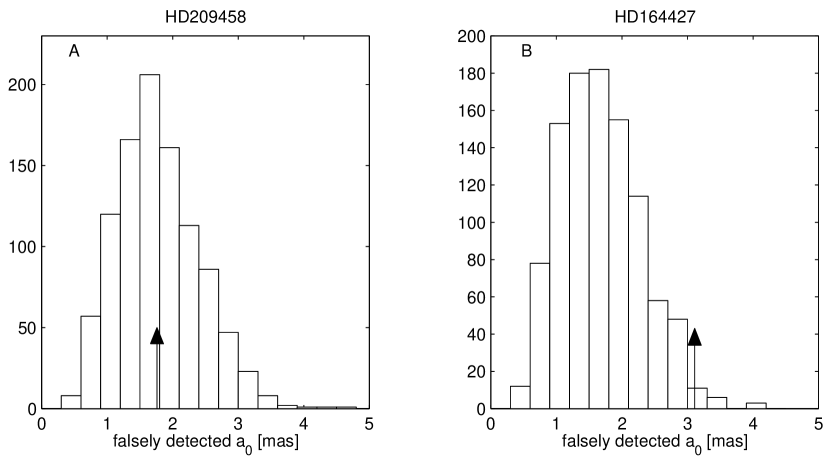
The distribution of the ensemble of falsely detected semi-major axes indicated the range of possible random detections. For example, —the 99-th percentile, denotes the semi-major axis size for which 99% of the simulations yielded smaller values. Consequently, an astrometric orbit is detected with a significance of 99% if and only if the corresponding semi-major axis is larger than .
As an illustration, Figure 1a shows the histogram of the semi-major axis derived using random permutations of the Hipparcos data of HD 209458. This star’s inclination is known to be close to through the combination of radial velocities and transit measurements (Charbonneau et al. 2000; Henry et al. 2000; Brown et al. 2001). The Hipparcos derived semi-major axis is 1.76 , which is marked in the figure by an arrow. One can clearly see that many random permutations led to larger semi-major axes, a fact that renders this derived value insignificant. The derived value is obviously false since the known inclination implies a value of less than a micro-arc-second.
The opposite case — of a significant derived orbit of HD 164427, is shown in Figure 1b and is discussed in Section 4.
2.3 Astrometric Upper Limits
It turned out that our stringent threshold — , rendered most of the astrometric orbits derived from the Hipparcos data insignificant. We tried instead to use the Hipparcos data for deriving an upper limit to the astrometric motion (Perryman et al. 1996). Note that can not be used as an upper limit to the stellar astrometric orbit, even if the derived semi-major axis, , is smaller than . We have no argument to negate the possibility that the true semi-major axis, , is
In fact, was computed a priori with the assumption that there is no astrometric orbit, and therefore denotes the range in which could be found if . The fact that was found within this range only tells us that , or very close, is a possibility, but does not constrain its permitted values.
In order to set a reliable upper limit to the astrometric orbit, we have to consider the range of permitted values of , given the fact that the derived value is . We could run simulations that turn this question around and find a priori the range of for every possible value of , as we actually did for the case . However, such an approach would be prohibitively extensive in numerical computations. Instead we adopt the usual approach and used the error estimate of , calculated from the second derivatives of the function at . We are assuming that the effects of non-normality and skewness of the error distribution are weak at . This assumption is obviously wrong at , since we expect only positive values to be derived, but is more probable at a non-vanishing value. We therefore use the 2.3 confidence interval around to set an upper limit of 99% confidence level for the semi-major axis of the astrometric orbit. Unlike the significance analysis, our estimated upper limits are not distribution-free.
The upper limit on the semi-major axis yields a lower limit for the inclination and therefore an upper limit to the secondary mass for each system.
3 Results
3.1 The Planet candidates
As of March 2001, the Encyclopedia of extrasolar planets included 49 planet candidates with minimum masses smaller than 13 . In the literature we found another 14 stars with secondaries with minimum masses between 13 and 67 . Although the separation between planets and brown-dwarf secondaries is not yet clear (e.g., Mazeh and Zucker 2000) we nevertheless adopted the nomenclature of the Encyclopedia and separated the discussion between the planet candidates and the brown-dwarf secondaries. In this subsection we analyzed all but two of the planet candidates. One of the 49 stars, BD 10°3166 had no Hipparcos data, and therefore was not analyzed. The other star, HD 168443, is known to have two companions. We assume its reflex motion is caused mainly by its heavier companion, whose mass is known to be larger than 13. Therefore we defer its analysis to the brown-dwarf subsection.
The Hipparcos and the spectroscopic data of the remaining 47 stars are summarized in Table 1. The table lists the stellar Hipparcos number, name and distance; the eccentricity and period; the minimum size of the astrometric semi-major axis and the minimum mass of the unseen companion. The table then lists the number of Hipparcos data points, a reference to the radial-velocity work and a comment column that indicates, for example, whether the actual radial-velocity measurements were available, or only the orbital elements.
In Table 2 we present the results of our analysis. After we list again the Hipparcos number and stellar name, we list , the derived semi-major axis, followed by its uncertainty. We then list , derived from our permutation test. The next column gives the 99% upper limit of the astrometric orbit, , as derived by
The corresponding 99% upper limit for the mass is given in the last column. Mass upper limits which are too large do not contribute any additional information to our previous knowledge about the companion. Therefore we decided, arbitrarily, to discard upper limits larger than two solar masses.
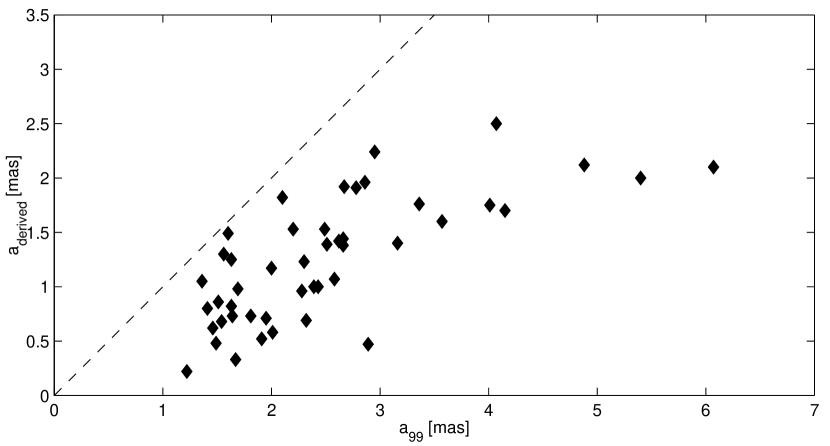
Table 2 shows that all our are smaller than . This includes the planets of And and HD10697 whose derived orbits were previously published (Mazeh et al. 1999; Zucker & Mazeh 2000), but the new analysis renders their orbits less significant. Figure 2, which depicts versus , indeed shows that all points fall below the line . This means that all our derived astrometric motions are not significant in the level of 99%. However, this does not mean that the orbits derived are all false. Figure 2 shows that some of the systems are close to the border line, indicating that the orbits of these systems were detected with significance close to 99%. The systems with significance higher than 90% are listed in Table 3. Here we list the Hipparcos number and the stellar name, the confidence level of the derived astrometric orbit, the derived semi-major axis, its uncertainty and the derived inclination; the derived secondary mass, together with its 1 range. The values in square brackets are the corresponding values calculated by Pourbaix (2001), listed here for comparison.
3.2 The Brown-Dwarf Candidates
In Table 4 and Table 5 we repeat the above analysis for the sub-stellar candidates with minimum masses between 15 and 70 (i.e., brown-dwarf candidates).
Table 4 summarizes the Hipparcos and radial-velocity data of the brown-dwarf candidates. The structure of the table is identical to that of Table 1. The table includes HD 168443 which we “expelled” from Table 1. HD 98230 is a quadruple system and therefore its astrometric motion must be quite complicated and thus was not analyzed. Nine of the remaining 14 stars were analyzed by Halbwachs et al. (2000) and are marked accordingly in the table. Table 5 presents the results of our analysis.
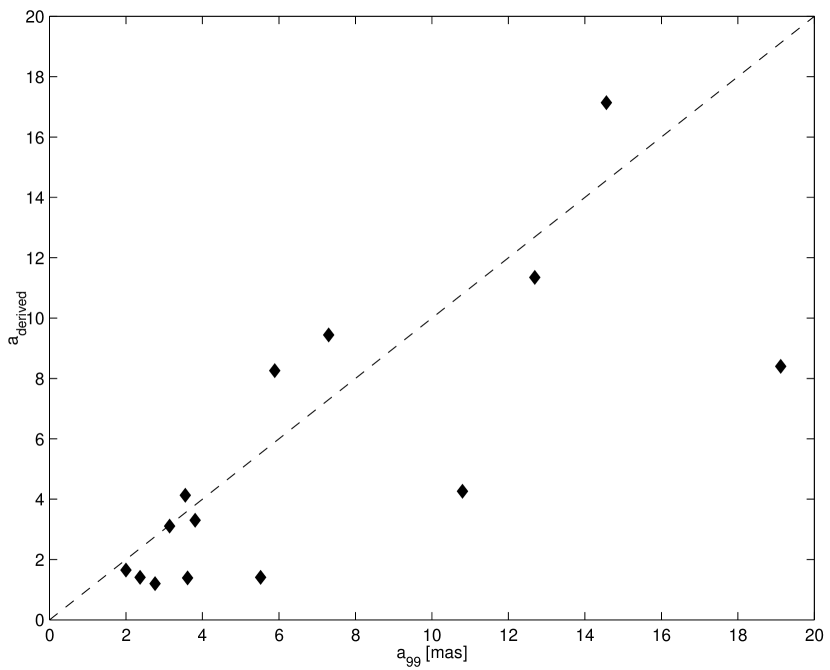
Figure 3 depicts versus . Contrary to Figure 2, here a few systems are above the line , indicating significant detections. As in the previous section, we list in Table 6 the systems for which our analysis indicated an astrometric orbit with a significance higher than 90%. We indicate by an asterisk systems that were analyzed by Halbwachs et al. (2000). The structure of the table is similar to that of Table 3, except that the values in square brackets are the values obtained by Halbwachs et al., listed for comparison.
4 HD 164427
Table 6 includes one star — HD 164427 — that did not appear in the Halbwachs et al. (2000) paper because its radial-velocity modulation had not yet been detected. We find that its derived astrometric orbit, which renders its companion stellar, is significant on a 99% confidence level. For HD 164427 we present in Figure 1b the histogram of the falsely detected semi-major axes. Out of 1000 simulations only 11 yielded semi-major axis larger than 3.11 . It indicates that the significance of this detection is 99%, at about the 2.3 level.
Figure 4 presents the derived orbit of HD 164427. Traditionally, an astrometric solution is presented graphically by a diagram of the derived orbit on the plane of the sky, usually together with the individual two-dimensional measurements. This is impossible for the Hipparcos data, because these measurements are only one-dimensional, observed along the instantaneous reference great circle at the time of the measurement. However, two Hipparcos measurements observed at very close timing with two different great-circle directions allow us, in principle, to derive a two-dimensional stellar position. Because of the intrinsic uncertainty of the measurements, more than two measurements are desired for such an exercise. Such a “two-dimensional averaging” of the Hipparcos data was used by Halbwachs et al. (2000) as a graphic representation of the astrometric orbit for the long-period binaries they have studied.
The graphical presentation of HD 164427 was done in a similar way. We folded the data with the orbital period and looked for small groups of Hipparcos data points that cluster around the same orbital phase. Such small clusters, with at least three points, were “two-dimensionally averaged”. The resulting points are presented in Figure 4a. The figure shows that the points are at about 2–3 away from the center, and therefore indicates, although without any quantitative measure, that the orbit is real.
Figure 4a does not show the temporal dependence of the points. To show this dependence we derived the mean anomaly of each point from the corresponding observed true anomaly, together with the other orbital elements. In Figure 4b we plot the mean anomalies of the 8 points as a function of their orbital phase. Without noise, and assuming there is a genuine orbital motion, we would expect the points to lie along a straight line, which is also plotted. The figure clearly demonstrates the nature of the stellar orbital revolution. We stress again that these 8 points are used only for graphic presentation and no real conclusion is drawn from them. Any quantitative statement is based upon the full set of 28 one-dimensional measurements.
5 Discussion
The analysis presented here shows that among the planet candidates no orbit was detected with a significance higher than 99%. Out of 47 systems, six orbits were derived with significance higher than 90%. These orbits are probably all false, as we expect to derive from the whole sample false orbits with this significance or higher. Three of these orbits were derived with significance higher than 95%, while we expect false orbits. Although we can not rule out the possibility that one or two of the six orbits are real, apparently the Hipparcos precision is not enough to yield detections of reflex motion induced by extrasolar planets with a high enough statistical significance. This conclusion is contrary to the preliminary suggestion of Han et al. (2001), who found at least four astrometric orbits highly significant, and agrees well with the general conclusion of Pourbaix (2001) and Pourbaix & Arenou (2001).
Although there is no difference in our conclusion, it is interesting to compare in details our results with those of Pourbaix (2001). Pourbaix found one case — HD 195019 — where the astrometric fit is improved by the orbital model at the 99% level. We also find the orbit of HD 195019 to be somewhat significant, but to a much smaller degree — 92%. We suspect that the difference in the results could have come from the fact that Pourbaix used strong assumptions about the distribution of the errors of the Hipparcos data, while we do not. In any case, both Pourbaix and Pourbaix & Arenou (2001) suggested that the astrometric orbit is probably not real.
Another difference, which is again of academic interest, is the case of HD 6434. Here the difference in the significance assigned by the two analyses is so large that we suspect that Pourbaix analysis converged to a completely different orbit, with substantial smaller significance. A well-known phenomenon with the Hipparcos data is the existence of two minima of the function corresponding to two almost opposite orientations of the orbit, where one minimum is deeper than the other and thus corresponds to a better fit. Our analysis finds Pourbaix’s solution for this star at the shallower minimum. In any case, both analyses suggest that the Hipparcos orbit of this system is not real.
We turn now to discuss the upper limits we derived for the planet candidates. The smallest value listed in Table 2 is that of 47 UMa, with an upper limit of 0.014 . This upper limit is at about the value commonly adopted arbitrarily as the border line between planets and brown dwarfs. This means that our analysis indicates that 47 UMa companion can almost safely be regarded as a planet. Perryman et al. (1996) found an upper limit of 22 for a confidence level of 90%. If we follow their prescription for the 99% limit we get 28 . This is twice as large as our upper limit, probably because Perryman et al. did not use all the information available from the radial-velocity solution for their astrometric fit. The same difference can be found in the analysis of 70 Vir. We find a 99% upper limit of 63 , while Perryman et al. found a limit of 85 .
For eight stars the upper limit is below 40 , and for another six stars the upper limit is below 80 . These findings negate the preliminary conjecture (Han et al. (2001)) that many of the planet candidates are disguised stellar companions with extremely small angles.
On the other hand, our analysis of the brown-dwarf candidates yielded quite a few astrometric orbits with high significance. Out of 14 systems we found 8 orbits with significance higher than 90%, while we expected to find only false orbits under the assumption that no real orbits are present. This suggests that most of them are real. Similarly, we find six orbits with significance higher than 95%, while we expected only false orbits. This again suggested that most of these orbits are real. Further support to this suggestion can be found in the fact that all the corresponding orbital inclinations, except one, are large, as opposed to the ones of Table 3.
This is not a surprise. The stellar reflex motion caused by a brown dwarf is much larger than the one caused by a planet. Therefore the minimum semi-major axes, , of the brown-dwarf candidates are closer to the threshold of the Hipparcos detection. This is reflected, for example, by the fact that out of the 14 brown-dwarf candidate systems only two systems, with short orbital periods, have smaller than 0.1 , while the planets have 34 such orbits out of 47 systems. Only one of these two brown-dwarf systems, HD 87330, was found to have an astrometric orbit with a significance higher than 90%. Here again the inclination is suspiciously very small. We therefore suspect that this is a false orbit. After all we expect systems to show such false orbits.
All the significant orbits of the brown-dwarf candidates yielded secondary masses that rendered the secondary a stellar object. This fact was pointed out already by Halbwachs et al. (2000), who analyzed six of the eight systems of Table 6, and got very similar results for the secondary masses. Halbwachs et al. (2000) analyzed another five of the brown-dwarf candidates, which we find their orbit insignificant. Although Halbwachs et al. (2000) did not give explicitly the significance of their finding, their derived large uncertainty and the following discussion leave no doubt that these orbits are insignificant. So, we agree on these five systems as well. Note that these five systems include HD 114762, which we still considered a planet candidate. In the sample we analyzed we still had six systems that could still be brown-dwarf secondaries.
To summarize, we find no disguised low-mass stellar companions within the sample of 47 stars that harbor planet companions, while we find 6–8 such stellar companions in a sample of 14 stars with brown-dwarf candidates. The frequency of unknown low-mass stellar companions detected as planet candidates depends on the selection of the sample from which the planets are searched. Apparently, the planet hunters avoided any known spectroscopic binaries in their sample, relying on previous lower precision radial-velocity searches. Obviously, some M-star secondaries could have avoided previous detection. However, such binaries must have extremely small inclination angles in order to be erroneously identified as planets. This is why we do not find any such case.
On the other hand, even moderate inclinations could turn binaries with stellar low-mass secondaries into brown-dwarf candidates. This is why we find relatively many stellar secondaries in the brown-dwarf candidate sample. Maybe there are no brown-dwarfs at all, and the brown-dwarf candidates are all low-mass stellar secondaries. The fact that we found no compelling evidence for a disguised brown-dwarf secondary within the planet candidates is consistent with the “brown-dwarf desert” conjecture. However, as pointed out by Halbwachs et al. (2000), the brown-dwarf desert conjecture is not proved by these findings. It is still possible that the other 6–8 systems in Table 4 have brown-dwarf companions. In addition, our derived upper limits of the planet candidates can rule out brown-dwarf candidates only for a very few systems. and therefore the real number of hidden brown dwarfs within the sample of planet candidates is still not known.
The possible brown-dwarf desert separates the two certainly inhabited lands of the planets on one side and that of the stellar secondaries on the other side, and therefore is crucial to our understanding of the two populations. To find out more about it we need a more detailed analysis of the mass distribution of the two populations, a study which is underway.
References
- (1)
- (2) Arenou, F., Lindegren, L., Frœschlé, M., Gómez, A. E., Turon, C., Perryman, M. A. C., & Wielen, R. 1995, A&A, 304, 52
- (3)
- (4) Brown, T. M., Charbonneau, D., Gilliland, R. L., Noyes, R. W., & Burrows, A. 2001, ApJ, 552, 699
- (5)
- (6) Butler, P., & Marcy, G. 1996, ApJ, 464, L153
- (7)
- (8) Butler, R. P., Marcy, G. W., Williams, E., Hauser, H., & Shirts, P. 1997, ApJ, 474, L115
- (9)
- (10) Butler, R. P., Tinney, C. G., Marcy, G. W., Jones, H. R. A., Penny, A. J., & Apps, K. 2001, ApJ, submitted
- (11)
- (12) Butler, R. P., Vogt, S. S, Marcy, G. W., Fischer, D., Henry, G., & Apps, K. 2000, ApJ, 545, 504
- (13)
- (14) Charbonneau, D., Brown, T. M., Latham, D. W., & Mayor, M. 2000, ApJ, 529, L45
- (15)
- (16) Cochran, W. D., Hatzes, A. P., Butler, R. P., & Marcy, G. W. 1997, ApJ, 483, 457
- (17)
- (18) Delfosse, X., Forveille, T., Mayor, M., Perrier, C., Naef, D., & Queloz, D. 1998, A&A, 338, L67
- (19)
- (20) ESA 1997, The Hipparcos and Tycho Catalogues, ESA SP-1200
- (21)
- (22) Fischer, D., Marcy G. W, Butler R. P., Vogt S., Frink S., & Apps K. 1999, PASP, 111, 50
- (23)
- (24) Fischer, D., Marcy G. W, Butler R. P., Vogt S., Frink S., & Apps K. 2001, ApJ, submitted
- (25)
- (26) Gatewood, G., Han, I., & Black, D. 2001, ApJ, 548, L61
- (27)
- (28) Good, P. 1994, Permutation Tests — A Practical Guide to Resampling Methods for Testing Hypotheses, (New York : Springer-Verlag)
- (29)
- (30) Halbwachs, J. L., Arenou, F., Mayor, M., Udry, S., & Queloz, D. 2000, A&A, 355, 581
- (31)
- (32) Han, I., Gatewood, G., & Black, D. 2001, ApJ, 548, L57
- (33)
- (34) Hatzes, A. P., et al. 2000, ApJ, 544, L145
- (35)
- (36) Henry, G. W., Marcy, G. W., Butler, R. P., & Vogt, S. S. 2000, ApJ, 529, L41
- (37)
- (38) Korzennik, S., Brown, T., Fischer, D., Nisenson, P., & Noyes, R. 2000, ApJ, 533, L147
- (39)
- (40) Kürster, M., Endl, M., Els, S., Hatzes, A. P., Cochran, W. D., Döbereiner, S., & Dennerl, K. 2000, A&A, 353, L33
- (41)
- (42) Laughlin, G., & Adams, F. 1999, ApJ, 526, 881
- (43)
- (44) Marcy, G. W., & Butler, R. P. 1996, ApJ, 464, L147
- (45)
- (46) Marcy, G. W., Butler, R. P., & Vogt, S.S. 2000, ApJ, 536, L43
- (47)
- (48) Marcy, G. W., Butler, R. P., Vogt, S. S., Fischer, D., & Liu, M.C. 1999, ApJ, 520, 239
- (49)
- (50) Marcy, G. W., Butler, R. P., Williams, E., Bildsten, L., Graham, J. R., Ghez, A. M., & Jernigan, J.G. 1997, ApJ, 481, 926
- (51)
- (52) Mayor ,M., Naef, D., Pepe, F., Queloz, D., Santos, N., Udry, S., & Burnet, M. 2000, in Planetary Systems in the Universe: Observation, Formation and Evolution, IAU Symp. 202, Eds. A. Penny, P. Artymowicz, A.-M. Lagrange and S. Russel, ASP Conf. Ser, in press
- (53)
- (54) Mazeh, T., Zucker, S., Dalla Torre, A., & van Leeuwen, F. 1999, ApJ, 522, L149
- (55)
- (56) Mazeh, T., & Zucker, S. 2000, astro-ph/0008087, to be published in Birth and Evolution of Binary Stars, IAU Symp. 200, ASP Conf. Proc., eds. B. Reipurth and H. Zinnecker
- (57)
- (58) Naef, D., Mayor, M., Pepe, F., Queloz, D., Santos, N. C., Udry, S., & Burnet, M. 2000, in Disks, Planetesimals and Planets (Tenerife, January 2000), eds. F. Garzon, C. Eiroa, D. de Winter and T.J. Mahoney, ASP Conf. Ser.
- (59)
- (60) Noyes, R. W., Jha, S., Korzennik, S. G, Krockenberger, M., & Nisenson, P. 1997, ApJ, 483, L111
- (61)
- (62) Perryman, M. A. C., et al. 1996, A&A, 310, L21
- (63)
- (64) Pourbaix, D. 2001, A&A, 369, L22
- (65)
- (66) Pourbaix, D., & Arenou, F. 2001, A&A, accepted, astro-ph/0104412
- (67)
- (68) Queloz, D., et al. 2000a, A&A, 354, 99
- (69)
- (70) Queloz, D., Mayor, M., Naef, D., Pepe, F., Santos, N.C., Udry, S., & Burnet, M. 2000b, in Planetary Systems in the Universe: Observation, Formation and Evolution, IAU Symp. 202, eds. A. Penny, P. Artymowicz, A.-M. Lagrange and S. Russel ASP Conf. Ser, in press
- (71)
- (72) Schneider, J. 2001, in Extrasolar Planets Encyclopaedia http://www.obspm.fr/planets
- (73)
- (74) Sivan, J. -P., Mayor, M., Naef, D., Queloz, D., Udry, S., Perrier-Bellet, C., & Beuzit, J.-L. 2000 , in Planetary Systems in the Universe: Observation, Formation and Evolution, IAU Symp. 202, eds. A. Penny, P. Artymowicz, A.-M. Lagrange and S. Russel, ASP Conf. Ser., in press
- (75)
- (76) Söderhjelm, S. 1999, A&A, 341, 121
- (77)
- (78) Tinney, C. G., et al. 2001, ApJ, submitted
- (79)
- (80) Udry, S., et al. 2000a, A&A, 356, 590
- (81)
- (82) Udry, S., et al. 2001, http://obswww.unige.ch/ udry/planet
- (83)
- (84) Udry, S., Mayor, M., & Queloz, D., 2000b, in Planetary Systems in the Universe: Observation, Formation and Evolution, IAU Symp. 202, Eds. A. Penny, P. Artymowicz, A.-M. Lagrange and S. Russel ASP Conf. Ser., in press
- (85)
- (86) Vogt, S. S., Marcy, G. W., Butler, R. P., & Apps, K. 2000, ApJ, 536, 902
- (87)
- (88) Zucker, S., & Mazeh, T. 2000, ApJ, 531, L67
- (89)
- (90) Zucker, S., & Mazeh, T. 2001, MNRAS, submitted
- (91)

| HIP | Name | // | References | Commments | |||||
|---|---|---|---|---|---|---|---|---|---|
| number | (pc) | (days) | () | () | |||||
| 1292 | GJ 3021 | 18 | 0.51 | 133.82 | 0.099 | 3.3 | 41/42/43 | 1 | a |
| 5054 | HD 6434 | 40 | 0.30 | 22.09 | 0.0018 | 0.48 | 40/39/40 | 2 | a |
| 7513 | And | 13 | 0.41 | 1267 | 0.58 | 4.6 | 26/28/28 | 3 | a,b |
| 8159 | HD 10697 | 33 | 0.12 | 1072.3 | 0.35 | 6.3 | 16/17/17 | 4 | c |
| 9683 | HD 12661 | 37 | 0.23 | 252.7 | 0.055 | 2.8 | 26/26/26 | 5 | d |
| 10138 | Gliese 86 | 11 | 0.05 | 15.78 | 0.050 | 4 | 34/34/35 | 6 | a |
| 12048 | HD 16141 | 36 | 0.28 | 75.82 | 0.0020 | 0.21 | 16/17/17 | 7 | c |
| 12653 | HR 810 | 17 | 0.16 | 320.1 | 0.10 | 2.3 | 38/38/39 | 8 | c |
| 14954 | HD 19994 | 22 | 0.2 | 454 | 0.082 | 2.0 | 26/26/27 | 2 | a,e |
| 16537 | Eri | 3.2 | 0.61 | 2502.1 | 1.08 | 0.86 | 34/34/18 | 9 | a,f |
| 19921 | HD 27442 | 18 | 0.03 | 426.5 | 0.074 | 1.4 | 31/36/36 | 10 | c |
| 26381 | HD 37124 | 33 | 0.19 | 155.7 | 0.018 | 1.0 | 18/17/18 | 4 | c |
| 27253 | HD 38529 | 42 | 0.27 | 14.32 | 0.0016 | 0.81 | 19/19/38 | 5 | a,g |
| 31246 | HD 46375 | 33 | 0. | 3.02 | 0.0003 | 0.25 | 18/19/20 | 7 | c |
| 33719 | HD 52265 | 28 | 0.29 | 118.96 | 0.017 | 1.1 | 24/25/25 | 11 | c |
| 43177 | HD 75289 | 29 | 0. | 3.51 | 0.0006 | 0.42 | 42/43/44 | 12 | a |
| 43587 | 55 Cnc | 13 | 0.05 | 14.65 | 0.0083 | 0.84 | 24/25/25 | 13 | a |
| 47007 | HD 82943 | 27 | 0.61 | 442.6 | 0.086 | 2.2 | 25/25/26 | 14 | a |
| 47202 | HD 83443 | 44 | 0.42 | 29.83 | 0.0008 | 0.16 | 36/36/38 | 15 | a,b |
| 50786 | HD 89744 | 39 | 0.7 | 256. | 0.11 | 7.2 | 24/27/27 | 16 | a |
| 52409 | HD 92788 | 32 | 0.30 | 326.7 | 0.10 | 3.3 | 18/22/22 | 5 | d |
| 53721 | 47 UMa | 14 | 0.03 | 1090 | 0.32 | 2.4 | 28/30/30 | 17 | a |
| 60644 | HD 108147 | 39 | 0.56 | 10.88 | 0.0008 | 0.34 | 33/35/36 | 14 | a |
| 64426 | HD 114762 | 41 | 0.33 | 84.03 | 0.11 | 11 | 18/18/20 | 18 | c |
| 65721 | 70 Vir | 18 | 0.4 | 116.7 | 0.17 | 6.6 | 29/32/33 | 19 | a |
| 67275 | Boo | 16 | 0.02 | 3.31 | 0.0092 | 3.9 | 27/27/27 | 13 | a |
| 68162 | HD 121504 | 44 | 0.13 | 64.6 | 0.0060 | 0.89 | 32/37/38 | 2 | a |
| 72339 | HD 130322 | 30 | 0.05 | 10.72 | 0.0038 | 1.0 | 15/13/15 | 12 | a |
| 74500 | HD 134987 | 26 | 0.24 | 259.6 | 0.044 | 1.6 | 17/17/17 | 4 | c |
| 78459 | CrB | 17 | 0.03 | 39.65 | 0.014 | 1.1 | 41/43/43 | 20 | c |
| 79248 | 14 Her | 18 | 0.32 | 1654 | 0.58 | 3.3 | 39/41/41 | 14 | a |
| 79336 | HD 187123 | 48 | 0. | 3.10 | 0.0004 | 0.48 | 41/42/43 | 4 | c |
| 86796 | HD 160691 | 15 | 0.62 | 743 | 0.19 | 2.0 | 31/32/32 | 10 | c |
| 90004 | HD 168746 | 43 | 0. | 6.41 | 0.0004 | 0.24 | 18/23/23 | 14 | a |
| 90485 | HD 169830 | 36 | 0.34 | 230.4 | 0.045 | 3.0 | 21/22/22 | 14 | a |
| 93746 | HD 177830 | 59 | 0.41 | 391.6 | 0.018 | 1.2 | 48/50/50 | 4 | c |
| 94645 | HD 179949 | 27 | 0. | 3.09 | 0.0012 | 0.84 | 20/22/23 | 21 | c |
| 96901 | 16 Cyg B | 21 | 0.63 | 801 | 0.12 | 1.5 | 37/39/39 | 22 | d |
| 98714 | HD 190228 | 62 | 0.5 | 1161 | 0.14 | 5 | 56/58/58 | 23 | a |
| 99711 | HD 192263 | 20 | 0.22 | 24.36 | 0.0074 | 0.79 | 24/25/25 | 4 | c |
| 100970 | HD 195019 | 37 | 0.02 | 18.2 | 0.013 | 3.5 | 23/23/24 | 4 | c |
| 108859 | HD 209458 | 47 | 0. | 3.52 | 0.0006 | 0.69 | 24/26/26 | 24 | a,h |
| 109378 | HD 210277 | 21 | 0.45 | 437 | 0.068 | 1.3 | 25/25/26 | 25 | c |
| 113020 | Gliese 876 | 4.7 | 0.34 | 60.97 | 0.28 | 2.0 | 17/19/19 | 26 | a |
| 113357 | 51 Peg | 15 | 0. | 4.23 | 0.0014 | 0.47 | 36/34/37 | 27 | c |
| 113421 | HD 217107 | 20 | 0.14 | 7.13 | 0.0047 | 1.3 | 20/21/21 | 4 | a,g |
| 116906 | HD 222582 | 42 | 0.71 | 575.9 | 0.17 | 5.3 | 21/24/24 | 4 | c |
Note. — , and are the numbers of the Hipparcos FAST measurements, NDAC measurements and the number of satellite orbits included in the star’s analysis, respectively. The comments:
a. The analysis used the published orbital elements.
b. The analysis pertains to the outer planet of a multiple planets system.
c. The analysis used the available radial velocities.
d. The analysis used two independent sets of radial velocities.
e. The analysis assumed the planet orbit is circular.
f. The orbital period is much longer than the Hipparcos mission duration.
g. The Hipparcos analysis used an additional acceleration term.
h. The planet is known to eclipse the star.
References. — (1) Naef et al. 2000; (2) Queloz et al. 2000b; (3) Laughlin & Adams 1999; (4) Vogt et al. 2000; (5) Fischer et al. 2000; (6) Queloz et al. 2000a; (7) Marcy, Butler & Vogt 2000; (8) Kurster et al. 2000; (9) Hatzes et al. 2000; (10) Butler et al. 20001; (11) Butler et al. 2000; (12) Udry et al. 2000a; (13) Butler et al. 1997; (14) Udry et al. 2001; (15) Mayor et al. 2000; (16) Korzennik et al. 2000; (17) Butler & Marcy 1996; (18) Latham, private communication; (19) Marcy & Butler 1996; (20) Noyeset al. 1997; (21) Tinney et al. 2001; (22) Cochran et al. 1997; (23) Sivan et al. 2000; (24) Mazeh et al. 2000; (25) Marcy et al. 1999; (26) Delfosse et al. 1998; (27) Marcy et al. 1997
| HIP | Name | |||||
|---|---|---|---|---|---|---|
| number | () | () | () | () | () | |
| 1292 | GJ 3021 | 0.48 | 0.50 | 1.49 | 1.62 | 0.054 |
| 5054 | HD 6434 | 1.3 | 0.67 | 1.56 | 2.88 | 1.31 |
| 7513 | And | 1.42 | 0.68 | 2.62 | 2.98 | 0.018 |
| 8159 | HD 10697 | 2.12 | 0.73 | 4.88 | 3.80 | 0.088 |
| 9683 | HD 12661 | 0.96 | 0.64 | 2.28 | 2.43 | 0.13 |
| 10138 | Gliese 86 | 0.33 | 0.74 | 1.67 | 2.03 | 0.14 |
| 12048 | HD 16141 | 1.0 | 1.2 | 2.39 | 3.70 | 0.51 |
| 12653 | HR 810 | 0.80 | 0.56 | 1.41 | 2.09 | 0.042 |
| 14954 | HD 19994 | 0.98 | 0.72 | 1.69 | 2.63 | 0.063 |
| 16537 | Eri | 10.1 | 7.0 | 26.49 | 26.21 | 0.021 |
| 19921 | HD 27442 | 0.82 | 0.47 | 1.63 | 1.90 | 0.036 |
| 26381 | HD 37124 | 2.1 | 1.8 | 6.07 | 6.22 | 0.46 |
| 27253 | HD 38529 | 1.7 | 1.1 | 4.15 | 4.36 | |
| 31246 | HD 46375 | 1.4 | 1.0 | 3.16 | 3.71 | |
| 33719 | HD 52265 | 0.62 | 0.56 | 1.46 | 1.91 | 0.13 |
| 43177 | HD 75289 | 1.05 | 0.52 | 1.36 | 2.24 | |
| 43587 | 55 Cnc | 0.58 | 0.80 | 2.01 | 2.41 | 0.28 |
| 47007 | HD 82943 | 1.39 | 0.88 | 2.51 | 3.42 | 0.090 |
| 47202 | HD 83443 | 1.96 | 0.68 | 2.86 | 3.52 | 1.40 |
| 50786 | HD 89744 | 1.44 | 0.87 | 2.66 | 3.44 | 0.18 |
| 52409 | HD 92788 | 1.53 | 0.79 | 2.49 | 3.34 | 0.094 |
| 53721 | 47 UMa | 0.47 | 0.68 | 2.89 | 2.04 | 0.014 |
| 60644 | HD 108147 | 0.71 | 0.67 | 1.95 | 2.26 | 1.80 |
| 64426 | HD 114762 | 1.07 | 0.93 | 2.58 | 3.21 | 0.27 |
| 65721 | 70 Vir | 0.73 | 0.50 | 1.64 | 1.88 | 0.063 |
| 67275 | Boo | 0.52 | 0.56 | 1.91 | 1.81 | 1.23 |
| 68162 | HD 121504 | 1.91 | 0.81 | 2.78 | 3.77 | 0.77 |
| 72339 | HD 130322 | 2.5 | 1.5 | 4.07 | 5.92 | |
| 74500 | HD 134987 | 1.0 | 1.1 | 2.43 | 3.49 | 0.13 |
| 78459 | CrB | 1.49 | 0.44 | 1.60 | 2.51 | 0.22 |
| 79248 | 14 Her | 1.38 | 0.83 | 2.66 | 3.29 | 0.019 |
| 79336 | HD 187123 | 0.22 | 0.57 | 1.22 | 1.54 | |
| 86796 | HD 160691 | 1.17 | 0.67 | 2.00 | 2.71 | 0.028 |
| 90004 | HD 168746 | 1.53 | 0.84 | 2.20 | 3.47 | |
| 90485 | HD 169830 | 1.25 | 0.64 | 1.63 | 2.71 | 0.18 |
| 93746 | HD 177830 | 0.86 | 0.49 | 1.51 | 1.98 | 0.13 |
| 94645 | HD 179949 | 1.92 | 0.68 | 2.67 | 3.49 | |
| 96901 | 16 Cyg B | 0.73 | 0.57 | 1.81 | 2.05 | 0.026 |
| 98714 | HD 190228 | 1.82 | 0.77 | 2.10 | 3.59 | 0.074 |
| 99711 | HD 192263 | 1.6 | 1.1 | 3.57 | 4.19 | 0.63 |
| 100970 | HD 195019 | 2.24 | 0.78 | 2.95 | 4.03 | 1.41 |
| 108859 | HD 209458 | 1.76 | 0.90 | 3.36 | 3.84 | |
| 109378 | HD 210277 | 0.69 | 0.61 | 2.32 | 2.08 | 0.038 |
| 113020 | Gliese 876 | 2.0 | 1.9 | 5.40 | 6.41 | 0.049 |
| 113357 | 51 Peg | 0.68 | 0.63 | 1.54 | 2.13 | 1.04 |
| 113421 | HD 217107 | 1.23 | 0.85 | 2.30 | 3.18 | 1.60 |
| 116906 | HD 222582 | 1.75 | 0.94 | 4.01 | 3.91 | 0.14 |
| HIP | Name | p | Mass Range | ||||
|---|---|---|---|---|---|---|---|
| number | () | () | (deg) | () | (1) | ||
| 5054 | HD 6434 | 0.96 [0.49] | 1.34 | 0.67 | -0.08 [0.2] | 0.45 | (0.20,0.77) |
| 43177 | HD 75289 | 0.90 | 1.05 | 0.52 | 0.03 | 1.13 | (0.45,2.19) |
| 78459 | CrB | 0.98 [0.99] | 1.49 | 0.46 | 0.54 [-0.9] | 0.12 | (0.086,0.17) |
| 90485 | HD 169830 | 0.92 [0.90] | 1.25 | 0.64 | 2.1 [2.1] | 0.081 | (0.039,0.124) |
| 94645 | HD 179949 | 0.90 | 1.92 | 0.68 | 0.034 | 3.4 | (1.57,6.49) |
| 98714 | HD 190228 | 0.95 [0.91] | 1.82 | 0.77 | 4.5 [5.1] | 0.064 | (0.037,0.093) |
| 100970 | HD 195019 | 0.92 [0.99] | 2.24 | 0.78 | 0.32 [0.3] | 0.92 | (0.51,1.47) |
| HIP | Name | // | References | Commments | |||||
|---|---|---|---|---|---|---|---|---|---|
| number | (pc) | (days) | () | () | |||||
| ∗13769 | HD 18445 | 26 | 0.56 | 555 | 2.6178 | 44 | 26/29/29 | 1 | a |
| ∗19832 | BD 04°782 | 20 | 0.07 | 717 | 3.7883 | 47 | 27/26/27 | 1 | a |
| ∗21482 | HD 283750 | 18 | 0. | 1.788 | 0.0966 | 50 | 22/22/22 | 1 | a |
| ∗21832 | HD 29587 | 28 | 0.36 | 1470 | 4.0125 | 41 | 11/12/12 | 2 | b |
| ∗50671 | HD 89707 | 35 | 0.95 | 297.71 | 1.2924 | 57 | 25/26/26 | 1 | a |
| ∗62145 | HD 110833 | 15 | 0.78 | 271.2 | 1.1159 | 17 | 45/47/47 | 1 | a |
| ∗63366 | HD 112758 | 21 | 0.14 | 103.26 | 0.7434 | 33 | 22/23/24 | 1 | a |
| ∗70950 | HD 127506 | 22 | 0.72 | 2599 | 6.8006 | 36 | 53/55/56 | 1 | a |
| ∗77152 | HD 140913 | 48 | 0.61 | 147.96 | 0.4618 | 46 | 54/57/57 | 1 | a |
| 87330 | HD 162020 | 31 | 0.28 | 8.43 | 0.0418 | 14 | 16/18/18 | 3 | c |
| 88531 | HD 164427 | 39 | 0.55 | 108.55 | 0.4603 | 46 | 24/28/28 | 4 | b |
| 89844 | HD 168443 | 38 | 0.27 | 1667 | 1.1024 | 15 | 15/18/19 | 5 | c,d |
| 104903 | HD 202206 | 46 | 0.42 | 259 | 0.2542 | 15 | 36/35/36 | 3 | c |
| ∗113718 | HD 217580 | 17 | 0.52 | 454.7 | 4.8412 | 67 | 18/17/19 | 1 | a,e |
Note. — , and are the numbers of the Hipparcos FAST measurements, NDAC measurements and the number of satellite orbits included in the star’s analysis. The asterisks mark stars that were already analyzed by Halbwachs et al. The comments:
a. The analysis used the published orbital elements, where was available instead of the radial velocity amplitude.
b. The analysis used the available radial velocities.
c. The analysis used the published orbital elements.
d. The analysis pertains to the outer companion.
e. A similar solution already appears in the Hipparcos catalog.
References. — (1) Halbwachs et al. 2000; (2) Latham, private communication; (3) http://obswww.unige.ch/ udry/planet; (4) Tinney et al. 2001; (5) Udry et al. 2000b;
| HIP | Name | |||||
|---|---|---|---|---|---|---|
| number | () | () | () | () | () | |
| ∗13769 | HD 18445 | 9.44 | 0.95 | 7.30 | 9.66 | 0.13 |
| ∗19832 | BD 04°782 | 17.14 | 0.84 | 14.56 | 19.07 | 0.20 |
| ∗21482 | HD 283750 | 1.20 | 0.77 | 2.76 | 2.97 | |
| ∗21832 | HD 29587 | 4.26 | 0.96 | 10.80 | 6.47 | 0.13 |
| ∗50671 | HD 89707 | 1.39 | 0.58 | 3.61 | 2.72 | 0.16 |
| ∗62145 | HD 110833 | 8.26 | 0.61 | 5.89 | 9.66 | 0.093 |
| ∗63366 | HD 112758 | 4.13 | 0.72 | 3.55 | 5.79 | 0.17 |
| ∗70950 | HD 127506 | 8.4 | 3.9 | 19.12 | 17.37 | 0.10 |
| ∗77152 | HD 140913 | 1.65 | 0.63 | 2.00 | 3.10 | 0.21 |
| 87330 | HD 162020 | 3.3 | 1.5 | 3.81 | 6.75 | |
| 88531 | HD 164427 | 3.11 | 0.66 | 3.14 | 4.63 | 0.36 |
| 89844 | HD 168443 | 1.41 | 0.82 | 5.52 | 3.30 | 0.077 |
| 104903 | HD 202206 | 1.41 | 0.87 | 2.37 | 3.41 | 0.14 |
| ∗113718 | HD 217580 | 11.35 | 0.82 | 12.69 | 13.24 | 0.18 |
| HIP | Name | p | Mass Range | ||||
|---|---|---|---|---|---|---|---|
| number | () | () | (deg) | () | (1) | ||
| ∗13769 | HD 18445 | 0.998 | 9.44 [9.85] | 0.95 | -16.1 | 0.167 | (0.148,0.186) |
| ∗19832 | BD 04°782 | 0.999 | 17.14 [17.15] | 0.84 | 12.77 | 0.242 | (0.227,0.256) |
| ∗62145 | HD 110833 | 0.999 | 8.26 [8.39] | 0.61 | 7.76 | 0.134 | (0.123,0.145) |
| ∗63366 | HD 112758 | 0.996 | 4.13 [4.13] | 0.72 | 10.4 | 0.20 | (0.16,0.24) |
| ∗77152 | HD 140913 | 0.92 | 1.65 [1.64] | 0.63 | 16.3 | 0.17 | (0.10,0.24) |
| 87330 | HD 162020 | 0.94 | 3.3 | 1.5 | 0.73 | 3.30 | (1.04,8.08) |
| 88531 | HD 164427 | 0.99 | 3.11 | 0.66 | 8.5 | 0.35 | (0.27,0.45) |
| ∗113718 | HD 217580 | 0.97 | 11.35 [11.31] | 0.82 | 25.2 | 0.162 | (0.148,0.175) |