VLBI STUDY OF WATER MASER EMISSION IN THE SEYFERT 2 GALAXY NGC 5793. I: IMAGING BLUESHIFTED EMISSION AND THE PARSEC-SCALE JET
Abstract
We present the first result of VLBI observations of the blueshifted water maser emission from the type 2 Seyfert galaxy NGC 5793, which we combine with new and previous VLBI observations of continuum emission at 1.7, 5.0, 8.4, 15, and 22 GHz. Maser emission was detected earlier in single-dish observations and found to have both red- and blueshifted features relative to the systemic velocity. We could image only the blueshifted emission, which is located 3.6 pc southwest of the 22 GHz continuum peak. The blueshifted emission was found to originate in two clusters that are separated by 0.7 milliarcsecond (0.16 pc). No compact continuum emission was found within 3.6 pc of the maser spot. A compact continuum source showing a marginally inverted spectrum between 1.7 and 5.0 GHz was found 4.2 pc southwest of the maser position. The spectral turnover might be due to synchrotron self-absorption caused by a shock in the jet owing to collision with dense gas, or it might be due to free-free absorption in an ionized screen possibly the inner part of a disk, foreground to the jet.
The water maser may be part of a maser disk. If so, it would be rotating in the opposite sense to the highly inclined galactic disk observed in CO emission. We estimate a binding mass within 1 pc of the presumed nucleus to be on the order of 107 . Alternatively, the maser emission could result from the amplification of a radio jet by foreground circumnuclear molecular gas. In this case, the high blueshift of the maser emission might mean that the masing region is moving outward away from the molecular gas surrounding an active nucleus.
1 INTRODUCTION
VLBI observations of water megamasers on (sub-)pc scales in active
galaxies have proven to be a basic tool for investigating the central
regions of active galactic nuclei (AGN). The most impressive result
from this kind of research was the discovery of a thin, nearly edge-on
rotating disk around a super massive black hole at the center of
NGC 4258 Miyoshi et al. (1995); Greenhill et al. 1995a . The VLBI observations revealed the
size and the shape of the slightly-warped maser disk with a central
radio jet outflowing perpendicularly to the disk plane
Herrnstein et al. (1998). VLBI imaging of the water megamasers in NGC 1068,
NGC 4945 and the Circinus galaxy showed the possible existence of
super massive objects at their nuclei similar to NGC 4258
Greenhill et al. (1996); Greenhill & Gwinn (1997); Greenhill et al. (1997); Greenhill (2000). According to the most recent
result, in the Seyfert 2 galaxy IC 2560, the barely resolved maser
spots which constitute the systemic emission show a linear velocity
gradient along the north-south elongation and are accompanied by
continuum emission, probably suggesting a super massive black hole
inside a rotating disk Nakai et al. (1998); Ishihara et al. (2001).
In the Seyfert 2 galaxy NGC 1068, in addition to the nuclear
disk-maser, non-disk maser emission was found some 30 pc away along
the jet from the radio nucleus, that might be the result of
interaction between the jet and the interstellar gas Gallimore et al. (1996). In
the elliptical galaxy NGC 1052, the interpretation of non-disk masers
was introduced to explain the water masers seen lying along the jet
Claussen et al. (1998).
Water megamasers seem to fall into two categories: nuclear
masers residing in a (sub-)parsec scale disk around an active nucleus
and non-nuclear masers which are seen significantly further from the
nucleus. The latter can also be classified into two types, that is,
jet masers associated with radio jets and outflow masers – a wind
component discovered in Circinus Greenhill (2000). The study of non-disk
maser emission is equally important for the investigation of the
overall structure surrounding an active nucleus. In order to
understand the megamaser phenomenon, and to deduce the general
characteristics of the central parsecs of AGN, such as black hole
masses and accretion rates, it is important to investigate as many
megamasers as possible with VLBI imaging at milliarcsecond angular
resolutions. So far, more than 20 galaxies are reported to contain
megamasers (e.g., Braatz et al. 1997, Falcke et al. 2000). Most of
them, however, show weak intensities, and some are thus not observable
with VLBI Moran et al. (1999).
NGC 5793 is an edge-on disk galaxy, at a distance of 46 Mpc,
with a compact nucleus seen in radio continuum emission
Gardner et al. (1992). Baan et al. (1998) classified the nucleus as being a
Seyfert 2 from its optical emission. Hagiwara et al. (1997), using
the Nobeyama 45-m telescope, first detected the water maser emission
with highly Doppler-shifted satellite features, displaced by 245 km son either side of the systemic velocity ( = 3442
km s; Palumbo et al. 1983) of the galaxy. The total isotropic
luminosity of the maser was estimated to be 106 L☉. Fig. 1 shows
a new spectrum of blueshifted maser features measured with the Parkes
64-m telescope. There may be a suggestion of features near the
systemic velocity, which needs confirming. The highly redshifted
features at VLSR= 3677 km s, which were initially detected with the
45-m remain undetected since February 1996. From 1996 we began VLBI
observations using the NRAO111 The National Radio Astronomy
Observatory is a facility of the National Science Foundation operated
under cooperative agreement by Associated Universities, Inc. VLBA and
VLA, investigating the spatial distribution of the water maser
emission and the relationship between the water megamasers and the
nuclear radio activity of NGC 5793.
In this paper we describe the VLBA observations in Section 2,
present new images of the water vapour maser line and continuum
emission in the central parsecs of NGC 5793 in Section 3, and discuss
the nature of the water maser in Section 4. We adopt a distance of 46
Mpc to NGC 5793, corresponding to a scale of 1 milliarcsecond (mas)
0.23 pc.
2 VLBA OBSERVATIONS AND DATA ANALYSIS
2.1 22 GHz Observations
We observed the 6 maser line at 22 GHz (rest
frequency: 22.23508 GHz) toward NGC 5793 for 8 hours on 1998 May 10
using the VLBA and the phased VLA. The use of the VLA as the eleventh
array element was critical to the observation because the peak flux
density of the maser emission is known to be very weak ( 0.1
Jy). The data were recorded in left circular polarization with 2 bit
sampling in four 8 MHz IF bands of 128 spectral channels each
providing a velocity coverage of 108 km s. The four IF bands were
centered on VLSR= 3190, 3442, 3551, and 3667 km s. The observed
velocity ranges are displayed in a single-dish spectrum in
Fig. 1. The channel spacing in each band was 0.83 km sbefore averaging. We observed in a phase-referencing mode, using a
bright calibration source 1507168 about 2 degrees away from
NGC 5793. The total cycle time was two minutes; 1-minute scans on
1507168 and NGC 5793 alternated. The total amount of time spent
integrating on the target source was about 150 minutes. 4C 39.25 and
3C 345 were used for both bandpass and amplitude calibration. All the
data were correlated in NRAO Socorro and calibrated and reduced with
AIPS. The fringe-fit solutions (phase, rate, and delay) obtained from
the calibrator were applied to the IFs containing both the line plus
continuum emission. Five spectral channels were averaged together to
4.2 km sto obtain reasonable sensitivities. The positions of the
maser emission on the sky were determined by 2-D Gaussian fitting to
the maps. To make a continuum map, we averaged all spectral channels
in a line-emission-free IF, centered on 3667 km s.
The continuum and line maps were both made from differently
weighted data to get reasonable sensitivities, resulting in a
synthesized beam size of 2.8 1.8 mas for the continuum map,
and 1.8 1.0 mas for the line map. The rms noise levels are
1.3 mJy beam-1 for the continuum map produced from a single bandwidth of
8 MHz and 4.3 mJy beam-1 for the continuum-subtracted line map for each
averaged channel. The continuum emission was subtracted only in the
region close to C1(C).
2.2 Observations at 1.7, 8.4, and 15 GHz
The 1.7, 8.4, and 15 GHz continuum observations were made on 1999
October 10, using 8 elements of the VLBA. The VLBA stations
Brewster (BR) and Saint Croix (SC) did not take part in the
observations. The four 8 MHz IF bands with left circular polarization
were recorded using 2 bit sampling across a total bandwidth of 32
MHz. We used the frequency agility of the VLBA to switch rapidly among
the three frequencies to obtain better (, ) coverages with
optimal observing time. The observing frequencies were switched
typically every 7 –10 minutes between 8.4 and 15 GHz. The 1.7 GHz
observation was inserted among the other two frequencies about every
40 minutes. The 8.4 and 15 GHz observations were made using the
phase-referencing method, with the same calibrator as at 22 GHz. At
8.4 GHz a total cycle time of about 4 minutes was used for the
calibrator and the galaxy; 3-minute scans on the calibrator and
1-minute scans for the target source were employed. At 15 GHz,
1-minute scans on the calibrator and the target source were
alternated. The total integration time spent on the target source at
each frequency ranged from 60 to 120 minutes. The correlation of all
the data was performed at Socorro. The data were calibrated using
standard AIPS software. The amplitude calibration was made with
observations of 4C 39.25 and 3C 345. The centroid position of the
8.4 GHz continuum source was determined from the phase-referenced
map. Finally, self-calibration was used on the data at 1.7 and 8.4 GHz
to improve the sensitivity of images with DIFMAP.
The maps were made from uniformly weighted data and the
resultant synthesized beam sizes are 23 3.7 mas at 1.7 GHz,
7.0 2.7 mas at 8.4 GHz, and 2.9 0.6 mas at 15 GHz.
The rms noise levels are 0.86 mJy beam-1 for the 1.7 GHz map, 0.35 mJy
beam-1 for the 8.4 GHz map, and 0.82 mJy beam-1 for the 15 GHz map at
total bandwidths of 32 MHz.
2.3 Analysis of Positional Errors
The positional errors ( ) in the VLBI images, dominated by statistical noise, were estimated from the synthesized beam size () divided by the signal-to-noise ratios (SNR). When we estimate relative positional errors between line and continuum maps, they are approximately given by the the equation
where and represent maser and continuum emission images. Thus, the relative positional error between one of the maser lines at the VLSR= 3194 km sfeature and the 22 GHz continuum peak C1(C) is 0.22 mas.
The common reference positions (0, 0) (continuum peak C1(C)) were determined at various frequencies by phase-referencing to the compact source, 1507168. This same calibrator was used for all the observing epochs and there seemed to be neither structural nor positional changes between the two epochs, May 1998 and October 1999. The alignment of the reference positions between the 22 and 8.4 GHz continuum maps was determined from the phase-referenced maps. Assuming that the position error of the common reference source and any structural changes of the reference source between epochs are negligible, the relative positional error between 22 GHz () and 8.4 GHz () is estimated as the following,
where and represent continuum images of a target source and a phase-reference source. In our analysis, the third and fourth term in the formula are negligible as SNR of reference calibrator images are better by on the order of 10 – 100 than those of masers or 22 and 8.4 GHz continuum images of NGC 5793. Consequently, the relative uncertainty of the maser position with respect to the reference point at 8.4 GHz in Fig. 3 is = 0.2 mas. (The inserted values were adopted from the phase-referenced maps without self-calibration.)
3 RESULTS
3.1 Continuum Emission
Fig. 2 and Fig. 3 show radio continuum images at 22 and 8.4 GHz, from which we can identify at least four continuum components C1(C), C2(E), C2(C) and C2(W). The naming of the components follows the convention used in Hagiwara et al. (2000). The 22 GHz peak is coincident with C1(C) in the 8.4 GHz map to an accuracy of 0.25 mas, as estimated in the previous section. The basic morphological structure is quite similar to those at 1.7 and 5.0 GHz given in Fig. 2 and Fig. 3 of the paper by Hagiwara et al. (2000), but at both 15 and 22 GHz only C1(C) is detected. Table 1 lists the Gaussian-fitted peak flux densities of the major compact continuum sources identified at the five frequencies, and Table 2 lists the spectral indices of each component. The flux density and spectral indices were obtained by convolving with the same beam size corresponding to that of the 1.7 GHz map in 1996 to avoid resolution effects. The poor (, ) coverage for the 1.7 GHz observing session in Oct. 1999 resulted in relatively inaccurate component flux densities in comparison with those in Nov. 1996. Fig. 4 shows spectra from four major components imaged in Fig 3. C1(C) shows steep spectral indices (using the convention that Sν , where Sν is the flux density at frequency ) from 1.7 GHz to 15 GHz but a flat index between 15 GHz and 22 GHz. C2(C) and C2(W) have similar spectra: and between 5.0 and 8.4 GHz, and and between 1.7 and 5.0 GHz. The compact component C2(E) that lies within the jet extension and shows an inverted spectrum between 1.7 GHz and 5.0 GHz. The continuum peak of C2(E) was not clearly seen at 1.7 GHz in both epochs, but was seen in a 1.4 GHz map obtained in Dec. 1996 Pihlström et al. (2000).
3.2 Water Maser Emission
We detected maser features that are blueshifted with respect to the
systemic velocity of the galaxy with the VLBA. The maser features are
seen in the averaged channels ranging from VLSR= 3190 km s– 3210
km s. Inset into Fig. 5 is a blueshifted spectrum that shows
the total flux density obtained from our VLBA observations. The
spectrum appears to be a scaled-down version of the the single-dish
spectrum, which suggests that about 50 % of the peak flux density is
detected in VLBA observations. This might be explained by the
intrinsic intensity variability of the water emission or by a loss of
coherence during phase referencing Carilli and Holdaway (1999) or, of course, by a
combination of both. Given the total maser intensity (0.78 Jy km s)
estimated from the VLBA spectrum shown in the inset in
Fig. 5, the isotropic luminosity of the blueshifted emission
is 38 L☉, which is comparable to that of the redshifted emission
(22 L☉) in NGC 4258 Nakai et al. (1995). Fig. 5 shows the
spatial distribution of the water maser spots, where the position of
each maser feature was determined by Gaussian fitting for each
emission peak in the deconvolved images that was detected above
4 level. Our analysis showed that the detected maser emission
is split into two clusters with a separation of 0.7 mas, or 0.16
pc, but there is no discernible velocity structure. Each maser clump,
assuming a nominal size of 0.2 mas, yields a lower limit to the
brightness temperature, Tb 109 K. The centroid
position of the brightest maser feature centered at VLSR= 3194 km s is marked with a cross in Fig. 2 and Fig. 3 in which
the continuum maps are superposed. No continuum emission was detected
at the maser position at any of our observed frequencies. The maser
spot is located 15.5 mas or 3.6 pc from the unresolved radio continuum
peak C1(C) at 22 GHz, which is coincident with a reference point (0, 0) in the 8.4 GHz map in Fig. 3. From VLA-A observations with
a beam size of 130 80 mas (30 18 pc) in 1997
January, this blueshifted maser emission remained unresolved, and was
coincident with the unresolved continuum peak C1(C), supporting our
VLBA results in this paper. The peak of C2(E) at 8.4 GHz is about 18
mas, some 4 pc away from the maser spot, suggesting that the maser
clusters are located nearly at the midpoint of the line joining C1(C)
and C2(E).
We found no velocity features of the water maser corresponding
to the velocities of the HI and OH absorptions, observed with the VLA
by Gardner et al. (1986).
4 DISCUSSION
4.1 Location of the Nucleus
One might ask where the nucleus of NGC 5793 lies? In order to
understand the kinematics of the nuclear region in the galaxy we need
to address this question. Component C1(C) shows a flat-spectrum at
higher frequencies, at which it is not resolved, suggesting that it
might be the ’true’ nucleus. On the other hand, the ‘true’ nucleus may
lie in the continuum emission gap between C1(C) and C2(E) where the
maser spots are located. This would mean that the radio continuum
nucleus could be highly obscured by a screen of dense ionized gas. In
some megamasers like NGC 1068 Greenhill et al. (1996), the Circinus galaxy
Greenhill (2000), and possibly NGC 4945 Greenhill et al. (1997), the existence of
maser disks has been confirmed but continuum emission has not been
detected in the vicinity of the water masers.
The measured surface brightness of C2(E) is at least 3.2
108 K and could in principle be as high as the
1010 K required for synchrotron self-absorption Kellermann & Pauliny-Toth (1969). It
is conceivable that component C2(E) was produced by a strong shock
with the circumnuclear gas. A jet ejected from the nucleus could be
bent and deflected near C2(E) and extend further out to component
C2(W). Alternatively, component C2(E) could be free-free absorbed by
dense ionized foreground gas. The spectral index of +0.13 between 1.7
and 5.0 GHz is not steep enough for free-free absorption, but as it is
a lower limit, it is not inconsistent with such an hypothesis. If
C2(E) is a free-free absorbed component, it could be the inner part of
the disk/torus. However, at this stage we consider
that the spectral turnover of C2(E) is due to synchrotron
self-absorption caused by the collision of a jet from the central
engine with a dense gas in the circumnuclear region.
There might be a change in flux density during the two
observing sessions between Oct. 1999 at 1.7 GHz and Oct. 1997 at 5.0
GHz. If so, the determination of the spectral index of C2(E) is
unreliable. However, the flux density of C2(E) for 1.7 GHz in
Nov. 1996 is quite similar with that in Oct. 1999, hence it is less
likely that there was significant flux density variation from 1996 to
1999 as for C2(E). In any case, there is no straightforward
interpretation for the location of the ’true’ core. For this reason it
is impossible to decide at present whether the water emission in
NGC 5793 is a nuclear or non-nuclear maser.
4.2 Origins of the Water Maser
Interpretation of the geometry of the detected maser emission in NGC 5793 is not straightforward, because the blueshifted features are located between continuum peaks and the velocity fields do not show any systematic trends. However, we discuss two possibilities to explain the nature of the maser in the galaxy:
-
1
The water maser in NGC 5793 results from the amplification of a radio jet by the circumnuclear molecular gas foreground to the jet.
-
2
The maser lies in a in a compact molecular disk rotating around the galactic nucleus, like that in NGC 4258.
Support for the validity of the first model comes from the
presence of molecular (OH) gas with a parsec-scale distribution seen
in absorption against the continuum structure with the VLBA
Hagiwara et al. (2000). The brightness of a putative radio jet component may
not be sufficient to be detected by VLBI in NGC 5793 at 22 GHz. The
brightness temperature of any undetected 22 GHz continuum source near
the maser spots is less than K, assuming that the peak
flux density is 6.5 mJy beam-1 (5 noise level). The beam
averaged brightness temperature of the unresolved maser spot is 1.3
108 K, so that the maser gain would be a factor of
10. Usually, this situation is seen in OH megamasers functioning as
low-gain amplifiers against background continuum sources. Non-nuclear
and non-disk masers have been seen in NGC 1052 Claussen et al. (1998) and
NGC 1068 Gallimore et al. (1996). The non-nuclear water maser known to exist in
NGC 1068, located at 30 pc from the nucleaus along the jet, has not
been detected with VLBI, suggesting that the maser spot is resolved or
not intense enough for VLBI detection. In NGC 1052 two maser spots
are seen lying 0.07 pc from the presumed core along a radio jet; they
show no evidence for disk structure Claussen et al. (1998). Neither of the
above cases seems to explain the maser in NGC 5793 because it
exhibits different characteristics. If the water maser of NGC 5793 is
emitted from the nuclear region, the large blueshift ( 245 km s)
of the maser emission implies that it traces molecular outflows moving
at high speed relative to the molecular disk surrounding the
nucleus. A model of a non-disk maser as described here also has
problems in explaining the single-dish spectrum of the emission.
We now consider the the second possibility, namely that the
masers lie in a molecular disk rotating around the nucleus of the
galaxy as proposed by Hagiwara et al. (1997). Unfortunately, during
the period of observations the systemic and redshifted features became
weaker, and we could not measure the distribution and the velocity
structure of the water masers. If we assume the presence of rotating
disk, the blueshifted features could arise from the edge of the
disk. The emission has been detectable and does not show any velocity
drifts since its discovery in January 1996. In addition, the
peak flux density is less variable than other features. Such properties
are similar to the characteristics of the blue- and
redshifted masers in NGC 4258 Greenhill et al. 1995b . By contrast, the peak
flux densities of features around the systemic velocity have been
particularly variable. Greenhill et al. (1995a) suggested the
possibility that the high-velocity features in NGC 4258 are visible
for substantially longer times than the systemic ones because the
emission might be self-amplified in the long gain paths along the edge
of the disk. Considering these facts, the high-velocity blueshifted
features may trace only a part of the disk, possibly near the tangent
points.
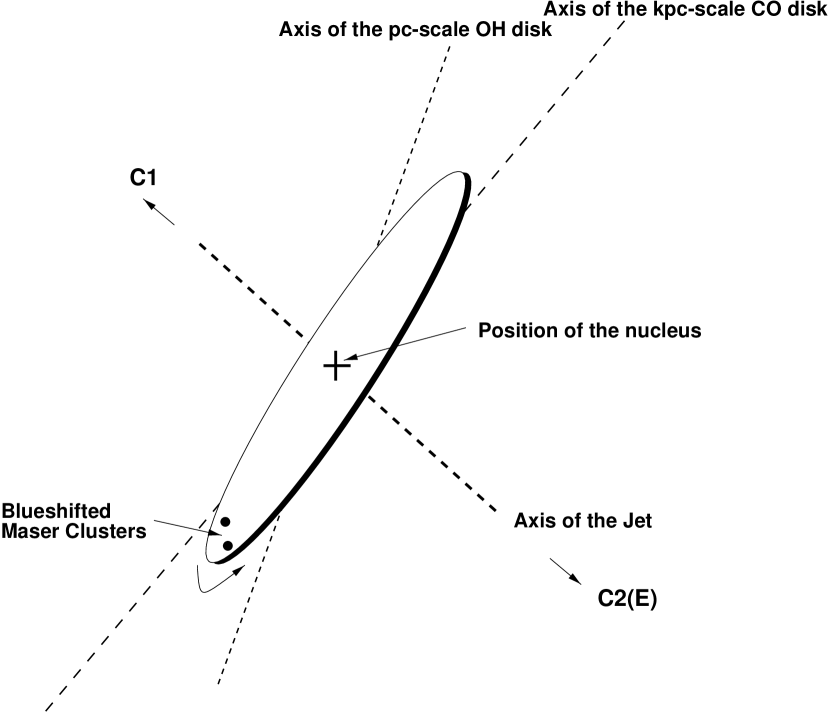
With such a supposition in mind, we propose a model
(Fig. 6) for the nuclear region of NGC 5793. The location of
the nucleus is presumed to lie on the midpoint of the axis connecting
C1(C) to C2(E). This axis may mark the location of a two-sided jet.
The blueshifted maser features are offset from this axis by 4.5
mas, or 1.0 pc. The southern side of the rotating disk, where the
maser clumps lie, is approaching, while the northern side is
receding. The disk orientation is nearly perpendicular to the jet. In
this model, the inferred free-free absorbed source C2(E) lies within
the inner radius of the disk. We estimate that the total mass enclosed
within a radius of 1 pc is 1 107 ,
assuming a rotation velocity of 240 km sand a disk inclination of
73∘ Roth (1994). The mass density is , a value that is the smallest among the
megamasers observed with VLBI Moran et al. (1999). The enclosed mass of
107 is lower approximately by a factor of 10 than
that estimated from the OH absorption in the central region of
10 pc Hagiwara et al. (2000), because we adopted a smaller radius. The sense of
the disk rotation is opposite to that of the galactic disk, which has
a radius of 1 kpc and is observed in CO(J = 1 – 0) emission,
but is the same as that of the OH absorbing gas disk, implying the
existence of an independent kinematical system within the central few
parsecs of the circumnuclear region.
From recent single-dish measurements made in early 2000,
systemic features lying at VLSR= 3430 km sto 3520 km swere found
to be flaring and variable in flux density (Henkel, private
communication), suggesting that the features might arise against the
continuum source at the nucleus along the line of sight, and that the
masing cloud is amplifying the background continuum source.
5 SUMMARY
We have observed the water megamasers and continuum emission in the
nuclear region of the Seyfert 2 galaxy NGC 5793 with the
VLBA. Because of the faintness of the maser intensities, only the
blueshifted emission could be imaged. This emission, which is located
3.6 pc southwest of the radio continuum source, is observed to consist
of two clusters with a separation of 0.7 mas (0.16 pc). No compact
continuum emission was detected near to the maser spot. The detected
water maser could be a part of a maser disk as in the case of
NGC 4258. We propose a model in which the masers lie on the southern
edge (approaching side) of a rotating molecular gas disk whose
orientation is nearly perpendicular to the jet. Assuming the location
of the nucleus at a midpoint between C1 and C2(E) one can estimate a
binding mass on the order of 107 . Alternatively, the
masers could result from the amplification of a radio jet by
foreground circumnuclear gas. The highly blueshifted velocity of the
maser features might mean that the masing cloud traces outflowing
gas surrounding an active nucleus.
The compact continuum source, C2(E) appears to have an
inverted spectrum between 1.7 and 5.0 GHz, assuming no intrinsic
variability, and the spectral turnover might be due to synchrotron
self-absorption caused by a shock in the jet owing to collision with
the dense gas, or a free-free absorbing screen in a part of an ionized
torus/disk.
Further VLBI observations of the water masers and continuum
emission are crucial to clarify the dynamical structures of the maser
emission in relation to the active nucleus. The systemic and
redshifted velocity features flared in early 2000 and additional VLBA
observations, following up our present result, are already underway.
References
- Baan et al. (1998) Baan, W. A., Salzer, J. J., & LeWinter, R. D. 1998, ApJ, 509, 633
- Braatz et al. (1997) Braatz, J. A., Wilson, A. S., & Henkel, C. 1997, ApJS, 110, 321
- Carilli and Holdaway (1999) Carilli, C. L., & Holdaway, M. A. 1999, Radio Science, 34, 817
- Claussen et al. (1998) Claussen, M. J., Diamond, P. J., Braatz, J. A., Wilson, A. S., & Henkel, C. 1998, ApJ, 500, L129.
- Falcke et al. (2000) Falcke, H., Henkel, Chr., Peck, A. B., Hagiwara, Y., Prieto, M. A., & Gallimore, J. F. 2000, A&A, 358, L17
- Gallimore et al. (1996) Gallimore, J. F., Baum, S. A., & O’Dea, C. P. 1996, ApJ, 464, 198
- Gardner and Whiteoak (1986) Gardner, F. F., & Whiteoak, J. B. 1986, MNRAS, 221, 537
- Gardner et al. (1992) Gardner, F. F., Whiteoak, J. B., Norris, R. P., & Diamond, P. J. 1992, MNRAS, 258, 296
- (9) Greenhill, L. J., Jiang, D. R., Moran, J. M., Reid, M. J., Lo, K.-Y., & Claussen, M. J. 1995a ApJ, 440, 619
- (10) Greenhill, L. J., Henkel, C., Becker, R., Wilson, T. L., & Wouterloot, J. G. A. 1995b, A&A, 304, 21
- Greenhill et al. (1996) Greenhill, L. J., Gwinn, C. R., Antonucci, R., & Barvanis, R. 1996, ApJ, 472, L21
- Greenhill & Gwinn (1997) Greenhill, L. J., & Gwinn, C. R. 1997, Ap&SS, 248, 261
- Greenhill et al. (1997) Greenhill, L. J., Moran, J. M., & Herrnstein, J. R. 1997, ApJ, 481, L23
- Greenhill (2000) Greenhill, L. J. 2000, in the Proceedings of the 5th EVN Symposium. eds. Conway, J. E., Polatidis, A. G., Booth, R. S. & Pihlström, Y. M. (Onsala Space Observatory, Sweden), p101
- Hagiwara et al. (1997) Hagiwara, Y., Kohno, K., Nakai, N., & Kawabe, R. 1997, PASJ, 49, 171
- Hagiwara (1998) Hagiwara, Y. 1998, Ph.D Thesis, The Graduate University for Advanced Studies
- Hagiwara et al. (2000) Hagiwara, Y., Diamond, P. J., Nakai, N., & Kawabe, R. 2000, A&A, 360, 49.
- Herrnstein et al. (1998) Herrnstein, J. R., Greenhill, L. J., Moran, J. M., Diamond, P. J., Inoue, M., Nakai, N., & Miyoshi, M. 1998, ApJ, 497, 69
- Ishihara et al. (2001) Ishihara, Y., Nakai, N., Iyomoto, N., Makishima, K., Diamond, P., & Hall, P. 2001, PASJ, 53, 215
- Kellermann & Pauliny-Toth (1969) Kellermann, K. I., & Pauliny-Toth, I. I. K. 1969, ApJ, 155, 71
- Miyoshi et al. (1995) Miyoshi, M., Moran, J., Herrnstein, J., Greenhill, L., Nakai, N., Diamond, P., & Inoue, M. 1995, Nature, 373, 127
- Moran et al. (1999) Moran, J. M., Greenhill, L. J., & Herrnstein, J. R. 1999, J. Astrophys. Astron., 20, 165
- Nakai et al. (1995) Nakai, N., Inoue, M., Miyazawa, K., Miyoshi, M., & Hall, P. 1995, PASJ, 47, 771
- Nakai et al. (1998) Nakai, N., Inoue, M., Hagiwara, Y., Miyoshi, M., & Diamond, P. J. 1998, in Radio Emission from Galactic and Extragalactic Compact Sources., ed. J. A. Zensus, G.B. Taylor, & J. M. Wrobel (San Francisco: ASP), 237
- Palumbo et al. (1983) Palumbo, G. G. C., Tanzella-Nitti, G., & Vettolani, G. 1983, in Catalogue of radial velocities of galaxies., (New York: Gordon and Breach Science Publishers)
- Pihlström et al. (2000) Pihlström, Y. M., Conway, J. E., Booth, R. S., Diamond, P. J., & Koribalski, B. S. 2000, A&A, 357, 7
- Roth (1994) Roth, J. 1994, AJ, 108, 862


| Component Flux Densities | ||||||
|---|---|---|---|---|---|---|
| (mJy beam-1) | ||||||
| Frequency | ||||||
| Band | C1(C) | C2(E) | C2(C) | C2( W) | Epoch | Reference |
| (GHz) | ||||||
| 1.4 | 304 | 16.3 | 15.6 | 23.1 | Dec. 96 | a |
| 1.7 | 308 | 16.1ddAn upper limit value | 18.0 | 28.3 | Nov. 96 | b |
| 274 | 15.2ddAn upper limit value | 13.9 | 14.7 | Oct. 99 | c | |
| 5.0 | 139 | 18.5 | 10.6 | 12.2 | Oct. 97 | b |
| 8.4 | 64.5 | 9.42 | 6.73 | 7.31 | Oct. 99 | c |
| 15 | 16.4 | Oct. 99 | c | |||
| 22 | 16.3 | May 98 | c | |||
Note. — Flux uncertainties assume 5 persent calibration uncertainty added. All the flux densities are estimated with the synthesized beam at 1.7 GHz (12.4 4.4 mas).
| Component Spectra, | ||||
|---|---|---|---|---|
| (Sν ) | ||||
| Frequency Range | ||||
| (GHz) | C1(C) | C2(E) | C2(C) | C2(W) |
| 1.7aaY. Pihlström, private communication 5.0 | 0.70 | 0.13 | 0.46 | 0.72 |
| 5.0 8.4 | 1.5 | 1.3 | 0.88 | 0.99 |
| 8.4 15 | 2.3 | |||
| 15 22 | 0.017 | |||