Galaxies and Genes: Towards an Automatic Modeling of Interacting Galaxies
Abstract
The main problems in modeling interacting galaxies are the extended parameter space and the fairly high CPU costs of self-consistent N-body simulations. Therefore, traditional modeling techniques suffer from either extreme CPU demands or trapping in local optima (or both). A very promising alternative approach are evolutionary algorithms which mimic natural adaptation in order to optimize the numerical models. One main advantage is their very weak dependence on starting points which makes them much less prone to trapping in local optima. We present a Genetic Algorithm (GA) coupled with a fast (but not self-consistent) restricted N-body solver. This combination allows us to identify interesting regions of parameter space within only a few CPU hours on a standard PC or a few CPU minutes on a parallel computer. Especially, we demonstrate here the ability of GA-based fitting procedures to analyse observational data automatically, provided the data are sufficiently accurate.
1 Introduction
Interacting galaxies are among the most fascinating astronomical objects in the universe. The fate of these galaxies span a wide range from single distant encounters to close encounters which might end in a single merged system. Typical morphologies include e.g. bridges between the interaction partners or tidal tails. These structures are usually the sites of strong star formation resulting in dense star clusters or even dwarf galaxy sized objects. Additionally, a central star burst might be triggered by tidally induced bars which funnel matter to the galactic centre. This coupling between galactic dynamics and ”microphysical” processes (like star formation) provides a unique tool for a deeper understanding of galactic evolution.
An important prerequisite for the analysis of dynamically induced mechanisms is the knowledge of the dynamics of the interaction itself. E.g. the age of a tidally formed stellar system derived from a colour-magnitude diagram should be related to the time passed by since the last perigalactic passage(s) (though they need not to be identical). The main difficulty for a detailed modeling is the extended parameter space which contains orbital and structural parameters of both interacting galaxies. Already a simple interaction of a galactic disk with a galaxy described by a point mass needs 7 parameters. Covering this parameter space by a ”complete” grid of 10 grid points per dimension requires more than 4 years of CPU time on a GRAPE5 special purpose computer. More efficient search strategies like gradient methods suffer from their dependence on initial conditions and, thus, a possible trapping in local optima.
An alternative are genetic algorithms (GAs) (Holland 1975, Charbonneau 1995) coupled with fast N-body methods. Because GAs need about or more simulations, a single simulation should not exceed 10 CPU secs. Contrary to self-consistent simulations, restricted N-body simulations (Toomre & Toomre 1972) can be performed in one or a few CPU seconds on a modern PC. Hence, they allow for a fast investigation of the parameter space including both, finding a good fit and testing preferred models on their uniqueness (Wahde 1998, Theis 1999).
So far, the GA-based analyses have been used to model artificial data generated by restricted N-body simulations. By this, the uniqueness of preferred interaction scenarios for NGC 4449 (Theis & Kohle 2001) and NGC 4631 (Theis & Harfst 2001) have been tested. In this paper, we investigate if and how observed data can be modeled automatically without the need of a known reference model calculated by a restricted N-body simulation. In the next section we describe the basics of genetic algorithms. In Sect. 3 we study two cases: First, we generate an artificial FITS image from a self-consistent N-body simulation and try to fit it by our GA. In the second test, we use HI observations as direct input (data from M 51). The results are summarized in Sect. 4.
2 Genetic Algorithm
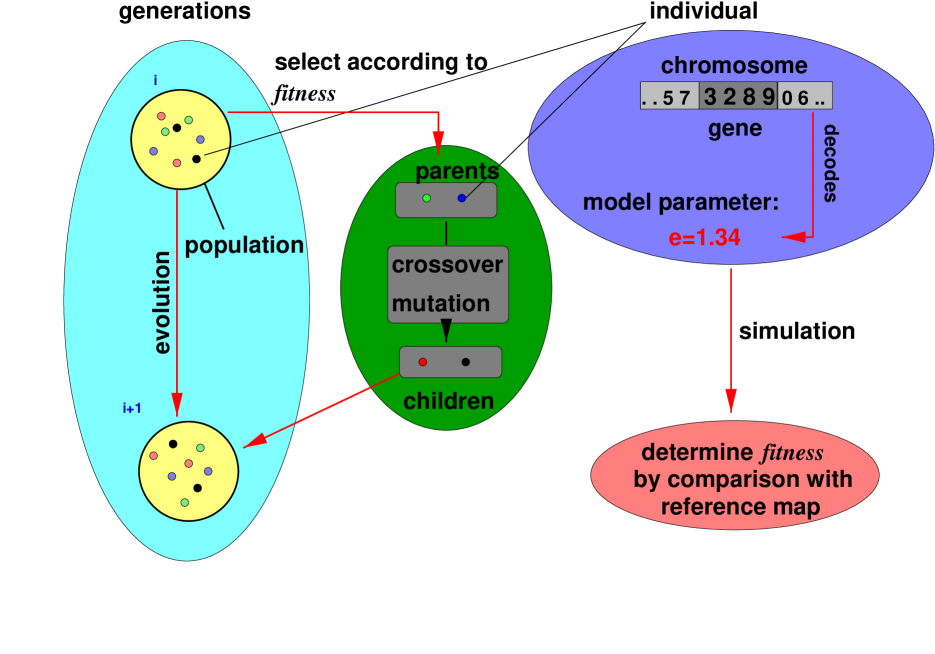
The main idea of genetic algorithms is the application of evolutionary mechanisms in order to ’breed’ a more and more adapted population (Fig. 1). Each member of a population represents a single point in parameter space, i.e. a N-body simulation with a given set of parameters. The members are characterized by their fitness which quantifies the correspondance between the simulations and the reference map (observation or numerical model). In order to determine the ’parents’ two individuals are selected according to their fitness. These parents are two points in parameter space. The parameters of each individual are converted to a ”universal” alphabet (here 4-digit numbers) and then combined to a single string, the ’chromosome’. This chromosome is subject to a cross-over111Cross-over e.g. is realized by swapping the ends of two chromosomes at a randomly chosen cross-over position. and a mutation operation resulting in a new individual which is a member of the next generation. Such a breeding is repeated until the next generation has been formed. Finally, the whole process of creating new generations is repeated iteratively until the population confines one or several regions of sufficiently high fitness in parameter space. For more details see Theis (1999) or Theis & Kohle (2001).
In addition to the advantage of GAs to be almost independent on the initial (randomly) chosen population and, hence, their ability to leave local optima, GAs are easily parallelized. Using a master-slave technique a single fit can be done in a few CPU minutes on a CRAY T3E or a large Beowulf cluster (Theis & Harfst 2000).
3 Towards an automatic fitting procedure
3.1 Recovering artificial intensity maps
This section describes two tests. In the first test we use a self-consistent model of NGC 4449. We ”observe” it with a numerical telescope and use the derived FITS image as an input for our GA. Contrary to previous applications this task checks the applicability of FITS images as an input source of the GA. Additionally (and more important), it tests whether the restricted N-body models can be used to fit a system with an independently derived map: here differences between the restricted N-body and the self-consistent simulations concern e.g. the treatment of the halo and the initial setup of the disk (no dark halo and – initially – only purely circular motions in the case of restricted N-body simulations).
| parameter | reference | equal weight | ||
|---|---|---|---|---|
| eccentricity | 0.5 | 0.88 | 0.52 | 0.5 |
| mass ratio | 0.2 | 0.11 | 0.17 | 0.13 |
| perigalactic distance | 25.0 | 18.2 | 23.3 | 24.1 |
| orbital inclination | 40.0 | 25.0 | 42.7 | 45.8 |
| inclination of disc | 60.0 | 53.9 | 58.2 | 58.5 |
| P.A. of disc | 230.0 | 234.8 | 226.1 | 230.2 |
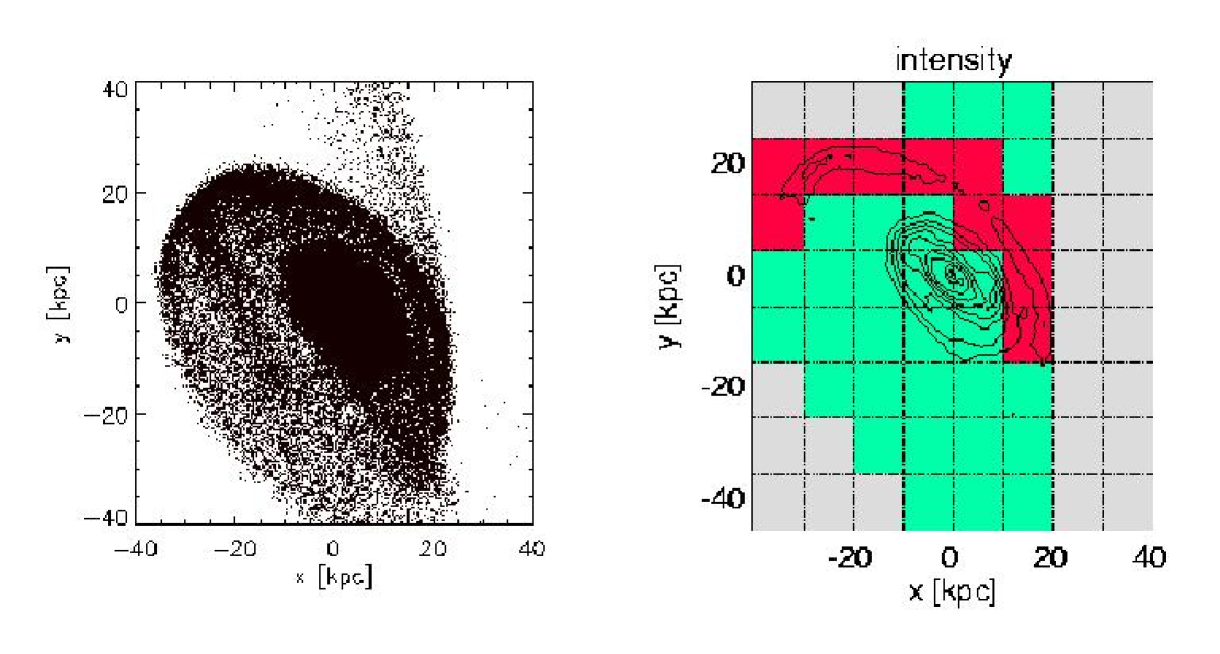
The self-consistent numerical model is identical to the model of Theis & Kohle (2001). Fig. 2 shows the particle distribution of the N-body simulation and the derived intensity map (contour lines). The comparison between this reference map and the numerical simulations, i.e. the determination of the fitness, is performed by , where the sum extends over all grid cells. quantifies the deviation between both maps. It can be calculated e.g. from relative or absolute differences of the intensities. is the statistical weight of a cell. If all cells have equal weight, we get here a poor fit, as Tab. 1 demonstrates (though some parameters like the orientation of the disk are nicely reproduced).
A much better fit can be achieved, if the tidally induced structures get a larger statistical weight. As an example we split the fitness grid into three regions (Fig. 2, right): One region contains the main tidal feature, the streamers (dark), another one covers the region where galactic matter is found () and, finally, there is a region without any particles. Already a weight of of the streamers improves the result substantially: all parameters are recovered within 15% accuracy, most of them even much better.
3.2 Recovering observational intensity maps
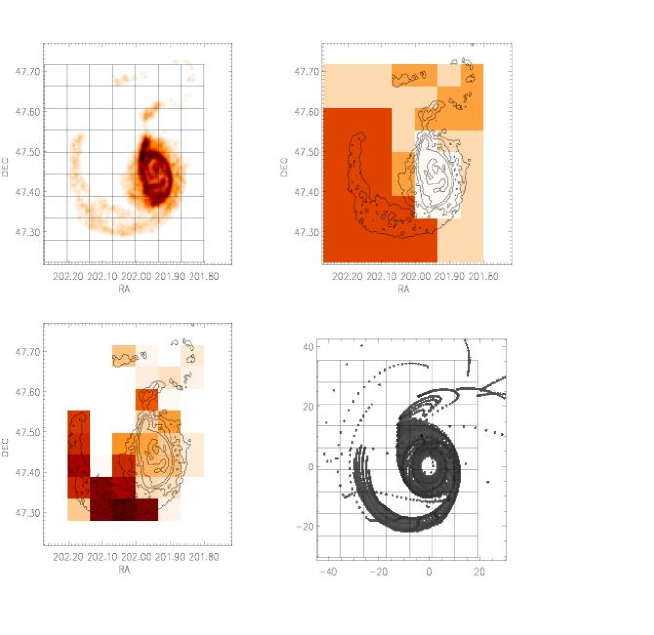
As a second test we used HI observations of M 51 (Rots et al. 1990) as a direct input for our genetic algorithm. The HI data are shown in the upper left diagram of Fig. 3. The centers of both galaxies are in the dark area covering only two adjacent grid cells. However, the HI distribution is much more extended. Assuming that these structures are formed by galactic tides, they should be the prime targets for modeling the interaction of NGC 5194 and NGC 5195. Therefore, we increased their statistical weight in the GA analysis.
Typically, the GA easily recovers the extended tidal arm in the south-east. Additionally, HI is found north of NGC 5195, though its detailed structure is more difficult to model. Different to the artificial maps created by an N-body simulation, the error cannot be estimated from the known solution. Therefore, we compared the results of a small series of different GA runs. The relative deviation of the derived parameters varies between a few percent (the orbital inclination) up to 25% (e.g. eccentricity, mass ratio of the galaxies). It is remarkable that all models are characterized by a highly inclined (), elliptical () orbit. The mass ratio of both galaxies is .
4 Summary
We have demonstrated that GA-based fitting strategies cannot only be used to check the uniqueness of preferred interaction scenarios, but also for an automatic fit of given observational high-quality data. Different to uniqueness tests where the same numerical procedures are applied for the generation of reference maps and the GA fitting procedure, it is – at least – useful (if not necessary) to emphasize tidally affected structures by a larger statistical weight. In that case the GA is able to reproduce given intensity maps (here for M 51 and NGC 4449). The interaction parameters are determined within a statistical error of 25% or better.
As a next step we plan to use the velocity information for the
fitness calculation. At least for some interacting galaxies, we expect
to get better constrained models, as Salo & Laurikainen (2000)
demonstrated in the case of M 51.
Acknowledgements. The authors are grateful to Paul Charbonneau and Barry Knapp for providing their (serial) genetic algorithm pikaia. Additionally, we thank Albert Bosma and Lia Athanassoula for providing us with the HI data of M 51. The artificial intensity map of the self-consistent simulation was created with the NEMO N-body analysis package.
-
References
-
Charbonneau P., 1995, Astrophys. J. Supp., 101, 309
-
Holland J., 1975, Adaptation in natural and artificial systems, Univ. of Michigan Press, Ann Arbor
-
Rots A.H., Bosma A., van der Hulst J.M. et al., 1990, Astron. J., 100, 387
-
Salo H., Laurikainen E., 2000, Mon. Not. R. Astron. Soc., 319, 377
-
Theis Ch., 1999, Rev. Mod. Astron., 12, 309
-
Theis Ch., Harfst S., 2000, in Dynamics of Galaxies: from the Early Universe to the Present, F. Combes et al. (eds.), ASP conf. ser. 197, p. 357
-
Theis Ch., Harfst S., 2001, in Proc. of Evolution of Galaxies. I – Observational clues, Granada, J. Vilches et al. (eds.), in press
-
Theis Ch., Kohle S., 2001, Astron. Astrophys., in press (see also astro–ph/0104304)
-
Wahde M., 1998, Astron. Astrophys. Supp., 132, 417