12CO(1–0) observations of NGC 4848:
a Coma galaxy after stripping
We study the molecular gas content and distribution in the Coma cluster spiral galaxy
NGC 4848 which is Hi deficient and where the remaining atomic gas is
on one side of the galaxy, presumably because of the strong ram-pressure
in the rich Coma cluster. Plateau de Bure interferometric CO(1–0) observations
reveal a lopsided H2 distribution with an off-center secondary maximum
coincident with the inner part of the Hi. NGC 4848 is not at all
deficient in molecular gas as it contains
M M⊙ in the central and inner disk regions.
As predicted by earlier calculations, ram-pressure has little influence
on the dense molecular gas in the inner disk, which appears dynamically normal
at our 2 kpc resolution. At the interface between the CO and Hi emission regions,
about 8 kpc NW of the center, however, strong star formation is present as witnessed
by H and radio continuum emission. From the radio and H fluxes
we estimate the star formation rate in the northern emission region to be close to
0.3 M⊙ yr-1, nearly that of an average quiescent spiral.
This is the region in which
earlier Fabry-Pérot observations revealed a double-peaked H line,
indicating gas at two different velocities at the same sky position.
In order to understand these observations, we present the results of numerical
simulations of the galaxy-cluster ICM interaction. We suggest that NGC 4848
already passed through the center of the cluster about 4 108 years ago.
At the observed stage ram pressure has no more direct dynamical influence on the
galaxy’s ISM. We observe the galaxy when a fraction of the stripped gas is falling
back onto the galaxy.
Ram pressure is thus a short-lived event with longer-lasting consequences.
The combination of ram-pressure and rotation results in gas at different
velocities colliding where the double-peaked H line is
observed. Ram-pressure can thus result, after re-accretion, in displaced molecular
gas without the H2 itself being pushed efficiently by
the intracluster medium. This process, however, requires strong stripping, such that
only galaxies with radial orbits can be affected as much as NGC 4848.
A scenario where two interactions take place simultaneously is also
consistent with the available data but less probable
on the basis of our numerical simulations.
Key Words.:
Galaxies: individual: NGC 4848 – Galaxies: interactions – Galaxies: ISM – Galaxies: kinematics and dynamics1 Introduction
Single dish Hi 21 cm line observations show that the spiral galaxies in the central part ( 1.5o) of a large galaxy cluster have less atomic gas than field galaxies of the same morphological type and optical diameter, i.e. they are Hi deficient (see e.g. Giovanelli & Haynes 1985, Gavazzi 1989). High resolution observations reveal distortions in their Hi distribution (Bravo-Alfaro et al. 2000). Despite their reduced atomic gas content, the molecular mass of Hi deficient galaxies is comparable to that of corresponding field galaxies (Kenney & Young 1989 for the Virgo cluster; Casoli et al. 1991, Boselli et al. 1997 for the Coma cluster). This suggests that the mechanism which is responsible for the removal of the atomic gas does not affect the molecular phase.
The only type of galaxy-cluster interaction which removes the neutral Hi gas from the outer disk without modifying the molecular gas phase or stellar distribution is ram pressure stripping (Gunn & Gott 1972). Ram pressure is exerted by the hot intracluster medium (ICM) on the interstellar medium (ISM) of the fast moving galaxy and is proportional to the galaxy velocity squared and the ICM density. Spiral galaxies are recent cluster members (Tully & Shaya 1984, Solanes 2000). Many of them should have eccentric orbits, leading them near the cluster center. The gas in clusters is so centrally concentrated that ram-pressure is only important close to the center. When the consequences of ram-pressure are visible, it means the galaxy has already passed through the center if it is Hi deficient () (Vollmer et al. 2001). Combes et al. (1988) and Kenney & Young (1989) have shown that molecular clouds are located too deep in the galaxy’s gravitational potential and have column densities too high to be removed by ram pressure. Ram pressure stripping removes only atomic gas clouds with lower column densities but it can alter the orbits of the molecular clouds once much of the Hi is stripped (Vollmer et al. 2001).
The effects of ram pressure depend on the galaxy orbit and the inclination angle between the orbital and the disk plane. Numerical simulations (Vollmer et al. 2001) show that in the case of small ram pressure not only strips the atomic gas from the outer parts of the disk but also pushes a considerable amount of gas to smaller galactic radii. This leads to a very short-lived enhancement of the gas surface density in the inner disk which might lead to an enhanced star formation activity there. Furthermore, gas clouds which are not accelerated to the escape velocity during the stripping event will fall back to the galaxy within a few 108 yr, colliding with the galaxy ISM. While ram-pressure leads to a long-term decrease in the gas mass (Kenney & Young 1989) and star formation rate (SFR; Kennicutt 1983), it can temporarily lead to an increase in the gas density, and thus presumably the SFR, in two ways: () for yr during the closest passage to the cluster center or () for a few yr after the closest passage if re-accretion takes place in disk regions where the gas has not been stripped. We have found the signature of the back-falling gas in one spiral galaxy in the Virgo cluster (NGC 4522, Vollmer et al. 2000).
The Coma cluster is the densest ( cm-3, Hughes et al. 1989) and most X-ray luminous cluster ( erg s-1, Jones & Forman 1984) in our neighborhood. It has been extensively studied at several wavelengths (Hi 21 cm: Giovanelli & Haynes 1985, Gavazzi 1987;1989, Bravo-Alfaro et al. 2000; CO: Casoli et al. 1991; optical: Colless & Dunn 1996, Biviano et al. 1996; H: Amram et al. 1992; UV: Donas et al. 1995, X-rays: Briel et al. 1992, White et al. 1993, Vikhlinin et al. 1997) resulting in a detailed view of this cluster.
In general it is believed that ram pressure stripping quenches star formation (see e.g. Poggianti 1999). However, Donas et al. (1995) observed an enhancement of the median UV flux and the fraction of blue star-forming galaxies in a ring-like region 25′ (0.7 Mpc) from the Coma cluster center. The majority of these galaxies are Hi deficient. They concluded that a global physical process which leads to the Hi deficiency of these cluster galaxies might induce star formation in a rich cluster such as Coma.
The evolution of the SFR is a key factor determining the future appearance of galaxies. Since stars form in molecular clouds, we investigate the effect of ram-pressure on the molecular gas in the environment where it should be most clearly discernible – that of a rich cluster. We present high-resolution CO(1–0) observations of NGC 4848, an Hi deficient UV-bright spiral galaxy in the richest nearby cluster – Coma. It is classified as a blue disk galaxy in the sample of Bothun & Dressler (1986). Since it is far away from the cluster center (1 Mpc) and highly Hi deficient but still forms stars at a high rate (3 M⊙ yr-1), it is an ideal candidate for the scenario described above where the stripped gas falls back onto the galactic disc. We are thus able to test our simulations directly with observations at multiple wavelengths.
We compare the molecular gas distribution and velocity field of NGC 4848 with Hi and H interferometric observations. With the help of our dynamical model simulating ram pressure stripping, we investigate the link between the stripping event and star formation. The structure of this article is the following: The CO(1–0) observations are presented in Sect. 2–4. They are compared in Sect. 5 to H band, B band, Hi, H, and 20 cm continuum images. In Sect. 6 we discuss the observational data. The numerical model is presented and compared to the observations in Sect. 7. Alternative scenarios are discussed in Sect. 8, which is followed by the conclusions (Sect. 9).
We adopt a distance of 100 Mpc for the Coma cluster, corresponding to a Hubble constant of about 70 km sMpc-1. All velocities are heliocentric ().
2 Observations
The observations were made with the IRAM interferometer of Plateau de Bure (see description in Guilloteau et al. 1992). We observed NGC 4848 in April 1999 with the 5D configuration at 112.5674 GHz during 6 hours and in May 1999 with the 5C configuration during 7 hours. The antenna half-power primary beam was 45′′; the primary beam field was centered on the optical center of NGC 4848. A total bandwidth of 435 MHz (1160 km s-1) centered on vsys=7200 km s-1 was observed with a resolution of 2.5 MHz (6.6 km s-1).
Data calibration was made in the standard way using the “CLIC” software package (Lucas 1992). The RF passband was calibrated at the start of each session observing 3C273 or 0923+392. The relative phase of the antennas was checked every 20 mn on the nearby quasars 1308+326 and 1328+307. The rms atmospheric phase fluctuations were typically between 10o and 30o. We applied a Hanning smoothing to the channels giving 58 channels of width 20 km s-1. The resulting beam size is . The rms noise of one of these channels is 2.3 mJy/beam (TB=0.012 K).
3 Results
The physical properties of NGC 4848 can be found in Table 1.
-
a
RC3
-
b
Dressler (1980)
-
c
Donas et al. (1995)
-
d
Gavazzi & Boselli (1996)
-
e
Moshir et al. (1990)
-
f
Bicay & Giovanelli (1987)
-
g
Gavazzi et al. (1998), is corrected for 1 magnitude extinction
-
h
Amram et al. (1992)
-
j
this paper
-
k
Giovanelli & Haynes (1985)
The complete 12CO(1–0) cube is shown in Fig. 1. The integrated spectrum over a box of 20 covering the whole CO emission can be seen in Fig. 2. The velocities are centered on vsys=7200 km s-1. The flux density of the receding part of the galaxy (south) is slightly higher than that of the approaching side (north). The total CO flux is =41 Jy km s-1. Using the formula of Kenney & Young (1989):
| (1) |
where is the distance of the galaxy in Mpc gives a total mass of molecular gas of =4.5 109 M⊙. This corresponds to a conversion factor of cm.
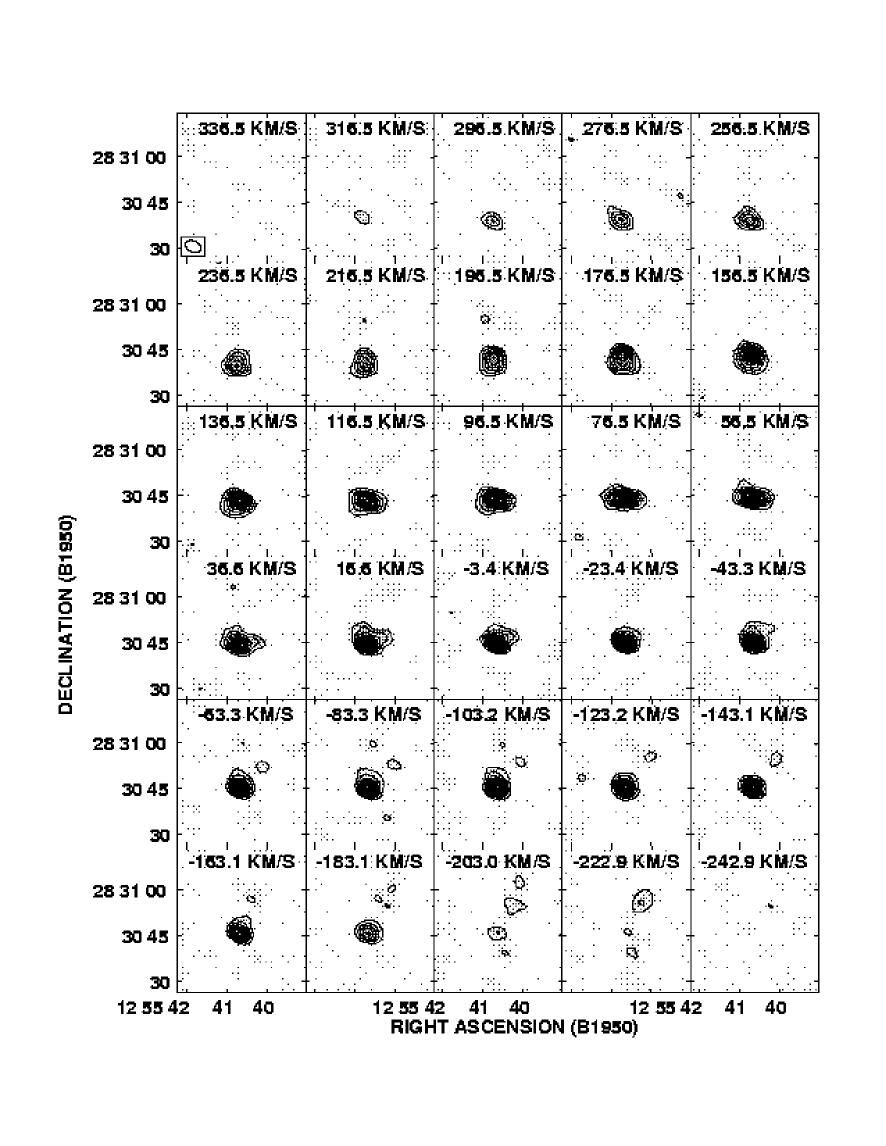

The CO emission distribution calculated using a cutoff of 3 is shown in Fig. 3.
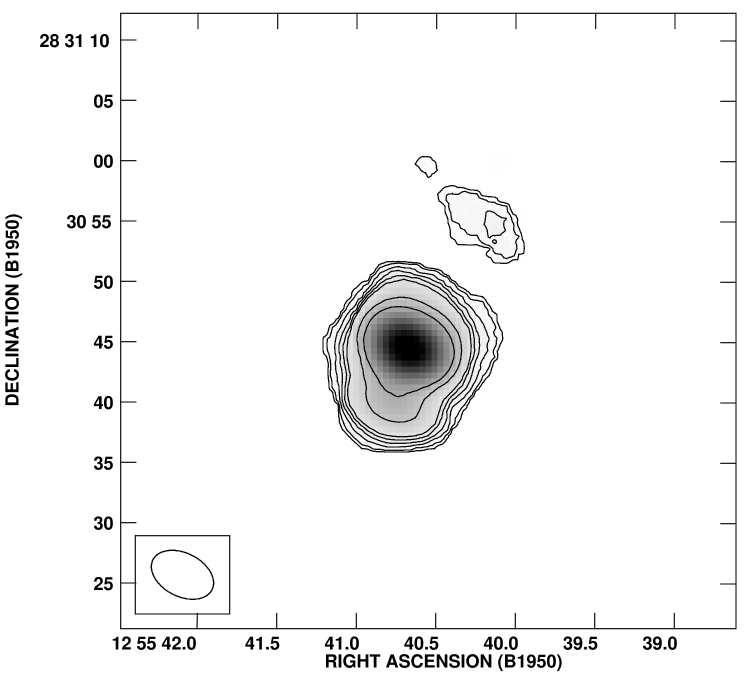
The major part of the integrated intensity is found in the central part of the galaxy. The galaxy’s rotation is clearly observed in the channel maps. It ranges from -203 to 316 km s-1 (with respect to km s-1). The maximum of the CO emission coincides with the optical galaxy center. The emission is elongated in the south-east direction corresponding roughly to the position angle of the galaxy. The most interesting feature is located in the north-west of the galaxy center. There, an emission region which is hardly spatially resolved is detected. The CO flux within this region is Jy km s-1 corresponding to a molecular hydrogen mass of M⊙. This emission region appears in nine different channels from -243 to -84 km s-1. In the integrated intensity map its highest contour is at 0.88 Jy/beamkm s-1.
4 Kinematics
The velocity field of the CO emission is plotted in Fig. 4.

It is worth noting that within the northern emission region there is a velocity gradient of km s-1 within only one beam. This gradient appears to be perpendicular to that of the rotation of the gas in the disk, but since this is observed within one beamsize it is not clear if the direction of the gradient is real. In order to determine the rotation curve we have taken the optical galaxy center as a first guess for the dynamical center. First, we averaged the approaching and receding side of the galaxy up to a radius of 30′′ excluding points within a sector of 30o around the minor axis. The derived dynamical center coincides with the optical one. The results for the other parameters are given in Table 1. The parameters as well as the rotation curves itself are in good agreement with the values derived by Amram et al. (1992). The corresponding position–velocity diagram together with the our CO rotation curve and the H rotation curve of Amram et al. (1992) are shown in Fig. 5.
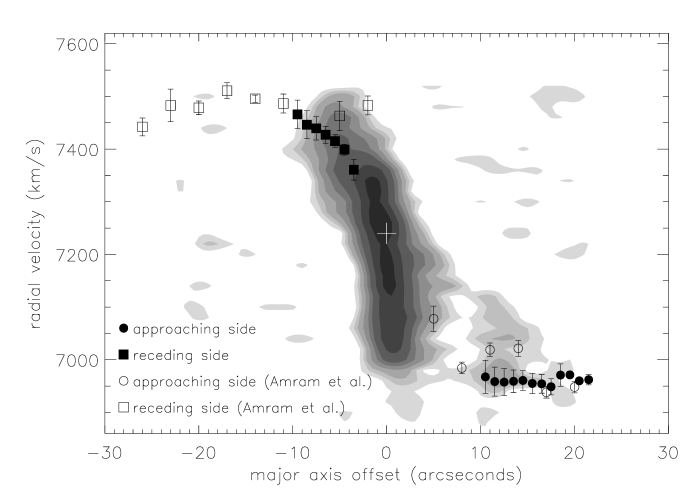
The rotation curve rises steeply in the inner part of the galaxy. In the outer regions it is flat with a rotation velocity of =270 km s-1. The rotation curve rises more slowly at the receding side, which could be due to the deviation of the galaxy’s dynamical major axis from the galaxy’s position angle and/or due to beam smearing.
5 Comparison with other wavelengths
5.1 Near Infrared (H band)
Gavazzi et al. (1996) observed NGC 4848 in the H band (1.65 m) with a resolution of .
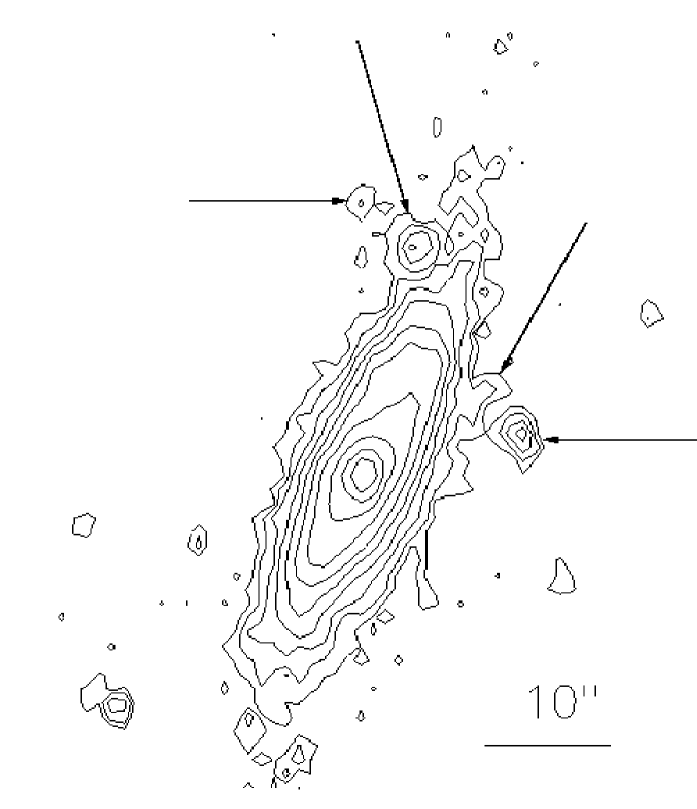
Fig. 6 shows an almost unperturbed large scale disk, i.e. the isophots are regular and do not show a major perturbation. Since the H band traces the old stellar population, we can conclude that the galaxy has not undergone a recent major gravitational interaction. However, its gas distribution and kinematics traced by the CO, Hi, and H emission distributions and velocity fields show major asymmetries and perturbations in the north. This suggests that an ICM–ISM interaction has selectively disturbed the ISM of NGC 4848. Nevertheless, there could be a minor perturbation of the old stellar population in the northern part of the galaxy where an alignment of four distinct spherical emission regions, which runs at an angle of across the main stellar disk, can be distinguished (arrows in Fig. 6). This feature will be discussed in Section 8.2.
5.2 Optical B band image
Gavazzi et al. (1990) obtained a CCD image of NGC 4848 with a resolution of 0.5′′ in the B band. This image is shown in Fig. 7 together with our CO map.
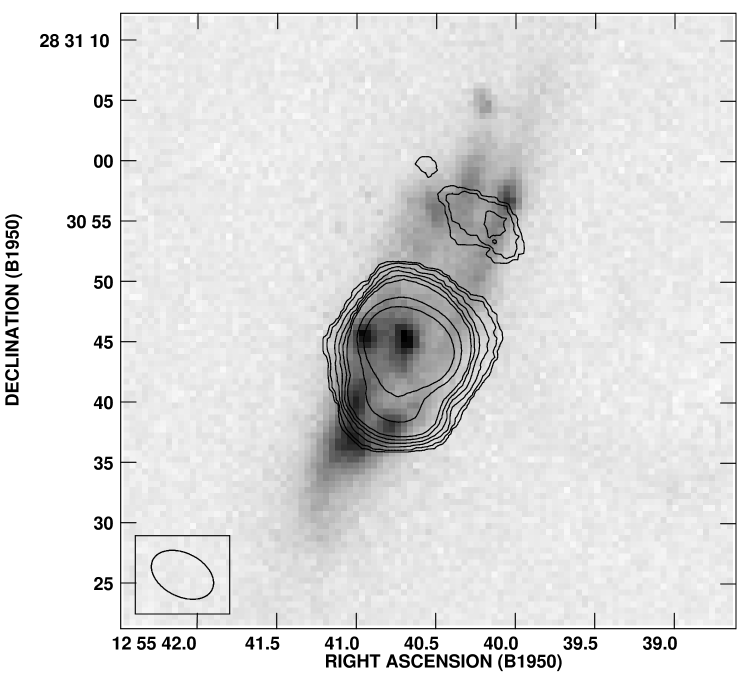
The B band image shows a blue galaxy center and a ring-like structure which is not centered on the galaxy center but shifted 7′′ to the north. There are four bright blue spots in the southern part of this ring and one bright blue spot in the north. The southern part of the ring is located at the outer edge of the southern elongation observed in CO. The bright blue spot in the north lies at the northern edge of the detached CO emission region. Moreover, there are two faint blue emission regions located at the periphery of the CO emission region and another one far away to the north.
5.3 Hi
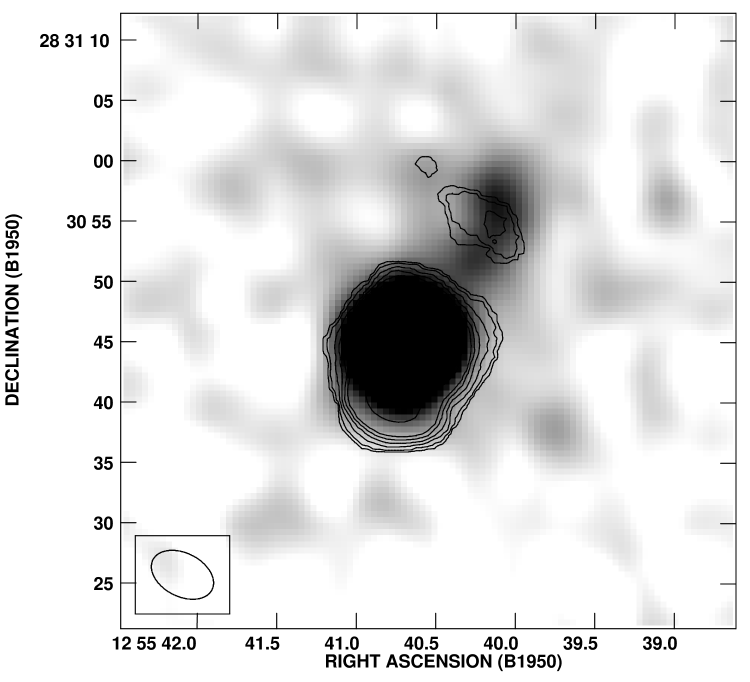
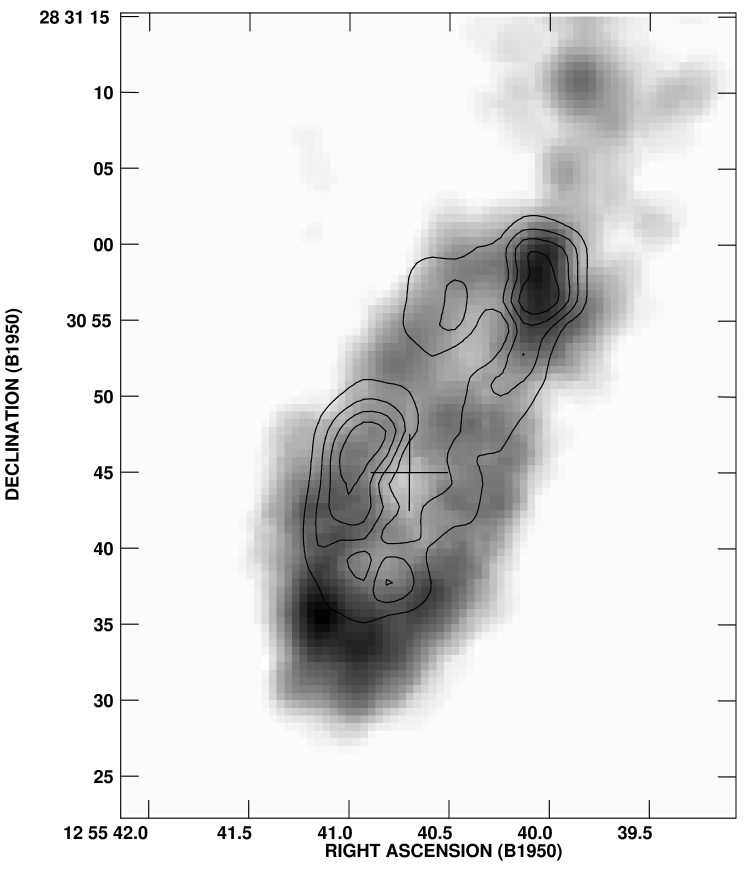
Bravo-Alfaro et al. (1999, 2000) observed several fields in the Coma cluster in the Hi 21 cm line with the VLA C array. We calibrated and treated the field containing NGC 4848 for a second time in order to obtain the maximum resolution. The continuum was removed using all velocity channels between 6800 km s-1 and 7800 km s-1. We obtained a final rms noise in one 20 km s-1 wide channel of 0.3 mJy per 19′′ beam. Fig. 8 shows the Hi distribution as greyscales and the CO emission as contours.
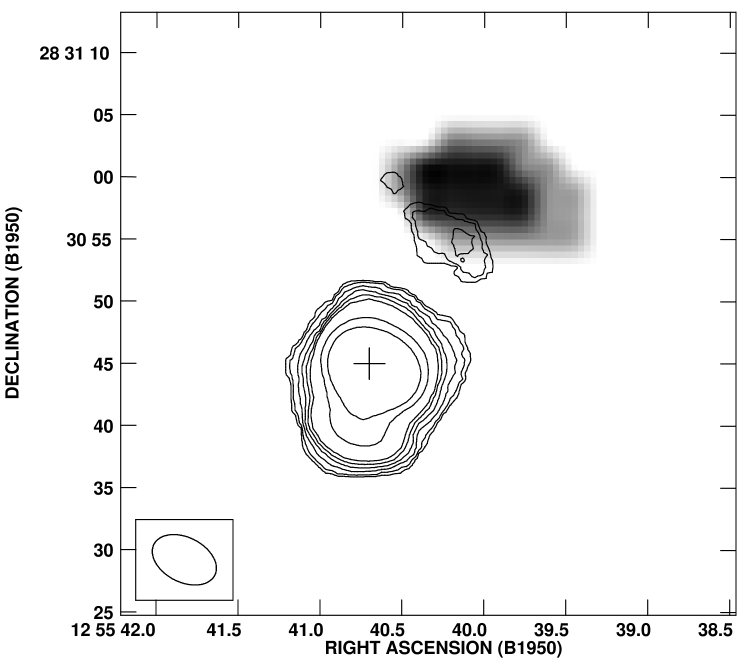
As already observed by Bravo-Alfaro et al. (2000) the Hi emission is located in the north. With an Hi beamsize of it is not spatially resolved. The Hi emission region is located at a larger distance from the galaxy center than the CO emission region. Since this emission region appears in 5 different velocity channels above the 2 level, we are confident that this detection is real. It represents the neutral gas with the highest column density. The lower resolution map obtained by Bravo-Alfaro et al. (2000) shows that the emission extends northwards. In Fig. 9 we compare the spectra of the Hi and CO emission regions integrated over the area where emission is detected.

Both spectra show emission in the same velocity range between 7000 and 7100 km s-1, the CO line being two times larger. This confirms that both detections are real. Furthermore, the integrated Hi spectrum of Giovanelli & Haynes (1985) has the same shape and width as our CO spectrum. Thus, the northern CO emission region and the Hi emission region are very probably associated. Given the small errors on the optical and Hi velocities (20 km s-1) compared to their difference ( km s-1, see Tab. 1), we think that the offset between the optical and Hi velocities is real.
The Hi flux in the C-array VLA map of this region is =0.05 Jy km s-1 (MHI=1.2 108 M⊙), whereas the single-dish Arecibo observations show that much more low surface density Hi is present (MHI=1.7 109 M⊙). The CO flux of the northern emission region is =3 Jy km s-1 (M=3.3 108 M⊙), which represents 7% of the total CO flux. More sensitive Hi observations are necessary to determine whether the gas is chiefly atomic or molecular in this region.
5.4 H
We compare here our CO data with the H Fabry-Pérot observations of Amram et al. (1992). Their map is shown as greyscales together with the CO data as contours in Fig. 10. We determined the coordinates of the galaxy center of the H image by fitting it to the B band image.
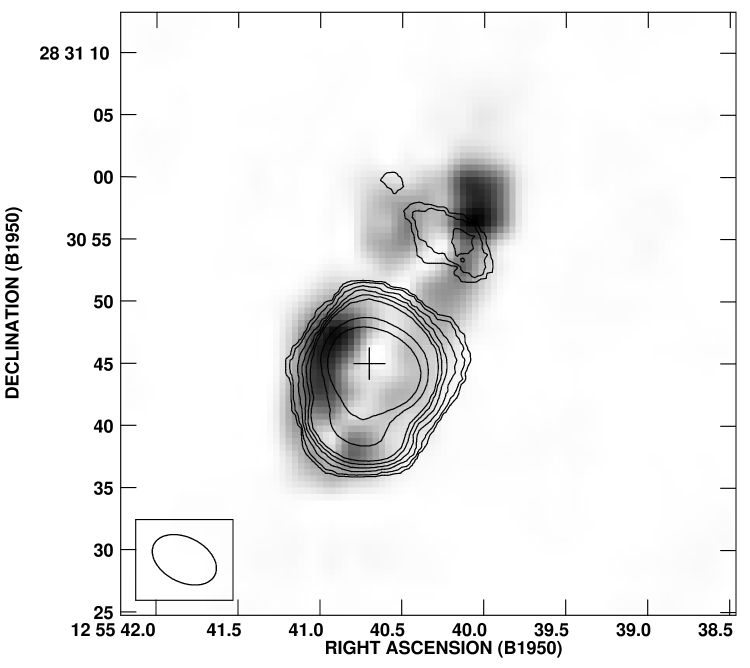
The H emission distribution shows a ring structure very similar to the one observed in the B band image. However, it contains only two bright spots in the south west and in the north where a lot of massive stars are formed. The other three bright spots in the south of the B band image do not have counterparts in H. The central hole is probably due to a too severe continuum subtraction in this region as a comparison with the H image of Gavazzi et al. (1998) indicates. The northern bright spot is located near the CO emission region. The uncertainty in the determination of the galaxy center coordinates in the H image does not allow us to conclude if both emission regions coincide exactly. We conclude here that both are located very close to each other within the same region. The northern H emission region contains 20% of the total H emission. In the south, the outer edge of the CO elongation nicely fits the H distribution.
5.5 H/H continuum
Gavazzi et al. (1998) obtained a narrow band H CCD image of NGC 4848 with a resolution of 1.2′′. We show in Fig. 11 the ratio between the H line emission and its continuum, in order to study the nature of the off–plane NIR emission regions (Fig. 6).
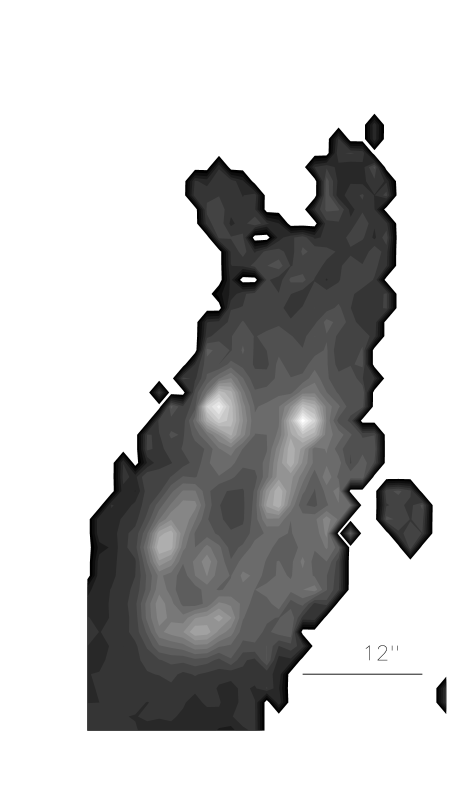
The image shows clearly the ring of highest H emission (see Fig. 10). Moreover, the western part of the galaxy next to the H ring has an enhanced H/continuum ratio. The NIR emission regions, which are running at an angle of across the galaxy’s disk (see Fig. 6), have a low H/continuum ratio, similar to that of the extended disk. The north western H emission maximum is not aligned with the NIR emission regions but kpc offset to the south. On the contrary, in the scenario of a tidally stretched dwarf whose ISM is interacting with the ISM of NGC 4848, one would expect (i) an alignment of all these regions and (ii) a higher H/continuum ratio in one of the two brightest NIR off–plane regions (see, e.g., Clemens et al. 2000).
5.6 20 cm
The Very Large Array (VLA) carries out a systematic survey of the northern sky at 20 cm wavelength in the B configuration (FIRST; Becker et al. 1994). These maps have 1.8′′ pixels, a typical rms of 0.15 mJy, and a resolution of 5′′. The 20 cm continuum map of NGC 4848 together with the CO emission map is shown in Fig. 12.
The 20 cm continuum map shows enhanced emission to the north west. It coincides exactly with the maximum of the CO emission in the northern emission region. The southern elongation of the CO emission does not have a counterpart in the 20 cm continuum map.
6 Discussion of the observations
Many of the physical properties of NGC 4848 are comparable to those of Virgo cluster Sab galaxies with the same blue luminosity and the same Hi deficiency (Kenney & Young 1989):
-
•
S(60 m)/S(100m)=0.52
-
•
ratio of molecular hydrogen mass to optical area: log()=0.37 Mpc-2
-
•
ratio of total gas mass to optical area: log()=0.51 Mpc-2
-
•
ratio of Hi to H2 flux: log()=1.8 ,
whereas its H line flux is a factor of at least two higher than that of a Virgo cluster spiral of the same morphological type, the same diameter, and the same Hi deficiency. In addition, its equivalent width is about 3 times higher than that of “normal” field Sab galaxies (Kennicutt 1983) and resembles that of an Sc spiral with a star formation rate of
| (2) |
(Kennicutt et al. 1994, Kennicutt 1998).
Calculating the CO deficiency
| (3) |
where is the observed and the expected molecular mass (see Boselli et al. 1997) gives negative values, i.e. it is not CO deficient.
NGC 4848 is a Hi deficient galaxy (Def; Gavazzi 1989; Giovanelli & Haynes 1985), i.e. it has lost about 2/3 of its atomic gas. The fact that the disk to bulge ratio in the H band appears to be small (Fig. 6) also indicates that NGC 4848 was likely an Sc galaxy before entering the cluster. Since there is no identified major optical companion neither a major asymmetry in the H band image, a major gravitational interaction can be excluded. The alignment of spherical emission regions in the NIR and all visible wavelengths might represent a tidally sheared dwarf galaxy which crosses the disk of NGC 4848. If this dwarf galaxy has been gas rich this could have an influence on the gas distribution of NGC 4848. But since the dwarf galaxy is very small compared to NGC 4848 (Fig. 6), it is highly improbable that it is responsible for the displacement of more than 109 M⊙ of atomic gas to the north of NGC 4848. Therefore, ram pressure stripping is the most probable cause for the atomic gas removal. We will discuss the scenario of a tidally stretched dwarf further in Sect. 8.2.
Numerical simulations (Vollmer et al. 2001) indicate that Hi deficient galaxies (Def) which are strongly affected by ram pressure stripping and which are located far away from the cluster center are observable most probably after their closest passage to the cluster center. Ram pressure is only high enough near the cluster center, where the ICM density and the galaxy’s velocity increase rapidly, to overcome the restoring gravitational forces. Thus, ram pressure only acts in the immediate vicinity of the cluster center. In addition, it needs only several 107 yr to accelerate the Hi clouds to their escape velocity (Murakami & Babul 1999), thus stripping happens very rapidly. Since a galaxy passes the cluster center with a very high velocity ( km s-1), the probability of observing it when stripping sets in is very low. It is therefore most likely that we observe an Hi deficient galaxy, which has a distorted Hi distribution, when it comes out of the cluster center. We will adopt this view in this work. Furthermore, Vollmer et al. (2001) showed that there is re-accretion of stripped material, which has not been accelerated to the escape velocity, between 2 and 5 108 yr after the closest passage. This infalling gas hits the galactic disk leading to frequent cloud–cloud collisions. The compression of the ISM due to these collisions might lead to an enhancement of the local star formation activity where the accreted gas falls on the disk.
NGC 4848 is located at 26′(0.75 Mpc) from the cluster center. Assuming a mean velocity of 1800 km s-1, the closest passage was about 4 108 yr ago. Therefore we assume that the galaxy is in the stage where material is falling back on its disk. The shocks produced by the encounters of infalling clouds with the ISM will compress the gas and star formation will take place. Given this picture, we can interpret the observational data shown above.
The Hi and CO maps show emission in the north of the galaxy. This means that the galaxy’s gas content of highest column density in the disk is located in the north of the galaxy center. We propose that the compression leads to a phase transition from atomic to molecular gas in the region where the infalling gas hits the disk, i.e. in the north.
The shift of the H emission ring to the north indicates an enhanced massive star formation in the north of the galaxy. However, the extended old disk component is symmetric (Gavazzi et al. 1990). The bulk of the neutral gas moves around the galaxy center with an almost constant rotation curve while the ionized gas content shows an important deviation: in the north western part of the disk the H emission has a double peaked profile (Fig. 13 extracted from the H data cube of Amram et al. 1992).

The peak at lower velocities (left) is due to the regular rotation of the gas within the galaxy following the rotation curve (Fig. 5). The stronger peak (right) at higher velocities is separated by +100 km s-1 from the first one, which corresponds to the disk rotation. The H line flux in this region represents of the total H line flux.
We interpret this feature as the consequence of infalling gas which collides with the ISM within the galaxy. The cloud–cloud collisions lead to the compression of the gas and the magnetic field. This gives rise to an enhanced star formation observed in the H map. The enhanced star formation activity together with the compressed magnetic field leads to the northern enhancement in the 20 cm continuum map. The enhanced number of young and hot O/B stars enhanced the ambient UV radiation field in the norther part of the galaxy, leading to an increase of the gas temperature. This effect, together with the increase of the molecular gas mass due to shock compression during the re-accretion, increases the 12CO(1–0) emissivity. The line emission thus becomes observable in the northern part of the outer disk.
In the next Section we present a detailed dynamical simulation of the infalling galaxy including ram pressure stripping in order to test the hypothesis made above.
7 Dynamics
7.1 The numerical model
Very few simulations have been done to quantify ram pressure stripping using Eulerian hydrodynamic (Takeda, Nulsen, & Fabian 1984, Gaetz, Salpeter & Shaviv 1987; Balsara, Livio, & O’Dea 1994) or SPH codes (Tosa 1994; Abadi, Moore, & Bower 1999). All methods have their advantages and their limits. Since we need to model an extreme density gradient between the ICM and the ISM in three dimensions, one would need a very high number of SPH particles or a very high resolution for Eulerian grid codes which makes calculations very memory, and time, consuming. The sticky particles code we use has the advantage that the effects of the ICM are directly implemented as an additional acceleration of the clouds which are exposed to ram pressure. The gas viscosity is due to direct (collisions) or indirect (gravitational) interactions between the clouds. We are the first to apply a time-dependent ram pressure profile, i.e. a Gaussian profile. The consequences of the decrease of ram pressure after the galaxy’s closest passage to the cluster center is that material which has not been accelerated to the escape velocity falls back to the galaxy. This has not been observed in simulations before, because of the use of a constant, time-independent ram pressure.
We used the three-dimensional N-body code described in detail in Vollmer et al. (2001). The particles represent gas cloud complexes which are evolving in an analytically given gravitational potential of the galaxy. This potential consists of two spherical parts: the dark matter halo and the stellar bulge, and a disk potential (Allen & Santillán 1990). The model parameters are: (i) halo: =12 kpc, M⊙, (ii) bulge: =400 pc, M⊙, (iii) disk: =5 kpc (disk scale length), =250 pc (height from the disk plane), M⊙. The outcoming velocity field has a constant rotation curve of 250 km s-1 (Fig. 14).

The optical diameter of NGC 4848 kpc corresponds to 9 disk scale lengths. 10 000 particles of different masses are rotating within this gravitational potential. The cloud mass distribution is (Knude 1981) within a range of to M⊙.
A radius which depends on the mass is attributed to each particle. During the disk evolution they can have inelastic collisions. The outcome of these collisions is simplified following Wiegel (1994):
-
•
for :
fragmentation -
•
for and :
mass exchange -
•
for and :
coalescence,
where is the impact parameter, and the cloud radii, the final velocity difference, and is the escape velocity. This results in an effective disk viscosity. The next neighbor search and selfgravitation between the clouds is done with a three-dimensional treecode (Barnes & Hut 1986).
As the galaxy moves through the ICM its clouds are accelerated by ram pressure. Within the galaxy’s inertial system its clouds are exposed to a wind coming from the opposite direction of the galaxy’s motion through the ICM. The effect of ram pressure on the clouds is simulated by an additional force on the clouds in the wind direction. Only clouds which are not protected by other clouds against the wind are affected.
When the galaxy approaches the cluster center, its velocity increases. At the same time the surrounding ICM density increases. This leads to an increase of the ram pressure on the ISM clouds , where is the ICM density and is the velocity of the galaxy. We take this evolution of into account in adopting the following profile , where cm-3 and =1000 km s-1, where yr is the time of the galaxy’s closest approach to the cluster center.
With the scenario in mind we have taken a snapshot of the evolved galaxy 400 Myr after the closest passage to the cluster center. Vollmer et al. (2001) have shown that the resulting Hi deficiency increases with increasing inclination angle between the galaxy’s disk and its orbital plane, whereas the fraction of re-accreted material increases with decreasing . In our case, a considerable fraction of stripped gas clouds are accelerated by ram pressure to velocities below the escape velocity. In addition, for small the re-accreted material hits the disk mainly at one single point. For increasing the area where re-accretion takes place increases and the gas falls from the direction onto the disk. For the comparison with observations we have therefore chosen =20o and a ram pressure maximum of 28. This satisfies all necessary conditions: a high stripping efficiency, a relatively high re-accreted mass fraction and a small area where the re-accreted cloud complexes hit the disk ISM. The final Hi deficiency of this simulation is DefHI=0.7.
Fig. 15 shows the evolution of the model galaxy in timesteps of Myr. The ram pressure maximum occurs at =0 yr.
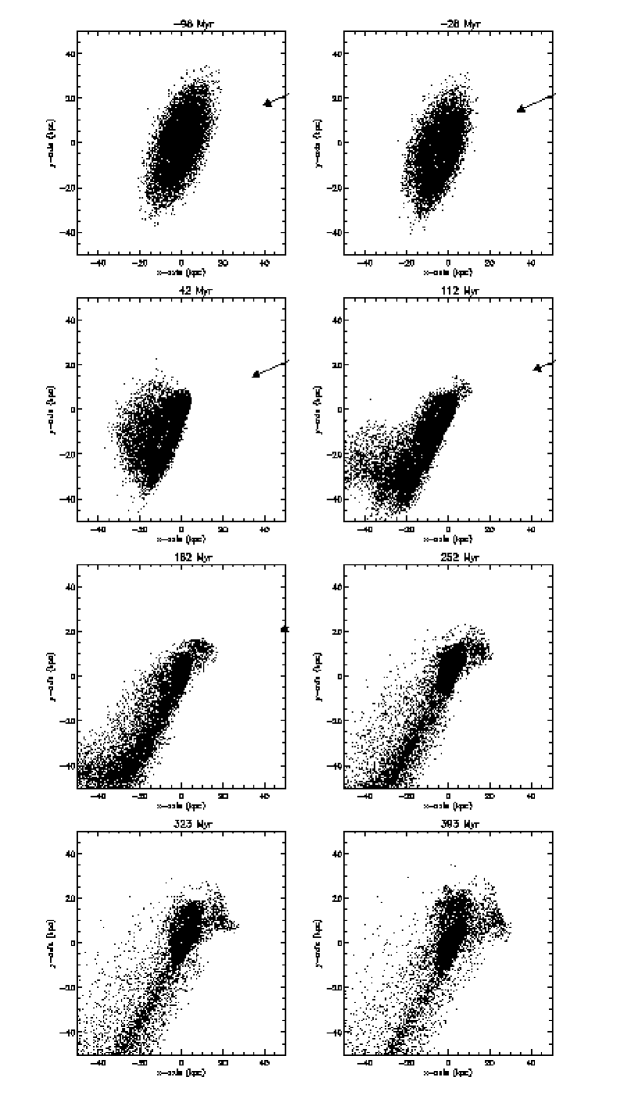
Were NGC 4848 falling into the cluster core, it would be even less disturbed than in the first panel of Fig. 15, which is for 98 Myr before reaching the core. This is consistent with the conclusion of Vollmer et al. (2001) that highly distorted, Hi deficient galaxies which are most likely located far away from the cluster center (and in particular NGC 4848) are coming out of the Coma cluster core.
At Myr before the galaxy’s closest passage to the cluster center a density enhancement grows in the direction of the galaxy’s motion. The gas of the outer Hi disk is driven away from the galaxy. Since it still has the angular momentum of rotation, it forms a ring-like structure. At the closest passage to the cluster center an accelerated arm in the north-east and a decelerated arm in the south are formed. Both arms rotate counter-clockwise. The rotation of the southern arm is stopped by the fading ram pressure. At Myr after the galaxy’s closest passage to the cluster center the stripped gas which has been accelerated to velocities remaining below the escape velocity begins to fall back onto the galaxy following both arms. The infalling gas flows cross in the north-west of the galaxy where they form an expanding gas shell.
The model snapshot at Myr after the closest passage of the cluster center is shown in Fig. 16. The direction of the galaxy’s motion indicated in Fig. 15.
The hole in the center of the galaxy is artificial, because the clouds in the very center are arbitrarily removed from the model. Since the timestep is roughly inversely proportional to the acceleration , , where is the galactic distance and we assume =const, this procedure insures a large enough timestep ( yr). The galaxy’s main Hi disk is truncated at a diameter of kpc. Assuming an optical diameter of 40 kpc for the model galaxy, this gives a ratio between the Hi and the optical diameter of , which fits in the corresponding plot of Cayatte et al. (1994). If we assume the same stripping mechanism acting in the Coma cluster as for the Virgo cluster, we expect a ratio between the Hi and the optical diameter to be . With the optical diameter of NGC 4848 this leads to a predicted Hi diameter of kpc (40′′), which is only slightly larger than the model Hi diameter. The detected Hi emission region is located at a distance from the galaxy center of , thus well within this predicted diameter.
A shell of high surface density Hi gas is located in the north (Fig. 16, left panel). It spans an angle of . This shell is located mainly above the disk plane (Fig. 16, right panel). It consists of gas which has been removed from the disk by ram pressure in the wind direction (20o off plane). This material is now falling back into the galaxy. In addition, a tenuous gas component can be found north and south of the galaxy.
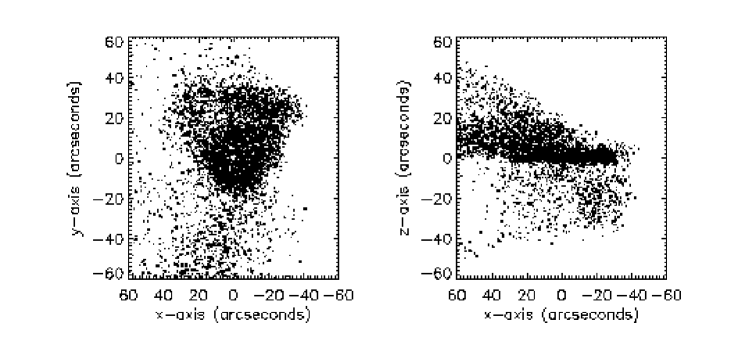
The projection of the cloud velocities on the --plane and --plane are shown in Fig. 17.

The galaxy rotates counter-clockwise. The tenuous gas component at large distances from the galaxy falls back to the galaxy. The northern shell consists of two counter-rotating streamers. The major streamer comes from the west in the sense of the galactic rotation, the minor one arrives from the east in a counter-rotating sense. They correspond to the two re-accretion arms which form after the stripping event when ram pressure has already ceased. The first arm rotates in the sense of the galaxy rotation and meets the disk in the south, the second arm is counter-rotating and meets the galactic disk in the north. The northern shell is thus expanding to the north.
7.2 Comparison with observations
We have generated the observer’s view of this gas distribution with PA=158o and =75o. For the comparison of the model column density distribution with the Hi data we assume that the gas within a distance of 7 kpc (15′′) from the galaxy center is mainly molecular whereas the gas at larger distances is mainly atomic. We can thus compare directly both distributions (Fig. 18).
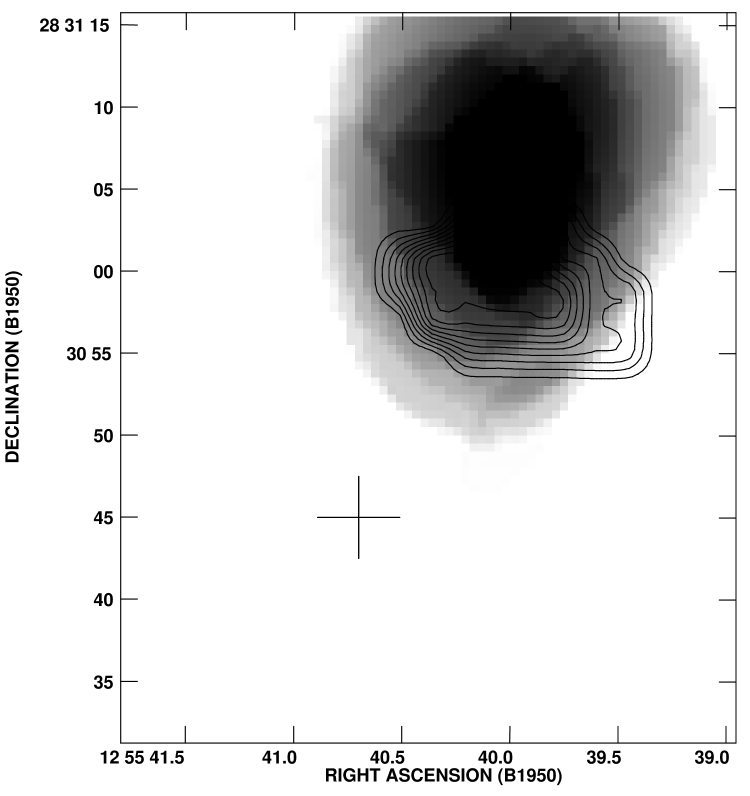
The low resolution Hi distribution of Bravo-Alfaro et al. (2000) suggests that the bulk of the atomic gas is located more to the north than the emission region shown in Fig. 8. The model Hi emission region is located in the right direction and at approximately the right distance from the galaxy center. Thus, we suggest that the observed Hi emission regions corresponds to the inner part of the expanding northern shell of our simulation.
In order to compare the H image with the model, we again assume that star formation takes place where the re-accreting material hits the disk, i.e. where we have a double line profile. Each cloud complex in the model snapshot was checked for a velocity which leads to a collision with a neighboring cloud complex. We thus project the velocity vectors (, ) of each pair of clouds on their relative distance vector : We apply a weighting factor to each cloud which is equal to the number of possible collisions fulfilling the criterion: kpc, has the opposite sign of . All cloud complexes which will not collide are removed from the cube. At distances kpc, i.e. within the ring observed in H, the mean free path of a cloud is smaller than outside the disk. The criterion kpc might thus not be valid at small distances. Moreover, in the inner disk, star formation is more likely due to density waves within the stellar and gaseous disk. Since this aspect is not included in the model we prefer to give the clouds at kpc a uniform weight (Vollmer et al. 2000). The model emission inside the galaxy disk is thus density weighted, the emission outside the disk is collision weighted.
The result of this procedure together with the H emission distribution can be seen in Fig. 19.
The extent of the model and observed H emission fits remarkably well. The two brightest spots in the model are located in the north-west and in the south of the galaxy center. Especially the north-western maximum coincides exactly with the observed maximum of the H emission.
In order to check if we can reproduce the double line profile in the north-eastern emission region as it has been observed by Amram et al. (1992), we made spectra of the model cube in this region (Fig. 20), which can be directly compared with the H spectra of Fig. 13.

As in the observed spectra, we find a double line profile in the model cube. The main difference between the model and observations lies in the different intensities of the lines. The observed line of highest intensity is not due to regular rotation, whereas the model shows the contrary. This difference is not significant, however, because we have not included an explicit recipe for star formation or radiative transfer in our model, making it impossible to predict the outgoing ionizing UV field in the star forming region.
7.3 Towards a coherent scenario
Our model includes only 10 000 particles but the calculation is very long for each run due to the small time steps, limiting the exploration of parameter space. Our aim is to show generic features which arise naturally from our simulations. These effects are more or less pronounced for different and . The values chosen represent a compromise as described in Sect. 7.1. Nevertheless, there are typical features which appear only in a given range of and , as the amount of re-accretion and the resulting Hi deficiency.
We are able to reproduce
-
•
the observed Hi distribution, i.e. that most of the Hi is found in the north of the galaxy,
-
•
the north-western maximum of the observed H emission distribution,
-
•
the observed double H line profile in the north-west of the galaxy,
-
•
the enhanced 20 cm radio continuum emission region to the north of the galaxy center.
In our model the re-accreting gas hits the disk at the position of the observed CO emission region. We expect that the molecular gas has condensed from the colliding atomic gas, inducing the observed star formation. The observed radio continuum peak near the CO/Hi emission region arises naturally from an ISM-ISM collision in which the magnetic fields are compressed at the same time as the clouds.
8 Alternative scenarios
The scenario presented here, with the observational asymmetries of the gas distributions and perturbations of the velocity fields, is not unique. The distance to the Coma cluster is such that the resolution of the presented observations is lower than that of the model. Therefore, we will discuss two alternative scenarios.
8.1 Ram pressure stripping in action
If ram pressure is stripping the gas now, we could imagine a scenario where NGC 4848 approaches the cluster center. The neutral hydrogen and maybe a part of the molecular gas (Kritsuk 1983) are displaced to the north west of the galaxy by the ram pressure of the ICM. In this way NGC 4848 would resemble NGC 4419 in the Virgo cluster (Kenney et al. 1990), which also shows an asymmetric distribution of the molecular gas. Nevertheless, there are important differences. NGC 4419 is red (Kenney et al. 1990), whereas NGC 4848 is a blue disk galaxy (RC3). Moreover, the asymmetry of the CO distribution is much more pronounced for NGC 4419 (a factor of 2 in CO luminosity) than for NGC 4848 (a factor of 0.1). Thus, they might not be directly comparable.
For the scenario of active stripping, two main questions remain: (i) The galaxy has lost about 2/3 of its atomic gas. Thus ram pressure stripping has already been very efficient at larger distances from the cluster center ( Mpc) in order to have removed more than M⊙. This gas must have been ionized, because we do not detect it in the 21 cm line. At these distances the ICM density is very low ( cm-3). If we assume an Hi column density of cm-2, a rotation velocity km s-1, and a galactic radius of =10 kpc, we obtain from the energy density equation for face–on stripping (Gunn & Gott 1972)
| (4) |
where is the proton mass, and we have a galaxy velocity of km s-1. The Keplerian velocity for circular orbits at 1 Mpc from the cluster center, assuming an enclosed total mass of M⊙ (Hughes 1989), is km s-1. If the galaxy was stripped face–on, the scenario of active ram pressure stripping would be consistent with the Hi 21 cm line observations.
NGC 4848 has a low radial velocity with respect to the cluster mean ( km s-1). Thus, the galaxy’s velocity vector must have a large component in the direction of the cluster center. Since it is highly inclined, it is most probable that NGC 4848 is stripped nearly edge–on. In this case, Eq. 4 does not apply, i.e. ram pressure must be much higher to strip the outer atomic hydrogen. According to our model simulations (Fig. 15), a displacement of the gas is only clearly detectable after the galaxy’s passage through the cluster center. Even if we underestimate the ram pressure efficiency, it is unlikely that a displacement already takes place at Myr before the galaxy’s closest approach to the cluster center.
8.2 Tidal interaction with a dwarf galaxy
Fig. 6 shows an alignment of four nearly spherical emission regions at an angle of with respect to the galaxy’s position angle. This could be a tidally stretched dwarf galaxy crossing the disk, in the same way the Sagittarius dwarf crosses the Galaxy (see Edelsohn & Elmegreen 1997 for numerical simulations). In this case, one would expect a major emission region which corresponds to the core of the dwarf galaxy. The two strongest emission regions at the extremities of the alignment have approximately the same brightness in the H band, weakening the interpretation of the alignment as a tidally stretched dwarf galaxy.
Even if the galaxy was gas rich, this can not explain the displacement of M⊙ of atomic hydrogen. Moreover, in an ISM–ISM interaction one would expect strong Hi tails following the stellar tails (see, e.g., Weliachew et al. 1978). An ISM–ISM collision could explain the detached northern CO emission region together with the enhanced radio emission, but it cannot account for the higher H line to continuum ratio in the west of the H ring, either for the large spatial extent of the region where H double line profiles were observed, or for the offset between the alignment and the western H maximum.
As ram-pressure stripping is necessary in the two possible scenarios and naturally accounts for the observations according to our simulations, it is currently the preferable explanation. Further observations (e.g., with the HST) may allow us to determine whether a small galaxy is also being tidally torn apart.
9 Conclusions
We have shown 12CO(1–0) Plateau de Bure observations of the highly Hi deficient Coma galaxy NGC 4848. A detached CO emission region in the north of the galaxy center was detected. This region is located near an H emission maximum where an H double line profile was observed earlier. Furthermore, an enhancement in the 20 cm radio continuum coincides with the detached northern CO emission region.
We are able to reproduce naturally the main characteristics of the emission distributions and velocity fields of the multiple wavelength observations with the help of a numerical simulation including ram pressure stripping. In this scenario, the galaxy passed near the cluster center 400 Myr ago. NGC 4848 is emerging from the cluster center with a radial velocity of -400 km s-1 and is located in front of the cluster center. We propose that it was an Sc galaxy which entered the cluster for the first time 1 Gyr ago. During its recent passage through the cluster core most of its atomic gas was removed by ram pressure stripping. Its molecular gas has not been stripped because it is located deep in the gravitational potential well of the galaxy and because of its very high column density. The atomic gas which was not accelerated to a velocity above the escape velocity now falls back onto the galaxy. The compression of the neutral gas due to accretion leads to a phase transition from atomic to molecular gas and to star formation activity. We expect the star formation rate to decrease within the next Gyr due to the lack of a gas reservoir in the outer disk.
An alternative scenario, where ram pressure stripping is active and a tidally stretched dwarf galaxy crosses the disk at the same time, is also consistent with the available data but less probable on the basis of our numerical simulations.
Acknowledgements.
We would like to thank the IRAM staff for their kind support during the data reduction phase in Grenoble and P. Amram and M. Marcelin for making the H data cube available to us. BV was supported by a TMR Programme of the European Community (Marie Curie Research Training Grant). We would also like to thank J. Kenney for helping us to improve this article significantly.References
- (1) Abadi M.G., Moore B., & Bower R.G. 1999, MNRAS, 308, 947
- (2) Allen C., Santillán A., 1991, RMAA, 22, 255
- (3) Amram P., Le Coarer E., Marcelin M., Balkowski C., Sullivan W.T.III, Cayatte V., 1992, A&AS, 94, 175
- (4) Balsara D., Livio M., & O’Dea C.P. 1994, ApJ, 437, 83
- (5) Barnes J.E., Hut P., 1986, Nature, 324, 446
- (6) Becker, R. H., White, R. L., & Helfand, D. J. 1994, Astronomical Data Analysis Software and Systems III, ASP Conference Series, v. 61, eds. D. R. Crabtree, R. J. Hanisch, & J. Barnes, p. 165
- (7) Bicay M.D., Giovanelli R., 1987, ApJ, 321, 645
- (8) Biviano A., Durret F., Gerbal D., Le Fèvre O., Lobo C., Mazure A., Slezak E., 1996, A&A, 57, 423
- (9) Boselli A., Gavazzi G., Lequeux J. et al., 1997, A&A, 327, 522
- (10) Bothun G., Dressler A., 1986, ApJ, 301, 57
- (11) Bravo-Alfaro H., 1997, thesis, University of Paris 7
- (12) Bravo-Alfaro H., Cayatte V., van Gorkom J.H., Balkowski C., 2000, AJ, 119, 580
- (13) Briel U.G., Henry J.P., Böhringer H., 1992, A&A, 259, L31
- (14) Casoli F., Boissé P., Combes F., Dupraz C., 1991, A&A, 249, 359
- (15) Cayatte V., Kotanyi C., Balkowski C., van Gorkom J.H., 1994, AJ, 107, 1003
- (16) Clemens M.S., Alexander P., & Green D.A., 2000, MNRAS, 312, 236
- (17) Colless M., Dunn A.M., 1996, ApJ, 458, 435
- (18) Combes F., Dupraz C., Casoli F., Pagani L., 1988, A&A, 203, L9
- (19) de Vaucouleurs G., de Vaucouleurs A., Corwin H.G., Buta R.J., Paturel G., Fouqué P., 1991, Third Reference Catalogue of Bright Galaxies,(New York:Springer) (RC3)
- (20) Dressler A., 1980, ApJSS, 42, 565
- (21) Donas J., Milliard B., Laget M., 1995, A&A, 303, 661
- (22) Edelsohn D.J., & Elmegreen B.G., 1997, MNRAS, 290, 7
- (23) Gaetz T.J., Salpeter E.E., & Shaviv G. 1987, ApJ, 316, 530
- (24) Gavazzi G., 1987, ApJ, 320, 96
- (25) Gavazzi G., 1989, ApJ, 346, 59
- (26) Gavazzi G., Boselli A., 1996, ApL&C, 35, 1
- (27) Gavazzi G., Pierini D., Boselli A., & Tuffs R. 1996, A&AS, 120 ,489
- (28) Gavazzi G., Catinella B., Carrasco L., Boselli A., Contursi A., 1998, AJ, 115, 1745
- (29) Gavazzi G., Garilli B., Boselli A., 1990, A&AS, 83, 399
- (30) Giovanelli R., Haynes M.P., 1985, ApJ, 292, 404
- (31) Guilloteau et al. 1992, A&A, 262, 624
- (32) Gunn J.E., Gott J.R., 1972, ApJ, 176, 1
- (33) Hughes J.P., 1989, ApJ, 337, 21
- (34) Jones C., Forman W., 1984, ApJ, 246, 38
- (35) Kenney J.D., Young J.S., 1986, ApJL, 301, L13
- (36) Kenney J.D., Young J.S., Hasegawa T., & Nakai N. 1990, ApJ, 353, 460
- (37) Kennicutt R.C., 1983, AJ, 88, 483
- (38) Kennicutt R.C., Tamblyn P., Congdon C.W., 1994, ApJ, 435, 22
- (39) Kennicutt R.C. 1998, ARAA, 36, 189
- (40) Kritsuk A.G. 1983, Astrofisika, 19, 263
- (41) Lucas R., 1992, Continuum and Line Interferometer Calibration (CLIC; IRAM: Grenoble)
- (42) Moshir M., Kopan G., Conrow T., McCallon H., et al., 1990, Infrared astronomical satellite catalogs, the faint source catalogue, version 2.0
- (43) Murakami I., & Babul A. 1999, MNRAS, 309, 161
- (44) Poggianti B.M., Smail I., Dressler A., Couch W.J., Barger A.J., Butcher H., Ellis R.S., Oemler A.Jr., 1999, ApJ, 518, 576
- (45) Solanes, J.M., Manrique, A., García-Gómez, C., González-Casado, G., Giovanelli, R., & Haynes, M., 2000, ApJ, in press
- (46) Takeda H., Nulsen P.E.J., & Fabian A.C. 1984, MNRAS, 208, 261
- (47) Tosa M. 1994, ApJ, 426, L81
- (48) Tully R.B., Shaya E.J., 1984, ApJ, 281, 31
- (49) Vollmer B., Marcelin M., Amram P., Balkowski C., Cayatte V., Garrido O., 2000, A&A, 364, 532
- (50) Vollmer B., Cayatte V., Balkowski C., Duschl W.J., 2001, ApJ, submitted
- (51) Vikhlinin A., Forman W., Jones C., 1997, ApJ, 474, L7
- (52) Weliachew L., Sancisi R., & Guelin M. 1978, A&A, 65, 37
- (53) White S.D., Briel U.G., Henry J.P., 1993, MNRAS, 261, L8
- (54) Wiegel W., 1994, Diploma thesis, University of Heidelberg