The evolution of and the epoch of formation of damped Lyman- absorbers.
Abstract
We present a study of the evolution of the column density distribution, , and total neutral hydrogen mass in high-column density quasar absorbers using candidates from a recent high-redshift survey for damped Lyman- (DLA) and Lyman limit system (LLS) absorbers. The observed number of LLS (N(HI) atom cm-2) is used to constrain below the classical DLA Wolfe et al. (1986) definition of atom cm-2. The evolution of the number density of LLS is consistent with our previous work but steeper than previously published work of other authors. At z=5, the number density of Lyman-limit systems per unit redshift is 5, implying that these systems are a major source of UV opacity in the high redshift Universe. The joint LLS-DLA analysis shows unambiguously that deviates significantly from a single power law and that a -law distribution of the form exp provides a better description of the observations. These results are used to determine the amount of neutral gas contained in DLAs and in systems with lower column density. Whilst in the redshift range 2 to 3.5, 90% of the neutral HI mass is in DLAs, we find that at z3.5 this fraction drops to only 55 and that the remaining ’missing’ mass fraction of the neutral gas lies in sub-DLAs with N(HI) . The characteristic column density, , changes from at z3.5 to at z3.5, supporting a picture where at z3.5, we are directly observing the formation of high column density neutral hydrogen DLA systems from lower column density units. Moreover since current metallicity studies of DLA systems focus on the higher column density systems they may be giving a biased or incomplete view of global galactic chemical evolution at z3. After correcting the observed mass in HI for the “missing” neutral gas the comoving mass density now shows no evidence for a decrease above z=2.
keywords:
cosmology: observations – galaxies: evolution – galaxies: formation – quasars: absorption lines – intergalactic medium1 Introduction
One of the fundamental phenomena still poorly understood in cosmology is the detailed process relating to the origin of structure formation after the epoch of recombination. The basic dilemma is, that while the directly observable baryonic content of galaxies at the present epoch is concentrated in stars, in the past, logically, this must have been in the form of gas. Therefore the only way to obtain a self consistent and complete picture of the galaxy formation process is to combine studies of the star light and the star formation rate with studies of the gas content of the Universe to learn about the underlying metal production and gas consumption rates.
Quasar absorbers provide a powerful observational means to study the early stages of galaxy formation independently of their intrinsic luminosity. The hydrogen absorbers are normally divided into three classes according to their column density: damped Lyman- (DLA) systems with N(HI) atom cm-2; Lyman-limit Systems (LLS) with N(HI) atom cm-2; and the Lyman- Forest with N(HI) ranging from to atom cm-2. The damped Lyman- absorption lines (DLAs) are of particular importance since they contain the bulk of the neutral gas in the Universe at high redshift and are the major directly observable baryonic component at these redshifts.
For historical reasons based on the observed HI column density distribution in local galactic discs, Wolfe et al. (1986) introduced a defining limit for DLAs of N(HI) atom cm-2. This definition arises from the fact that 21 cm observations of local spirals show the column density drops sharply beyond this threshold (Bosma 1981). These systems exhibit strong damping wings, however, technically any absorption system with a doppler parameter 100 km/s and N(HI) cm-2 will exhibit damping wings. As we will show, this ’low redshift’ DLA definition needs to be extended at high redshift to include systems down to .

DLAs were originally thought to be the precursors of present day disk galaxies (Wolfe et al. 1986), a scenario which is supported by some current models (Prochaska Wolfe 1998). However, Haehnelt, Steinmetz & Rauch (1998) and Ledoux et al. (1998) have shown that the rotating disk interpretation for DLA systems is not unique and that the velocity structure observed by Wolfe and co-workers can also be explained by infalling sub-galactic clumps in collapsing dark matter halos with virial velocities of 100 .
LLS are a lower column density superset of DLAs, which at are probably associated with galactic halos (Steidel, Dickinson & Persson 1994). At high redshift LLS, irrespective of their physical nature, are an important contributor to the UV opacity of the Universe since they essentially block all radiation shortward of 912 Å in the rest frame.
In this paper we present an analysis based on a new sample of high column density absorbers (DLA candidates and LLS) from a recently completed high-redshift survey (Péroux et al. 2001) combined with data from the literature (Storrie-Lombardi et al. 1996c; Storrie-Lombardi Wolfe 2000 and refs therein). The combined high redshift dataset is based on observations of 100 quasars with z4 and includes complete samples of 29 DLA candidates and 37 LLS with z3.5. The layout of this paper is as follows: §2 shows how the LLS can be used to constrain the cumulative number of absorbers above log atom cm-2 and examines the redshift evolution of the column density distribution. The cosmological neutral gas evolution is presented in §3 and implications of our results on theories of structure formation are detailed in §4. Unless otherwise stated, this paper assumes , and km s-1 Mpc-1.
2 Column Density Distribution

| z | N | N | dX | ||||
|---|---|---|---|---|---|---|---|
| Range | QSO | DLA | |||||
| 0.0-2.0 | 0.74 | 8.70 | 20.76 | 537 | 23 | 362.8 | 0.64 |
| 2.0-2.7 | 1.08 | 3.25 | 21.27 | 380 | 34 | 522.3 | 1.04 |
| 2.7-3.5 | 1.10 | 4.06 | 21.18 | 251 | 28 | 414.9 | 0.98 |
| 2.4-3.5 | 1.08 | 4.29 | 21.21 | 314 | 46 | 608.2 | 1.13 |
| 3.5 | 0.80 | 25.1 | 20.46 | 112 | 29 | 290.2 | 0.71 |
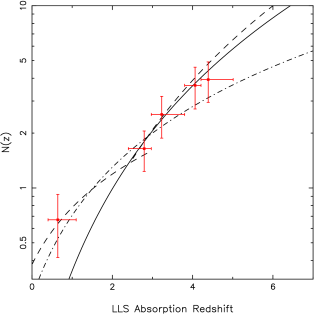
Our new sample of high redshift Lyman-limits systems (Péroux et al. 2001) is combined with data collected from previous surveys (Storrie-Lombardi et al. 1994) in order to determine the number of LLS per unit redshift (Figure 1). We have chosen to use LLS with in our analysis because of the very small number of systems known at low redshift (), all of which are below . Moreover, the paper is mainly concerned with the evolution of the high column density absorber population at z2.
In the case of the colour selected quasars observed by Storrie-Lombardi et al. (1996c), Péroux et al. (2001) objects with are excluded to minimise colour selection bias. Only LLS with optical depth are used resulting in 67 systems in 124 quasars without broad absorption features, not within km s-1 of the quasar emission redshift. The latter systems are excluded as they might be associated with the quasar itself (Storrie-Lombardi et al. 1994). Details on the LLS selection process and redshift estimates can be found in Péroux et al. (2001). Our new sample adds 26 LLS systems at z3.5 to the 11 systems used by Storrie-Lombardi et al. (1994). The analysis follows that of Storrie-Lombardi et al. (1994) and the LLS number density is fitted using a power law of the form . The parameter values for our fit, and , are determined using a maximum likelihood analysis. Interestingly the number density distribution in the Lyman- forest shows a break at below which the distribution is flat (, Weymann et al. 1998) and above which the distribution is steep (, Kim, Cristiani & D’Odorico 2001), comparable to the LLS results. Our new determination agrees very well with the previous results of Storrie-Lombardi et al. (1994) but there is a significant difference at high redshift when compared with the extrapolated results of Stengler-Larrea et al. (1995). This is not surprising since their analysis contained no data above z=3.5
We now analyse the combined samples of Lyman-limit systems and confirmed/candidate damped Lyman- systems. The cumulative number of absorbers per unit distance interval for two redshift ranges is presented in Figure 2. The absorption distance interval, , (Bahcall & Peebles, 1969; Tytler, 1987) is used to correct to co-moving coordinates and thus depends on the geometry of the Universe since
| (1) |
This equation differs from equation (3) in Storrie-Lombardi et al. (1996a) in that we have included the terms for a non-zero Lambda Universe. The data with N(HI) atom cm-2 are DLA candidates taken from our recent high-redshift survey (our observations more than double the redshift path surveyed at – see Péroux et al. 2001) and DLAs published by Storrie-Lombardi & Wolfe 2000. The data used for the analysis are tabulated in Appendix A & B.
The power law fit to the observed number of LLS per unit redshift is used to calculate the expected number of LLS systems:
| (2) |
where and define the redshift path along which quasar absorbers were searched for. The LLS line profiles cannot be used to directly measure their column densities because in the range to atom cm-2 the curve of growth is degenerate. Nevertheless, the expected number of LLS provides a further constraint on the cumulative number of quasar absorbers and clear evidence that a simple power law is not a good representation of the observations. We thus choose to fit the data with a -distribution (cf. Schechter (1976) function used in studies of the galaxy luminosity function) as introduced by Pei Fall (1995) and Storrie-Lombardi, Irwin & McMahon (1996b):
| (3) |
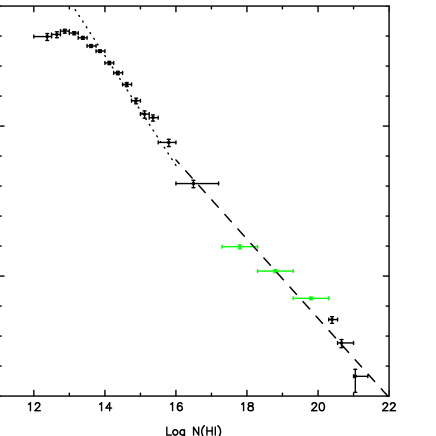
where is the column density, a characteristic column density and a normalising constant. A maximum likelihood analysis is used to derive the parameters in various redshift ranges (see Table 1). The , and - confidence contours are shown in Figure 3 for and . The distributions are clearly different at the 3 level and indicate that there are less high column density systems (N(HI) atom cm-2) at high-redshift, z3.5, compared with 2z3.5 confirming the results from Storrie-Lombardi, McMahon & Irwin (1996a) and Storrie-Lombardi & Wolfe (2000). For comparison with previous works, Figure 4 shows the column density distribution, , at together with the double power law of Petitjean et al. (1993).
3 Cosmological Mass Density Evolution
The mass density of absorbers can be expressed in units of the current critical mass density, , as:
| (4) |
where is the mean molecular weight and is the hydrogen mass. The total HI may be estimated as:
| (5) |
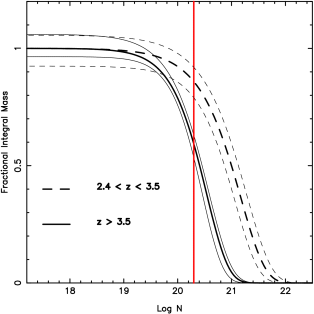
If a power law is used to fit , up to of the neutral gas is in DLAs (Lanzetta, Wolfe & Turnshek 1995), although an artificial cut-off needs to be introduced at the high column density end because of the divergence of the integral. If instead a -distribution is fitted to this removes the need to artificially truncate the high end column distribution and can be used to probe in more detail the neutral gas fraction as a function of column density and how this changes with redshift. Figure 5 shows the cumulative mass fraction as a function of column density for and . At , up to of the neutral gas is in systems with . We refer to these systems as sub-DLAs. These observations supports a picture where at z3.5, we are directly observing the formation of high column density neutral hydrogen DLA systems from lower column density units. The value of decreases by a factor of 5 from at z3.5 to at z3.5.
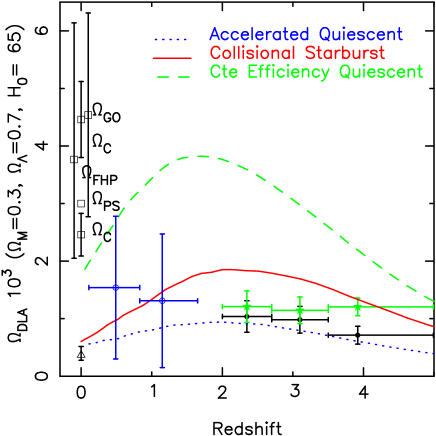
Figure 6 displays contained in DLAs (filled circles) and the total amount of neutral gas (DLAs plus sub-DLAs) for a non-zero Universe (grey stars). Our observations are consistent with no evolution in the redshift range z= 2 to 5. Empty Universe models produce similar results.
4 Discussion and conclusions
Our study is mainly based on optically selected quasars, so it is obvious that quasars that lie behind dusty DLA systems will be underrepresented if they exist. Pei & Fall (1995) have used self-consistent closed-box/inflow-outflow galactic chemical evolution models to show that the fraction of missing DLAs at ranges from 23% to 38%. However, dust is unlikely to be important at high-redshift because of the short time available for its production. Dust will have a larger effect at z=2 compared with z3 and thus it could not cause the form of evolution in f(N,z) that we observe. But a recent work by Ellison et al. (2001) has shown that measurements of based on optically selected quasars survey are not significantly affected by dust at z2.
It is possible that the overall cosmological evolution of is dominated by feedback processes rather than by gas consumption due to star formation. The observed mass of HI at any redshift may relate more to the recombination timescale for the ionized HII and the timescale for cooling and collapse into molecular hydrogen () and thereafter into stars. Models from Efstathiou (2000) indicate that DLA systems might predominantly be due to the outer parts of galaxies which do not even participate in star formation.
It can be seen in Figure 6 that is significantly below the current estimates of in stars in the nearby Universe. This is a significant change in the situation compared with Storrie-Lombardi et al. 1996c (Figure 1b). The main reason for this change is that for the currently favoured Lambda-dominated cosmology, the mass in HI at high redshift drops by a factor of 50% compared with an =1 Universe. This is purely a geometric effect and mainly affects the relative normalisation between z=2 and z=0.
In any case, the observations in the redshift range 2 to 5 show no evolution in the total amount of neutral gas in contrast to the earlier results of Lanzetta, Wolfe and Turnshek (1995), who found that (z3) was twice (z2). Under simple assumptions of closed box evolution, this could be interpreted as indicating there is little gas consumption due to star formation in DLA systems in this redshift range. Similarly, at z 2, Prochaska, Gawiser & Wolfe (2001) conclude that there is no evolution in the metallicity of DLA systems from column density-weighted Fe abundance measurements in DLAs. Since metallicity studies focus on the higher column density systems they may be giving a biased or incomplete view of global galactic chemical evolution at z3. These metallicity evolution results are still very much open to debate as another study by Savaglio (2000) shows that the metallicity content of DLAs and sub-DLAs does decrease with redshift when one excludes the highest column density systems (N(HI)) from the analysis. It is important to note that at z3.5, 90% of the HI lies below this limit. Moreover, the current practice of using column density weighted metallicities neglects the fact that the metallicity observations are biased towards high HI column density systems and hence do not necessarily trace the global metallicity evolution.
The detailed comparison of high redshift (z2) observations with lower redshifts is currently quite difficult. In the local Universe 21-cm emission measurements are used to determine the neutral gas mass density. However, direct detections of DLA systems are paradoxically more difficult for several reasons: the observed DLA wavelengths are shifted to the UV requiring HST observations, the redshift path available per quasar is lower and the number of DLA systems per unit redshift is lower. In fact the most recent determination of at z1 by Rao & Turnshek (2000) is higher than the previous estimate by Lanzetta, Wolfe and Turnshek (1991).
Nevertheless, since DLAs are the most directly observable baryonic mass systems at high redshift, their properties are an important constraint for theories of galaxy formation (Kauffmann Charlot 1994, Kauffmann Haehnelt 2000). For example, Somerville, Primack Faber (2000) have used the integrated total neutral gas (HI+HeII) to constrain models (Figure 6) which vary in their recipes for star formation (due to collisional starburst, constant efficiency quiescent star formation or accelerated quiescent star formation). The models take into account the “cold gas” which includes neutral as well as molecular gas.
To summarise, we find that at z3.5 the fraction of neutral gas mass in DLAs above the commonly used Wolfe et al. (1996) DLA definition of N(HI) atom cm-2 is only 55 compared with 90% at z3.5 and that the remaining fraction of the neutral gas mass lies in systems below this limit, in “sub-DLAs” with column density N(HI) atom cm-2. We also find that the total mass is conserved over the redshift range 2 to 5. This is strongly indicative that we are observing the assembly of high column density systems from lower column density units and independently of the precise physical nature of damped Lyman- shows that we are observing the epoch of their formation or initial collapse. A systematic study of the kinematic and metallic properties of DLA systems with z3.5 and N(HI) above atom cm-2 is an obvious program for the new generation of echelle spectographs on 8m class telescopes. It will also be important to directly establish the N(HI) column density distribution function below 2 atom cm-2. We are currently undertaking such a program using VLT UVES archival echelle data of high redshift quasars (Dessauges-Zavadsky et al. 2003, Péroux et al. 2003). The data used for the analysis in this paper are available from http://www.ast.cam.ac.uk/~quasars.
5 Acknowledgments
We thank Bob Carswell, Mike Fall, Sandro D’Odorico, Patrick Petitjean, Max Pettini, Martin Rees, and Joop Schaye for helpful discussions. CP is grateful to PPARC and the Isaac Newton Trust for support and RGM thanks the Royal Society and the Raymond and Beverly Sackler Foundation for support.
References
- [1] Bahcall, J.N., Peebles, P.J.E., 1967, ApJL, 156, 7
- [2] Bosma, A., 1981, AJ, 86, 1825
- [3] Cole, S. & the 2dFRGS team, 2001, MNRAS, 326, 255
- [4] Dessauges-Zavadsky, M., Péroux, C., Kim, T.-S., D’Odorico, S. & McMahon G. R., 2003, MNRAS, in press (astro-ph/0307049)
- [5] Efstathiou, G., 2000, MNRAS, 317, 697
- [6] Ellison, S., Yan, L., Hook, I., Pettini, M., Wall, J., Shaver, P., 2001, A&A, 379, 393
- [7] Fukugita, M., Hogan, C. & Peebles, P., 1998, ApJ, 503, 518
- [8] Fynbo, J., Moller, P. & Thomsen, B., 2001, A&A, 374, 443
- [9] Gnedin, N. & Ostriker, J., 1992, ApJ, 400, 1
- [10] Haehnelt, M., Steinmetz, M. & Rauch., M., 1998, ApJ, 495, 647
- [11] Jannuzi, B. & HST Quasar Absorption Line Key Project, 1998, ApJS, 118,1
- [12] Kauffmann, G. & Charlot, S. 1994, ApJ, 430, 97
- [13] Kauffmann, G. & Haehnelt, M. 2000, MNRAS, 311, 576
- [14] Kim, T-S., Cristiani, S. & D’Odorico, S., 2001, 373, 757
- [15] Lanzetta, K., Wolfe, A. & Turnshek, D., 1995, ApJ, 440, 435
- [16] Ledoux, C., Petitjean, P., Bergeron, J., Wampler, J. & Srianand, R., 1998, A&A, 337, 51L
- [17] Lu, L., Sargent, W., Womblem D. & Takada-Hidai, M., 1996, ApJ, 472, 509
- [18] Natarajan, P. & Pettini, M., 1997, MNRAS, 291, 28
- [19] Persic, M. Salucci, P., 1992, MNRAS, 258, 14P
- [20] Savaglio, S., 2000, IAU Symposium, Vol. 204
- [21] Somerville, R., Primack, J. & Faber, S., 2001, MNRAS, 320, 504
- [22] Steidel, C., Dickinson, M. & Persson, S., 1994, ApJ, 437, L75
- [23] Stengler-Larrea, E., et al, 1995, ApJ, 444, 64
- [24] Storrie-Lombardi, L., McMahon, R., Irwin, M. & Hazard, C., 1994, ApJ, 427, L13
- [25] Storrie-Lombardi, L., Irwin, M. &McMahon, R. 1996a, MNRAS, 282, 1330
- [26] Storrie-Lombardi, L., McMahon, R. & Irwin, M., 1996b, MNRAS, 283, L79
- [27] Storrie-Lombardi, L., McMahon, R., Irwin, M. & Hazard, C., 1996c, ApJ, 468, 121
- [28] Storrie-Lombardi, L. & Wolfe, A., 2000, ApJ, 543, 552
- [29] Pei, Y. & Fall, M., 1995, ApJ, 454, 69
- [30] Péroux, C., Storrie-Lombardi, L., McMahon, R., Irwin, M. & Hook, I., 2001, AJ, 121, 1799
- [31] Péroux, C., Dessauges-Zavadsky, M., D’Odorico, S., Kim, T.-S., & McMahon G. R., 2003, MNRAS, in press (astro-ph/0307050)
- [32] Petitjean, P., Webb, J., Rauch. M., Carswell, R., & Lanzetta, K., 1993, MNRAS, 262, 499
- [33] Prochaska, J. & Wolfe, A., 1998, ApJ, 507, 113
- [34] Prochaska, J., Gawiser, E. & Wolfe, A., 2001, ApJ, 551, 99
- [35] Rao, S. & Briggs, F., 1993, ApJ, 419, 515
- [36] Rao, S. & Turnshek, D., 2000, ApJS, 130, 1
- [37] Tytler, D., 1987, ApJ, 321, 49
- [38] Weymann, R. et al, 1998, ApJ, 506, 1
- [39] Williger, G., Baldwin, J., Carswell, R., Cooke, A., Hazard, C., Irwin, M., McMahon, R., & Storrie-Lombardi, L., 1994, ApJ, 428, 574
- [40] Wolfe, A., Turnshek, D., Smith, H. & Cohen, R., 1986, ApJS, 61, 249
Appendix A The sample of quasars with confirmed or candidate DLA absorbers
Table 2 lists the 114 confirmed or candidate DLA absorbers used in our study, their redshift and HI column densities together with the redshift path surveyed for each quasars. The following corrections to the low redshift sample derived by Lanzetta, Turnshek and Wolfe (1995) have been made: the Q1329+4117 DLA at =0.5193, and the Q2112+059 DLA at =0.2039 have been ruled out (Jannuzi et al. 1998, Fynbo, Moller & Thomsen, 2001), while Q0302223 has a DLA at =0.1014 (Jannuzi et al. 1998).
| Quasar | log N(HI) | Refa | ||||
|---|---|---|---|---|---|---|
| Q 0000-2619 | 4.11 | 2.389 | 4.060 | 3.3901 | 21.4 | 5,13 |
| BR J0006-6208 | 4.455 | 2.944 | 4.400 | 2.97 | 20.7 | 25 |
| 3.20 | 20.9 | 25 | ||||
| 3.78 | 21.0 | 25 | ||||
| Q 0010-0012 | 2.15 | 1.634 | 2.119 | 2.0233 | 20.8 | 4,10 |
| Q 0013-0029 | 2.08 | 1.634 | 2.049 | 1.9730 | 20.7 | 4,11 |
| BR B0019-1522 | 4.528 | 2.97 | 4.473 | 3.4370 | 20.92 | 22,1 |
| Q 0027+0103 | 2.29 | 1.634 | 2.257 | 1.9375 | 20.6 | 4,10 |
| BR J0030-5129 | 4.174 | 2.304 | 4.122 | 2.45 | 20.8 | 25 |
| Q 0042-2930 | 2.39 | 1.591 | 2.354 | 1.931 | 20.5 | 4 |
| Q 0049-2820 | 2.26 | 1.638 | 2.223 | 2.0713 | 20.5 | 4,11 |
| Q 0056+0125 | 3.16 | 2.197 | 3.119 | 2.7750 | 21.0 | 4,10 |
| Q 0058-2914 | 3.07 | 1.778 | 3.052 | 2.6711 | 21.2 | 21 |
| Q 0100-3105 | 2.64 | 1.687 | 2.605 | 2.131 | 20.5 | 4 |
| Q 0100+1300 | 2.69 | 1.64 | 2.74 | 2.3093 | 21.4 | 16,15 |
| Q 0102-1902 | 3.04 | 2.044 | 2.995 | 2.3693 | 21.0 | 5,8 |
| Q 0102-0214 | 1.98 | 1.649 | 1.949 | 1.7431 | 20.6 | 4,10 |
| PSS J0106+2601 | 4.309 | 2.764 | 4.256 | 3.96 | 20.5 | 25 |
| BRI B0111-2819 | 4.30 | 2.709 | 4.247 | 3.1043 | 21.0 | 1 |
| Q 0112-3041 | 2.99 | 1.881 | 2.945 | 2.4191 | 20.5 | 21,9 |
| Q 0112-3041 | 2.99 | 1.881 | 2.945 | 2.7023 | 20.3 | 21,9 |
| Q 0112+0300 | 2.81 | 1.813 | 2.785 | 2.4227 | 21.0 | 5,11 |
| PSS J0132+1341 | 4.147 | 2.844 | 4.096 | 3.93 | 20.3 | 1 |
| PSS J0133+0400 | 4.154 | 2.865 | 4.102 | 3.69 | 20.4 | 25 |
| 3.77 | 20.5 | 25 | ||||
| PSS J0134+3307 | 4.532 | 2.562 | 4.477 | 3.76 | 20.6 | 25 |
| Q 0149+3335 | 2.43 | 1.64 | 2.43 | 2.1413 | 20.5 | 16,7 |
| PSS J0152+0735 | 4.051 | 1.890 | 4.000 | 3.84 | 20.7 | 25 |
| Q 0201+3634 | 2.49 | 1.632 | 2.879 | 2.4614 | 20.4 | 21,8 |
| Q 0201+3634 | 2.49 | 1.632 | 2.879 | 1.768 | 20.5 | 21 |
| PSS J0209+0517 | 4.174 | 2.759 | 4.122 | 3.66 | 20.3 | 25 |
| 3.86 | 20.6 | 25 | ||||
| Q 0216+0803 | 3.00 | 1.731 | 2.953 | 2.2930 | 20.5 | 5,9 |
| BR J0301-5537 | 4.133 | 2.825 | 4.082 | 3.22 | 20.3 | 25 |
| Q 0302-223 | 1.4000 | 1.0077 | 1.3760 | 1.0104 | 20.36 | 24 |
| BR J0307-4945 | 4.728 | 3.138 | 4.671 | 4.46 | 20.8 | 25 |
| SDSS J0310-0014 | 4.658 | 3.087 | 4.601 | 3.42 | 20.5 | 25 |
| BR B0331-1622 | 4.38 | 2.868 | 4.326 | 3.56 | 20.6 | 1 |
| BR J0334-1612 | 4.363 | 3.080 | 4.309 | 3.56 | 21.0 | 25 |
| Q 0336-0142 | 3.20 | 2.109 | 3.155 | 3.0619 | 21.2 | 21,8 |
| SDSS J0338+0021 | 5.010 | 3.528 | 4.950 | 4.06 | 20.4 | 25 |
| Q 0347-3819 | 3.23 | 2.044 | 3.186 | 3.0244 | 20.8 | 21,18 |
| BR J0426-2202 | 4.320 | 2.544 | 4.267 | 2.98 | 21.1 | 25 |
| Q 0449-1330 | 3.097 | 2.006 | 3.056 | 2.052 | 20.4 | 21 |
| Q 0458-0203 | 2.29 | 1.96 | 2.29 | 2.0399 | 21.7 | 16,7 |
| Q 0528-2505 | 2.779 | 1.961 | 2.741 | 2.1404 | 21.0 | 5 |
| PSS J0747+4434 | 4.430 | 2.764 | 4.376 | 3.76 | 20.3 | 25 |
| 4.02 | 20.6 | 25 | ||||
| Q 0834-2006 | 2.75 | 1.632 | 2.704 | 1.715 | 20.4 | 21 |
| Q 0836+1122 | 2.70 | 1.74 | 2.67 | 2.4660 | 20.6 | 16,6 |
| Q 0913+0715 | 2.78 | 1.866 | 2.739 | 2.6187 | 20.3 | 21,8 |
| MG 0930+2858 | 3.41 | 2.173 | 3.366 | 3.24 | 20.5 | 2 |
| Q 0935+4143 | 1.9800 | 1.0626 | 1.550 | 1.369 | 20.3 | 3 |
| BR B0951-0450 | 4.369 | 2.93 | 4.315 | 3.8580 | 20.6 | 22,1 |
| BR B0951-0450 | 4.369 | 2.93 | 4.315 | 4.2028 | 20.4 | 22,1 |
| BRI B0952-0115 | 4.426 | 2.99 | 4.372 | 4.0238 | 20.55 | 22,1 |
| PC 0953+4749 | 4.457 | 3.010 | 4.004 | 3.403 | 20.9 | 1 |
| PC 0953+4749 | 4.457 | 3.010 | 4.004 | 3.890 | 21.1 | 1 |
| BRI B1013+0035 | 4.405 | 2.61 | 4.351 | 3.1031 | 21.1 | 22,1 |
| Q 1032+0414 | 3.39 | 2.067 | 3.347 | 2.839 | 20.3 | 21 |
| PSS J1057+4555 | 4.116 | 2.652 | 4.065 | 3.05 | 20.3 | 1,25 |
| BRI B1108-0747 | 3.922 | 2.64 | 3.873 | 3.607 | 20.33 | 22,23 |
| BRI B1114-0822 | 4.495 | 3.19 | 4.440 | 4.2576 | 20.3 | 22,1 |
| Q 1151+0651 | 2.76 | 1.65 | 2.76 | 1.7737 | 21.3 | 16,6 |
| Quasar | log N(HI) | Refa | ||||
|---|---|---|---|---|---|---|
| Q 1159+0132 | 3.27 | 1.988 | 3.226 | 2.6846 | 21.1 | 21,8 |
| PSS J1159+1337 | 4.073 | 2.563 | 4.022 | 3.72 | 20.3 | 25 |
| BR B1202-0725 | 4.694 | 3.16 | 4.637 | 4.383 | 20.49 | 22,23 |
| Q 1205+0918 | 2.08 | 1.634 | 2.046 | 1.673 | 20.6 | 4 |
| Q 1209+0919 | 3.30 | 2.175 | 3.254 | 2.5835 | 21.4 | 21,8 |
| Q 1210+1731 | 2.54 | 1.634 | 2.502 | 1.8920 | 20.6 | 4,10 |
| Q 1215+3322 | 2.61 | 1.64 | 2.60 | 1.9989 | 21.0 | 16,7 |
| Q 1223+1753 | 2.92 | 1.945 | 2.879 | 2.4658 | 21.5 | 4,11 |
| Q 1232+0815 | 2.57 | 1.789 | 2.534 | 2.3376 | 20.9 | 4,10 |
| Q 1240+1516 | 2.28 | 1.634 | 2.247 | 1.738 | 20.7 | 4 |
| Q 1244+3443 | 2.48 | 1.64 | 2.50 | 1.8593 | 20.5 | 16,7 |
| Q 1246-0217 | 2.11 | 1.634 | 2.075 | 1.779 | 21.2 | 4 |
| PSS J1253-0228 | 4.007 | 2.498 | 3.957 | 2.78 | 21.4 | 25 |
| Q 1308+0105 | 2.80 | 1.634 | 2.763 | 1.762 | 20.6 | 4 |
| GB 1320+3927 | 2.98 | 1.968 | 2.940 | 2.11 | 20.4 | 2 |
| Q 1337+1121 | 2.92 | 1.86 | 2.92 | 2.7957 | 20.9 | 16,6 |
| BRI B1346-0322 | 3.992 | 2.65 | 3.942 | 3.7343 | 20.72 | 22,1 |
| Q 1347+1116 | 2.70 | 1.92 | 2.71 | 2.4709 | 20.3 | 16,6 |
| Q 1409+0930 | 2.86 | 1.979 | 2.800 | 2.4561 | 20.5 | 21,8 |
| PSS J1443+2724 | 4.407 | 2.950 | 4.353 | 4.216 | 20.8 | 1 |
| Q 1451+1223 | 3.26 | 2.158 | 3.207 | 2.478 | 20.4 | 16,21 |
| BR BI1500+0824 | 3.943 | 2.39 | 3.894 | 2.7968 | 20.8 | 22,1 |
| GB 1610+2806 | 3.54 | 2.021 | 3.498 | 2.59 | 20.6 | 2 |
| MG 1614+0506 | 3.21 | 1.984 | 3.168 | 2.52 | 20.4 | 2 |
| PSS J1618+4125 | 4.213 | 2.820 | 4.161 | 3.92 | 20.5 | 25 |
| RX J1759+6638 | 4.320 | 2.804 | 4.267 | 3.40 | 20.4 | 25 |
| GB 1759+7539 | 3.05 | 1.955 | 3.010 | 2.624 | 20.77 | 2 |
| PSS J1802+5616 | 4.158 | 2.891 | 4.106 | 3.76 | 20.4 | 25 |
| PC 2047+0123 | 3.799 | 2.620 | 3.751 | 2.7299 | 20.4 | 1 |
| PSS J2122-0014 | 4.114 | 2.350 | 4.063 | 3.20 | 20.3 | 25 |
| Q 2132-4321 | 2.42 | 1.595 | 2.386 | 1.916 | 20.7 | 4 |
| Q 2138-4427 | 3.17 | 2.107 | 3.128 | 2.851 | 20.9 | 4,12 |
| PSS J2154+0335 | 4.363 | 2.979 | 4.309 | 3.61 | 20.4 | 25 |
| PSS J2155+1358 | 4.256 | 2.940 | 4.203 | 3.32 | 21.1 | 25 |
| Q 2206-1958 | 2.56 | 1.85 | 2.58 | 1.9205 | 20.5 | 16,14 |
| Q 2206-1958 | 2.56 | 1.85 | 2.58 | 2.0763 | 20.7 | 16,17 |
| Q 2223-0512 | 1.4040 | 0.4159 | 0.6310 | 0.4925 | 20.9 | 3 |
| Q 2223-0512 | 1.4040 | 0.9259 | 1.3800 | 3 | ||
| Q 2230+0232 | 2.15 | 1.634 | 2.119 | 1.8642 | 20.8 | 4,10,11 |
| Q 2231-0015 | 3.015 | 1.749 | 2.980 | 2.0657 | 20.6 | 4,9 |
| BR B2237-0607 | 4.558 | 2.96 | 4.502 | 4.0691 | 20.5 | 22,1 |
| Q 2239-3836 | 3.55 | 2.389 | 3.508 | 3.2810 | 20.8 | 21,9 |
| PSS J2241+1352 | 4.441 | 3.027 | 4.387 | 4.28 | 20.7 | 25 |
| Q 2248+0127 | 2.56 | 1.634 | 2.524 | 1.9080 | 20.6 | 4,10 |
| BR J2317-4345 | 3.943 | 2.448 | 3.894 | 3.49 | 20.9 | 25 |
| PSS J2344+0342 | 4.239 | 2.696 | 4.187 | 3.21 | 20.9 | 25 |
| Q 2348-0108 | 3.01 | 2.044 | 2.965 | 2.4272 | 20.5 | 16,6 |
| Q 2348-0108 | 3.01 | 2.044 | 2.965 | 2.6161 | 21.3 | 21,6 |
| Q 2351+0217 | 2.03 | 1.634 | 2.000 | 1.766 | 20.9 | 4,10 |
| Q 2359-0216 | 2.31 | 1.747 | 2.779 | 2.0951 | 20.7 | 16,7 |
| Q 2359-0216 | 2.31 | 1.747 | 2.779 | 2.1537 | 20.3 | 16,7 |
aReferences: 1) Storrie-Lombardi & Wolfe 2000; 2) Storrie-Lombardi & Hook 2000; 3) Lanzetta, Wolfe, & Turnshek 1995; 4) Wolfe et al. 1995; 5) Sargent, Steidel, & Boksenberg 1989; 6) Turnshek et al. 1989; 7) Wolfe et al. 1993; 8) Lu et al. 1993; 9) Lu & Wolfe; 10) Virgilio et al. 1995; 11) Pettini et al. 1994; 12) Francis & Hewett 1993; 13) Savaglio et al. 1994; 14) Sargent, Boksenberg, & Steidel 1988; 15) Black, Chaffee, & Foltz 1987; 16) Wolfe et al. 1986; 17) Wolfe et al. 1994; 18) Rauch et al. 1990; 19) Williger et al. 1989; 20) Meyer, Lanzetta & Wolfe 1995; 21) Lanzetta et al. 1991; 22) Storrie-Lombardi, McMahon, Irwin, & Hazard 1996; 23) Storrie-Lombardi, Irwin & McMahon 1996; 24) Jannuzi et al. 1998; 25) Péroux et al. 2001
Appendix B The sample of quasars without DLA absorbers
Table 2 lists the quasars from our study where no DLAs where discovered. The table also provides the redshift path surveyed for each quasars.
| Quasar | Refa | |||
|---|---|---|---|---|
| Q 0001+0842 | 3.241 | 2.024 | 3.229 | 21 |
| Q 0002+151 | 1.8990 | 0.4723 | 0.6034 | 3 |
| Q 0002+151 | 1.8990 | 1.1198 | 1.5500 | 3 |
| Q 0003+158 | 0.4500 | 0.0080 | 0.4355 | 3 |
| PSS J0003+2730 | 4.240 | 2.718 | 4.188 | 26 |
| MG 0004+1359 | 3.25 | 1.899 | 3.207 | 2 |
| Q 0004+1711 | 2.898 | 2.002 | 2.851 | 21 |
| Q 0006+0230 | 2.09 | 1.787 | 2.059 | 4 |
| Q 0006+0200 | 2.35 | 1.634 | 2.317 | 4 |
| Q 0007-0004 | 2.26 | 1.634 | 2.227 | 4 |
| Q 0007-000 | 2.29 | 1.670 | 2.260 | 16 |
| MG 0007+0141 | 2.90 | 1.882 | 2.861 | 2 |
| Q 0007+106 | 0.0890 | 0.0080 | 0.0781 | 3 |
| Q 0009-0138 | 1.99 | 1.634 | 1.960 | 4 |
| Q 0009+0219 | 2.66 | 1.784 | 2.623 | 4 |
| Q 0009-0215 | 2.11 | 1.634 | 2.079 | 4 |
| Q 0014+8118 | 3.380 | 1.928 | 3.340 | 21 |
| Q 0014-0256 | 1.85 | 1.729 | 1.821 | 4 |
| Q 0015+0239 | 2.47 | 1.784 | 2.435 | 4 |
| Q 0016+0045 | 2.31 | 1.651 | 2.277 | 4 |
| Q 0018-0220 | 2.56 | 1.634 | 2.524 | 4 |
| Q 0018+0047 | 1.83 | 1.655 | 1.802 | 4 |
| Q 0020+0217 | 1.80 | 1.665 | 1.772 | 4 |
| Q 0022+0150 | 2.77 | 1.791 | 2.732 | 4 |
| Q 0023+0010 | 1.90 | 1.657 | 1.871 | 4 |
| Q 0025-0151 | 2.08 | 1.634 | 2.049 | 4 |
| Q 0026+0158 | 1.89 | 1.727 | 1.861 | 4 |
| Q 0026+129 | 0.1420 | 0.0080 | 0.1306 | 3 |
| Q 0027+0149 | 2.33 | 1.694 | 2.297 | 4 |
| Q 0028+0236 | 2.00 | 1.634 | 1.970 | 4 |
| Q 0028-0148 | 2.08 | 1.840 | 2.049 | 4 |
| Q 0029+0017 | 2.23 | 1.725 | 2.198 | 4 |
| Q 0029-0152 | 2.39 | 2.013 | 2.356 | 4 |
| PSS J0030+1702 | 4.282 | 2.763 | 4.229 | 1 |
| PSS J0034+1639 | 4.293 | 2.981 | 4.240 | 26 |
| SDSS J0035+0040 | 4.747 | 3.309 | 4.690 | 26 |
| Q 0037-018 | 2.34 | 1.654 | 2.303 | 16 |
| Q 0039-2630 | 1.81 | 1.634 | 1.782 | 4 |
| Q 0040-2917 | 2.09 | 1.634 | 2.056 | 4 |
| Q 0041-2638 | 3.045 | 1.657 | 3.029 | 21 |
| Q 0041-2707 | 2.79 | 1.668 | 2.748 | 4 |
| Q 0041-2607 | 2.79 | 1.634 | 2.470 | 4 |
| Q 0041-2658 | 2.46 | 1.634 | 2.422 | 4 |
| Q 0041-2859 | 2.13 | 1.589 | 2.103 | 4 |
| Q 0042-3053 | 1.97 | 1.634 | 1.944 | 4 |
| Q 0042-2627 | 3.298 | 2.113 | 3.253 | 21 |
| Q 0042-2656 | 3.33 | 2.215 | 3.314 | 21 |
| Q 0042-2657 | 2.90 | 2.226 | 2.859 | 4 |
| Q 0043-2937 | 2.23 | 1.656 | 2.198 | 4 |
| Q 0044+030 | 0.6240 | 0.3386 | 0.6078 | 3 |
| Q 0045-3002 | 2.02 | 1.603 | 1.991 | 4 |
| Q 0045-0341 | 3.138 | 1.961 | 3.094 | 21 |
| Q 0045-013 | 2.53 | 1.784 | 2.493 | 16 |
| Q 0046-293 | 4.014 | 2.882 | 3.964 | 1 |
| BRI B0046-2458 | 4.15 | 2.575 | 4.099 | 1 |
| Q 0047-2759 | 2.13 | 1.649 | 2.099 | 4 |
| Q 0047-3050 | 2.97 | 1.930 | 2.933 | 4 |
| Q 0047-2538 | 1.97 | 1.591 | 1.939 | 4 |
| Q 0047-2326 | 3.422 | 2.291 | 3.378 | 21 |
| Q 0048-0119 | 1.88 | 1.634 | 1.849 | 4 |
| Q 0048-2545 | 2.08 | 1.634 | 2.051 | 4 |
| Q 0049-0104 | 2.10 | 1.715 | 2.065 | 4 |
| Q 0049-0012 | 1.95 | 1.634 | 1.916 | 4 |
| Q 0049+007 | 2.27 | 1.644 | 2.238 | 16 |
| Quasar | Refa | |||
|---|---|---|---|---|
| Q 0049+014 | 2.31 | 1.681 | 2.276 | 16 |
| Q 0049+171 | 0.0640 | 0.0080 | 0.0534 | 3 |
| Q 0050+124 | 0.0611 | 0.0080 | 0.0505 | 3 |
| Q 0050-2523 | 2.16 | 1.592 | 2.127 | 4 |
| Q 0051-0226 | 2.53 | 1.634 | 2.491 | 4 |
| Q 0052-0058 | 2.21 | 1.634 | 2.180 | 4 |
| Q 0052+251 | 0.1550 | 0.0080 | 0.1435 | 3 |
| Q 0053-0134 | 2.06 | 1.634 | 2.031 | 4 |
| Q 0053-2824 | 3.616 | 2.454 | 3.576 | 21 |
| Q 0054+0200 | 1.87 | 1.634 | 1.844 | 4 |
| Q 0054+144 | 0.1710 | 0.0080 | 0.1593 | 3 |
| Q 0054-006 | 2.76 | 1.854 | 2.724 | 16 |
| Q 0055+0141 | 2.23 | 1.651 | 2.200 | 4 |
| Q 0055-2744 | 2.20 | 1.567 | 2.163 | 4 |
| Q 0055-2629 | 3.6560 | 1.920 | 3.609 | 21 |
| Q 0055-0200 | 1.98 | 1.782 | 1.953 | 4 |
| Q 0055+0025 | 1.91 | 1.634 | 1.885 | 4 |
| Q 0056-0241 | 2.23 | 1.779 | 2.194 | 4 |
| Q 0057-0225 | 2.01 | 1.715 | 1.979 | 4 |
| Q 0057-274 | 3.52 | 2.603 | 3.475 | 1 |
| Q 0058-2604 | 2.47 | 1.606 | 2.437 | 4 |
| Q 0058-0227 | 2.23 | 1.712 | 2.194 | 4 |
| Q 0058+0155 | 1.95 | 1.634 | 1.924 | 4 |
| Q 0059-0207 | 2.29 | 1.653 | 2.257 | 4 |
| Q 0059-2625 | 2.10 | 1.614 | 2.069 | 4 |
| Q 0059+0035 | 2.55 | 1.673 | 2.510 | 4 |
| PSS J0059+0003 | 4.16 | 2.750 | 4.108 | 1 |
| Q 0100+0146 | 1.91 | 1.692 | 1.880 | 4 |
| Q 0101-2548 | 1.97 | 1.596 | 1.943 | 4 |
| Q 0101-3025 | 4.073 | 1.937 | 3.116 | 21 |
| Q 0102-0240 | 1.84 | 1.731 | 1.818 | 4 |
| BRI B0103+0032 | 4.437 | 2.87 | 4.383 | 22 |
| Q 0103-0141 | 2.21 | 1.634 | 2.174 | 4 |
| Q 0103-2901 | 2.87 | 1.922 | 2.831 | 4 |
| Q 0104+0030 | 1.87 | 1.667 | 1.845 | 4 |
| PC 0104+0215 | 4.171 | 2.881 | 4.119 | 1 |
| Q 0105-2649 | 2.46 | 1.667 | 2.428 | 4 |
| Q 0106-0230 | 2.28 | 1.634 | 2.246 | 4 |
| Q 0106+0119 | 2.10 | 1.871 | 2.068 | 4 |
| Q 0107+0022 | 1.97 | 1.634 | 1.938 | 4 |
| Q 0108+0028 | 2.01 | 1.733 | 1.975 | 4 |
| Q 0109+022 | 2.35 | 1.734 | 2.317 | 16 |
| Q 0110-0107 | 1.89 | 1.643 | 1.860 | 4 |
| Q 0112-2728 | 2.894 | 1.784 | 2.855 | 21 |
| Q 0114-0856 | 3.163 | 1.838 | 3.118 | 21 |
| Q 0115-3002 | 3.249 | 1.733 | 3.207 | 21 |
| PSS J0117+1552 | 4.244 | 2.646 | 4.192 | 1 |
| Q 0117+213 | 1.4930 | 0.9989 | 1.4681 | 3 |
| Q 0119-286 | 0.1170 | 0.0080 | 0.1058 | 3 |
| Q 0119-013 | 0.0540 | 0.0080 | 0.0435 | 3 |
| Q 0123+257 | 2.37 | 1.644 | 2.338 | 16 |
| PC 0131+0120 | 3.792 | 3.116 | 3.744 | 1 |
| PSS J0131+0633 | 4.417 | 3.014 | 4.363 | 26 |
| Q 0132-1947 | 3.130 | 1.714 | 3.089 | 21 |
| Q 0134+329 | 0.3670 | 0.0080 | 0.1050 | 3 |
| BRI B0135-4239 | 3.97 | 2.575 | 3.920 | 1 |
| Q 0136+010 | 2.35 | 1.749 | 2.317 | 16 |
| Q 0136+1737 | 2.73 | 1.632 | 2.679 | 21 |
| Q 0143-0135 | 3.141 | 1.673 | 3.097 | 21 |
| GB 0148+2502 | 3.10 | 1.825 | 3.059 | 2 |
| Q 0148-0946 | 2.850 | 1.797 | 2.810 | 21 |
| BRI B0151-0025 | 4.194 | 2.74 | 4.142 | 22 |
| Q 0153+0430 | 2.993 | 1.673 | 2.951 | 21 |
| Q 0157+001 | 0.1631 | 0.0080 | 0.1515 | 3 |
| Quasar | Refa | |||
|---|---|---|---|---|
| Q 0159+036 | 2.47 | 1.644 | 2.436 | 16 |
| Q 0205+024 | 0.1564 | 0.0080 | 0.1448 | 3 |
| Q 0207-0019 | 2.853 | 1.756 | 2.817 | 21 |
| SDSS J0211-0009 | 4.874 | 3.402 | 4.815 | 26 |
| Q 0215+015 | 1.7150 | 0.9996 | 1.5500 | 3 |
| Q 0219+428 | 0.4440 | 0.0080 | 0.4296 | 3 |
| GB 0229+1309 | 2.07 | 1.767 | 2.039 | 2 |
| Q 0232-042 | 1.4360 | 0.0080 | 0.6320 | 3 |
| Q 0232-042 | 1.4360 | 0.8733 | 1.4116 | 3 |
| BR J0234-1806 | 4.301 | 2.971 | 4.248 | 26 |
| Q 0237-233 | 2.2230 | 1.1593 | 1.5402 | 3 |
| Q 0239-1527 | 2.786 | 1.928 | 2.744 | 21 |
| BRI B0241-0146 | 4.053 | 2.86 | 4.002 | 22 |
| BR B0245-0608 | 4.238 | 2.96 | 4.186 | 22 |
| PSS J0248+1802 | 4.422 | 2.810 | 4.368 | 1,26 |
| Q 0249-1826 | 3.210 | 1.871 | 3.163 | 21 |
| Q 0249-2212 | 3.21 | 2.044 | 3.160 | 5,1 |
| Q 0252+0136 | 2.47 | 1.634 | 2.430 | 4 |
| Q 0254+0000 | 2.25 | 1.634 | 2.215 | 4 |
| Q 0256-0000 | 3.377 | 2.241 | 3.330 | 21 |
| Q 0256-0031 | 2.00 | 1.634 | 1.965 | 4 |
| Q 0258+0210 | 2.52 | 1.634 | 2.489 | 4 |
| Q 0301-0035 | 3.226 | 2.060 | 3.181 | 21 |
| Q 0302-0019 | 3.290 | 1.739 | 3.243 | 21 |
| Q 0305+0127 | 2.15 | 1.634 | 2.118 | 4 |
| Q 0307-0058 | 2.11 | 1.634 | 2.075 | 4 |
| Q 0308+0129 | 2.34 | 1.739 | 2.302 | 4 |
| Q 0308+1902 | 2.839 | 1.673 | 2.797 | 21 |
| Q 0308-1920 | 2.756 | 1.673 | 2.714 | 21 |
| BR J0311-1722 | 4.039 | 2.591 | 3.989 | 26 |
| Q 0312-770 | 0.2230 | 0.0080 | 0.2108 | 3 |
| Q 0316-2023 | 2.869 | 1.747 | 2.826 | 21 |
| Q 0323+022 | 0.1470 | 0.0080 | 0.1295 | 3 |
| BR J0324-2918 | 4.622 | 2.900 | 4.566 | 26 |
| Q 0329-2534 | 2.689 | 1.661 | 2.662 | 21 |
| Q 0334-2029 | 3.132 | 2.057 | 3.089 | 21 |
| PC 0345+0130 | 3.638 | 2.699 | 3.592 | 1 |
| BR B0351-1034 | 4.351 | 3.09 | 4.297 | 22 |
| Q 0351-3904 | 3.01 | 1.632 | 2.970 | 21 |
| Q 0352-2732 | 2.823 | 1.673 | 2.781 | 21 |
| BR J0355-3811 | 4.545 | 3.030 | 4.490 | 26 |
| BR B0401-1711 | 4.236 | 2.82 | 4.184 | 22 |
| BR J0403-1703 | 4.227 | 2.992 | 4.175 | 26 |
| Q 0405-123 | 0.5740 | 0.0080 | 0.5583 | 3 |
| Q 0414-060 | 0.7810 | 0.0080 | 0.7632 | 3 |
| BR J0415-4357 | 4.070 | 2.813 | 4.019 | 26 |
| BR J0419-5716 | 4.461 | 2.820 | 4.406 | 26 |
| Q 0420+007 | 2.918 | 1.673 | 2.879 | 21 |
| Q 0420-3851 | 3.1230 | 2.094 | 3.082 | 21 |
| BR J0426-2202 | 4.320 | 2.544 | 4.267 | 26 |
| Q 0428-1342 | 3.244 | 1.965 | 3.200 | 21 |
| Q 0454-220 | 0.5340 | 0.1199 | 0.5187 | 3 |
| Q 0454+039 | 1.3450 | 0.9672 | 1.3216 | 3 |
| Q 0457+024 | 2.38 | 1.645 | 2.346 | 16 |
| MG 0504+0303 | 2.46 | 1.803 | 2.425 | 2 |
| Q 0521-365 | 0.0566 | 0.0080 | 0.0460 | 3 |
| PMN J0525-3343 | 4.383 | 2.829 | 4.329 | 26 |
| BR J0529-3526 | 4.413 | 3.023 | 4.359 | 26 |
| BR J0529-3552 | 4.172 | 2.821 | 4.120 | 26 |
| Q 0537-441 | 0.8940 | 0.5139 | 0.6300 | 3 |
| Q 0548-322 | 0.0690 | 0.0080 | 0.0583 | 3 |
| Q 0552+398 | 2.36 | 1.644 | 2.325 | 16 |
| Q 0558-504 | 0.1370 | 0.0080 | 0.1256 | 3 |
| Q 0624+691 | 0.3700 | 0.0080 | 0.3563 | 3 |
| Quasar | Refa | |||
|---|---|---|---|---|
| Q 0636+6801 | 3.178 | 2.019 | 3.132 | 21 |
| Q 0637-752 | 0.6560 | 0.0080 | 0.6251 | 3 |
| Q 0642+4454 | 3.408 | 2.192 | 3.362 | 21 |
| Q 0702+646 | 0.0795 | 0.0080 | 0.0687 | 3 |
| BR J0714-6455 | 4.462 | 3.050 | 4.407 | 26 |
| Q 0731+6519 | 3.038 | 2.019 | 2.993 | 21 |
| Q 0735+178 | 0.4240 | 0.0765 | 0.4098 | 3 |
| Q 0736+017 | 0.1910 | 0.0080 | 0.1791 | 3 |
| Q 0742+318 | 0.4620 | 0.0080 | 0.4474 | 3 |
| Q 0743-673 | 1.5130 | 1.0302 | 1.4879 | 3 |
| GB 0749+4239 | 3.59 | 2.185 | 3.544 | 2 |
| PC 0751+5623 | 4.281 | 3.526 | 4.228 | 1 |
| Q 0754+100 | 0.6700 | 0.0080 | 0.6257 | 3 |
| Q 0754+394 | 0.0958 | 0.0080 | 0.0848 | 3 |
| Q 0804+761 | 0.1000 | 0.0080 | 0.0890 | 3 |
| Q 0805+0441 | 2.880 | 1.838 | 2.834 | 21 |
| Q 0812+332 | 2.42 | 1.677 | 2.385 | 16 |
| Q 0819-032 | 2.35 | 1.704 | 2.319 | 16 |
| Q 0820+296 | 2.37 | 1.644 | 2.333 | 16 |
| MG 0830+1009 | 3.75 | 2.040 | 3.703 | 2 |
| Q 0830+1133 | 2.979 | 1.797 | 2.936 | 21 |
| Q 0831+1238 | 2.748 | 1.961 | 2.706 | 21 |
| Q 0837-120 | 0.1980 | 0.0080 | 0.1860 | 3 |
| Q 0844+349 | 0.0640 | 0.0080 | 0.0534 | 3 |
| Q 0846+152 | 2.64 | 1.831 | 2.599 | 16 |
| MG 0848+1533 | 2.01 | 1.735 | 1.980 | 2 |
| Q 0849+080 | 0.0620 | 0.0080 | 0.0514 | 3 |
| Q 0851+202 | 0.3060 | 0.0080 | 0.2929 | 3 |
| Q 0855+182 | 2.62 | 1.682 | 2.580 | 16 |
| Q 0903+155 | 2.68 | 1.659 | 2.645 | 16 |
| MG 0906+0406 | 3.20 | 1.811 | 3.158 | 2 |
| Q 0906+484 | 0.1180 | 0.0080 | 0.1068 | 3 |
| Q 0910+403 | 0.9360 | 0.0080 | 0.9166 | 3 |
| Q 0914-621 | 0.0573 | 0.0080 | 0.0467 | 3 |
| Q 0916+555 | 0.1235 | 0.0080 | 0.1123 | 3 |
| Q 0932+3646 | 2.84 | 1.634 | 2.814 | 21 |
| Q 0933+733 | 2.53 | 1.651 | 2.493 | 16 |
| Q 0938+1159 | 3.19 | 1.634 | 3.149 | 21 |
| Q 0941+2608 | 2.913 | 1.731 | 2.867 | 21 |
| Q 0953+414 | 0.2390 | 0.0080 | 0.2266 | 3 |
| Q 0955+326 | 0.5330 | 0.0080 | 0.5177 | 3 |
| Q 0956+1217 | 3.306 | 2.159 | 3.263 | 21 |
| Q 0957+561 | 1.4050 | 0.8179 | 1.3810 | 3 |
| Q 0958+551 | 1.7324 | 1.1762 | 1.4513 | 3 |
| Q 1001+291 | 0.3290 | 0.0080 | 0.3157 | 3 |
| Q 1004+130 | 0.2410 | 0.0080 | 0.2286 | 3 |
| Q 1004+1411 | 2.707 | 1.786 | 2.672 | 21 |
| Q 1007+417 | 0.6110 | 0.0080 | 0.5949 | 3 |
| Q 1009-0252 | 2.75 | 1.651 | 2.708 | 4 |
| Q 1011-282 | 0.6110 | 0.0080 | 0.1310 | 3 |
| Q 1011-0144 | 2.24 | 1.669 | 2.204 | 4 |
| Q 1011+250 | 1.6310 | 0.9718 | 1.5500 | 3 |
| Q 1012+008 | 0.1850 | 0.0080 | 0.1732 | 3 |
| Q 1012-0206 | 2.14 | 1.634 | 2.104 | 4 |
| GB 1013+2052 | 3.11 | 1.945 | 3.069 | 2 |
| Q 1014+0023 | 2.29 | 1.634 | 2.591 | 4 |
| Q 1016-0039 | 2.18 | 1.649 | 2.144 | 4 |
| Q 1017+1055 | 3.158 | 2.114 | 3.127 | 21 |
| Q 1017+280 | 1.9280 | 0.9971 | 1.4678 | 3 |
| Q 1018-0005 | 2.60 | 1.789 | 2.560 | 4 |
| Q 1020+0028 | 1.90 | 1.680 | 1.872 | 4 |
| Q 1021-0037 | 2.547 | 1.887 | 2.513 | 21 |
| Q 1024+0030 | 2.17 | 1.717 | 2.135 | 4 |
| Q 1025-0030 | 2.87 | 1.885 | 2.833 | 4 |
| Quasar | Refa | |||
|---|---|---|---|---|
| RX J1028-0844 | 4.276 | 2.533 | 4.223 | 26 |
| Q 1028+313 | 0.1770 | 0.0080 | 0.1652 | 3 |
| Q 1029-140 | 0.0860 | 0.0080 | 0.0751 | 3 |
| Q 1033+1342 | 3.07 | 1.800 | 3.048 | 21 |
| BR B1033-0327 | 4.509 | 2.91 | 4.454 | 22,23 |
| Q 1038+528 | 2.30 | 1.677 | 2.262 | 16 |
| GB 1041+3014 | 2.99 | 1.735 | 2.950 | 2 |
| Q 1047+550 | 2.1650 | 1.3299 | 1.5159 | 3 |
| BRI B1050-0000 | 4.286 | 2.83 | 4.233 | 22 |
| Q 1100+772 | 0.3110 | 0.0080 | 0.2979 | 3 |
| Q 1100-264 | 2.1450 | 1.1551 | 1.5500 | 3 |
| MG 1101+0248 | 2.51 | 1.736 | 2.475 | 2 |
| Q 1103-006 | 0.4260 | 0.0080 | 0.4117 | 3 |
| BRI B1110+0106 | 3.918 | 2.58 | 3.869 | 22 |
| Q 1115+080 | 1.7180 | 0.4066 | 0.6330 | 3 |
| Q 1115+080 | 1.7180 | 0.9595 | 1.5500 | 3 |
| Q 1116+215 | 0.1770 | 0.0080 | 0.1652 | 3 |
| Q 1123+264 | 2.35 | 1.645 | 2.317 | 16 |
| Q 1124+5706 | 2.890 | 1.762 | 2.851 | 21 |
| Q 1127+078 | 2.66 | 1.644 | 2.621 | 16 |
| Q 1128+105 | 2.65 | 2.040 | 2.610 | 16 |
| Q 1131-0043 | 2.16 | 1.653 | 2.128 | 4 |
| Q 1132-0054 | 2.76 | 1.717 | 2.718 | 4 |
| Q 1135-0255 | 2.41 | 1.739 | 2.373 | 4 |
| Q 1136-135 | 0.5570 | 0.0080 | 0.5414 | 3 |
| Q 1136+122 | 2.90 | 1.781 | 2.862 | 16 |
| Q 1137+660 | 0.6460 | 0.0080 | 0.6295 | 3 |
| Q 1138-0107 | 2.76 | 1.953 | 2.718 | 4 |
| Q 1139-0139 | 1.93 | 1.634 | 1.884 | 4 |
| Q 1139-0037 | 1.91 | 1.634 | 1.896 | 4 |
| Q 1142+0138 | 2.42 | 1.791 | 2.390 | 4 |
| Q 1142+1015 | 3.152 | 2.127 | 3.109 | 21 |
| Q 1143+0142 | 2.28 | 1.634 | 2.248 | 4 |
| Q 1143+099 | 2.60 | 1.676 | 2.567 | 16 |
| Q 1144+115 | 2.51 | 1.682 | 2.471 | 16 |
| Q 1144+0140 | 2.59 | 1.667 | 2.551 | 4 |
| Q 1145-0039 | 1.94 | 1.634 | 1.912 | 4 |
| Q 1145+0121 | 2.08 | 1.721 | 2.045 | 4 |
| Q 1146+0207 | 2.06 | 1.634 | 2.025 | 4 |
| Q 1147+084 | 2.61 | 1.854 | 2.577 | 16 |
| GB 1147+4348 | 3.02 | 2.035 | 2.980 | 2 |
| Q 1148-0007 | 1.977 | 1.634 | 1.947 | 4 |
| Q 1148+0055 | 1.89 | 1.667 | 1.858 | 4 |
| Q 1148+549 | 0.9690 | 0.0080 | 0.9493 | 3 |
| Q 1151+117 | 0.1760 | 0.0080 | 0.1642 | 3 |
| Q 1156+295 | 0.7290 | 0.0080 | 0.7117 | 3 |
| Q 1159+0039 | 2.586 | 1.671 | 2.550 | 21 |
| Q 1202+281 | 0.1650 | 0.0080 | 0.1534 | 3 |
| Q 1205-3014 | 3.036 | 2.045 | 2.996 | 21 |
| Q 1206+1155 | 3.106 | 2.039 | 3.073 | 21 |
| Q 1206+1500 | 2.60 | 1.793 | 2.568 | 4 |
| Q 1206+1727 | 2.36 | 1.634 | 2.321 | 4 |
| Q 1206+459 | 1.1580 | 0.4231 | 0.6300 | 3 |
| Q 1206+459 | 1.1580 | 0.8426 | 1.1364 | 3 |
| Q 1209+1046 | 2.20 | 1.634 | 2.163 | 4 |
| Q 1209+1524 | 3.06 | 1.634 | 3.021 | 4 |
| Q 1211+143 | 0.0850 | 0.0080 | 0.0742 | 3 |
| Q 1212+1551 | 1.95 | 1.665 | 1.918 | 4 |
| Q 1212+1045 | 1.95 | 1.634 | 1.922 | 4 |
| Q 1212+0854 | 2.35 | 1.634 | 2.319 | 4 |
| Q 1213+1015 | 2.52 | 1.634 | 2.482 | 4 |
| Q 1213+0922 | 2.72 | 1.675 | 2.681 | 4 |
| Q 1215+1244 | 2.08 | 1.634 | 2.048 | 4 |
| Q 1215+1202 | 2.83 | 1.634 | 2.788 | 4 |
| Quasar | Refa | |||
|---|---|---|---|---|
| Q 1215+303 | 0.2370 | 0.0080 | 0.2246 | 3 |
| Q 1216+069 | 0.3340 | 0.0080 | 0.3207 | 3 |
| Q 1216+1517 | 1.83 | 1.723 | 1.802 | 4 |
| Q 1216+1754 | 1.81 | 1.634 | 1.781 | 4 |
| Q 1216+1656 | 2.83 | 1.659 | 2.791 | 4 |
| Q 1216+0947 | 2.31 | 1.645 | 2.279 | 4 |
| Q 1217+023 | 0.2400 | 0.0080 | 0.2276 | 3 |
| Q 1218+304 | 0.1300 | 0.0080 | 0.1187 | 3 |
| Q 1219+755 | 0.0700 | 0.0080 | 0.0593 | 3 |
| Q 1219+1140 | 2.18 | 1.634 | 2.147 | 4 |
| Q 1222+228 | 2.0400 | 0.4647 | 0.6316 | 3 |
| Q 1222+1053 | 2.30 | 1.641 | 2.263 | 4 |
| Q 1223+1059 | 2.32 | 1.643 | 2.288 | 4 |
| Q 1223+1723 | 2.42 | 1.659 | 2.386 | 4 |
| Q 1224+1244 | 2.14 | 1.634 | 2.110 | 4 |
| Q 1225+1512 | 2.01 | 1.797 | 1.977 | 4 |
| Q 1225+1610 | 2.23 | 1.663 | 2.200 | 4 |
| Q 1225+317 | 2.2190 | 1.1263 | 1.5500 | 3 |
| Q 1226+1035 | 2.32 | 1.634 | 2.287 | 4 |
| Q 1226+1115 | 1.98 | 1.634 | 1.950 | 4 |
| Q 1226+1639 | 2.25 | 1.634 | 2.216 | 4 |
| Q 1226+023 | 0.1580 | 0.0080 | 0.1464 | 3 |
| Q 1227+1215 | 2.17 | 1.624 | 2.138 | 4 |
| Q 1228+1808 | 2.64 | 1.780 | 2.607 | 4 |
| Q 1228+077 | 2.39 | 1.691 | 2.354 | 16 |
| Q 1229+1414 | 2.90 | 1.764 | 2.862 | 4 |
| Q 1229+1531 | 2.27 | 1.634 | 2.237 | 4 |
| Q 1229-021 | 1.0380 | 0.4738 | 0.6320 | 3 |
| Q 1229+204 | 0.0640 | 0.0080 | 0.0534 | 3 |
| Q 1230+1042 | 2.43 | 1.634 | 2.396 | 4 |
| Q 1230+1318 | 2.29 | 1.634 | 2.257 | 4 |
| Q 1230+1627B | 2.70 | 1.634 | 2.663 | 4 |
| Q 1230+0941 | 1.84 | 1.641 | 1.812 | 4 |
| Q 1232-0051 | 2.78 | 1.782 | 2.745 | 4 |
| Q 1232+1139 | 2.87 | 1.848 | 2.831 | 4 |
| Q 1234+0122 | 2.03 | 1.634 | 1.996 | 4 |
| Q 1235+1807A | 2.41 | 1.782 | 2.371 | 4 |
| Q 1236-0043 | 1.84 | 1.690 | 1.815 | 4 |
| Q 1236-0207 | 2.25 | 1.729 | 2.213 | 4 |
| Q 1237+1515 | 2.04 | 1.634 | 2.009 | 4 |
| Q 1237+0107 | 1.81 | 1.733 | 1.780 | 4 |
| Q 1237+1508 | 2.07 | 1.634 | 2.035 | 4 |
| Q 1237+1212 | 2.31 | 1.634 | 2.281 | 4 |
| Q 1239+1435 | 1.93 | 1.634 | 1.900 | 4 |
| Q 1239+0249 | 2.22 | 1.719 | 2.184 | 4 |
| Q 1240+1504 | 1.85 | 1.634 | 1.823 | 4 |
| Q 1241+176 | 1.2730 | 0.4066 | 0.6320 | 3 |
| Q 1241+176 | 1.2730 | 0.7657 | 1.2503 | 3 |
| Q 1242+0213 | 1.99 | 1.634 | 1.958 | 4 |
| Q 1242+0006 | 2.08 | 1.634 | 2.045 | 4 |
| Q 1242+1732 | 1.83 | 1.696 | 1.805 | 4 |
| Q 1242+1737 | 1.86 | 1.634 | 1.828 | 4 |
| Q 1244+1129 | 3.16 | 2.101 | 3.118 | 4 |
| Q 1244+1642 | 2.87 | 1.848 | 2.826 | 4 |
| Q 1246-0059 | 2.45 | 1.669 | 2.415 | 4 |
| Q 1246+0032 | 2.31 | 1.651 | 2.273 | 4 |
| Q 1247+267 | 2.0380 | 0.9211 | 1.5500 | 3 |
| Q 1248+401 | 1.0300 | 0.3984 | 0.6028 | 3 |
| Q 1248+401 | 1.0300 | 0.8919 | 1.0097 | 3 |
| Q 1253-055 | 0.5380 | 0.0080 | 0.5226 | 3 |
| Q 1259+593 | 0.4720 | 0.0080 | 0.4573 | 3 |
| Q 1302-102 | 0.2860 | 0.0080 | 0.2731 | 3 |
| Q 1307+085 | 0.1550 | 0.0080 | 0.1435 | 3 |
| Q 1308+326 | 0.9960 | 0.4670 | 0.6310 | 3 |
| Quasar | Refa | |||
|---|---|---|---|---|
| Q 1308-0214 | 2.85 | 1.892 | 2.811 | 4 |
| Q 1308-0104 | 2.59 | 1.634 | 2.549 | 4 |
| Q 1309+355 | 0.1840 | 0.0080 | 0.1722 | 3 |
| BR J1310-1740 | 4.185 | 2.508 | 4.133 | 26 |
| Q 1312+043 | 2.35 | 1.813 | 2.319 | 16 |
| Q 1313+0107 | 2.39 | 1.647 | 2.359 | 4 |
| PSS J1317+3531 | 4.365 | 2.978 | 4.311 | 1 |
| Q 1317+277 | 1.0220 | 0.2503 | 1.0018 | 3 |
| Q 1318+290B | 0.5490 | 0.3757 | 0.5335 | 3 |
| Q 1318-0150 | 2.01 | 1.651 | 1.980 | 4 |
| Q 1318-113 | 2.3080 | 1.896 | 2.273 | 16 |
| Q 1320+0048 | 1.96 | 1.655 | 1.925 | 4 |
| Q 1323-0248 | 2.12 | 1.661 | 2.090 | 4 |
| Q 1324-0212 | 1.89 | 1.634 | 1.857 | 4 |
| Q 1327-206 | 1.1690 | 1.1243 | 1.1473 | 3 |
| Q 1328+0223 | 2.15 | 1.937 | 2.122 | 4 |
| BRI B1328-0433 | 4.217 | 2.24 | 4.165 | 22 |
| Q 1329+0231 | 2.43 | 1.663 | 2.400 | 4 |
| Q 1329+0018 | 2.35 | 1.661 | 2.318 | 4 |
| Q 1329+4117 | 1.9350 | 0.4853 | 0.6318 | 3 |
| Q 1331+170 | 2.0840 | 1.2621 | 1.5500 | 3 |
| Q 1333+176 | 0.5540 | 0.3902 | 0.5385 | 3 |
| Q 1334+246 | 0.1070 | 0.0080 | 0.0959 | 3 |
| Q 1334-0033 | 2.78 | 1.634 | 2.745 | 4 |
| Q 1334+0212 | 2.38 | 1.634 | 2.350 | 4 |
| BRI B1335-0417 | 4.396 | 3.08 | 4.342 | 22 |
| Q 1336+0210 | 1.96 | 1.634 | 1.932 | 4 |
| GB 1338+3809 | 3.10 | 1.737 | 3.059 | 2 |
| Q 1338+101 | 2.45 | 1.724 | 2.412 | 16 |
| Q 1338+416 | 1.2190 | 0.4066 | 0.6324 | 3 |
| Q 1338+416 | 1.2190 | 0.8684 | 1.1968 | 3 |
| Q 1340+0959 | 2.942 | 1.894 | 2.897 | 21 |
| Q 1344+0137 | 1.92 | 1.634 | 1.886 | 4 |
| Q 1345-0137 | 1.93 | 1.634 | 1.900 | 4 |
| Q 1345-0120 | 2.95 | 1.926 | 2.906 | 4 |
| Q 1346+0121A | 1.93 | 1.634 | 1.901 | 4 |
| Q 1346-036 | 2.36 | 1.653 | 2.327 | 16 |
| Q 1351+640 | 0.0880 | 0.0080 | 0.0771 | 3 |
| Q 1352+183 | 0.1520 | 0.0080 | 0.1405 | 3 |
| Q 1352+108 | 3.18 | 1.928 | 3.137 | 16 |
| Q 1353+186 | 0.0505 | 0.0080 | 0.0400 | 3 |
| Q 1354+195 | 0.7200 | 0.3593 | 0.6330 | 3 |
| Q 1355-416 | 0.3130 | 0.0080 | 0.2999 | 3 |
| Q 1356+581 | 1.3710 | 0.5218 | 0.6310 | 3 |
| Q 1358+115 | 2.59 | 1.677 | 2.550 | 16 |
| Q 1358+3908 | 3.3 | 2.221 | 3.237 | 21 |
| Q 1400+0935 | 2.980 | 2.022 | 2.930 | 21 |
| Q 1402-012 | 2.52 | 1.789 | 2.479 | 16 |
| Q 1402+044 | 3.20 | 2.340 | 3.160 | 16 |
| Q 1406+123 | 2.94 | 2.018 | 2.903 | 16 |
| Q 1407+265 | 0.9440 | 0.0080 | 0.9246 | 3 |
| Q 1410+096 | 3.21 | 2.099 | 3.169 | 16 |
| FIRST J1410+3409 | 4.351 | 3.026 | 3.578 | 26 |
| 3.602 | 4.297 | 26 | ||
| Q 1411+442 | 0.0900 | 0.0080 | 0.0791 | 3 |
| GB 1413+3720 | 2.36 | 1.735 | 2.326 | 2 |
| Q 1415+451 | 0.1140 | 0.0080 | 0.1029 | 3 |
| Q 1416-129 | 0.1290 | 0.0080 | 0.1177 | 3 |
| Q 1418+546 | 0.1520 | 0.0080 | 0.1405 | 3 |
| Q 1419+480 | 0.0720 | 0.0080 | 0.0613 | 3 |
| Q 1421+330 | 1.9040 | 1.0311 | 1.5500 | 3 |
| Q 1425+267 | 0.3620 | 0.2409 | 0.3484 | 3 |
| Q 1426+015 | 0.0860 | 0.0080 | 0.0751 | 3 |
| Q 1428+0202 | 2.11 | 1.634 | 2.075 | 4 |
| Quasar | Refa | |||
|---|---|---|---|---|
| Q 1429-0053 | 2.08 | 1.719 | 2.047 | 4 |
| Q 1429+118 | 3.00 | 1.958 | 2.963 | 16 |
| PSS J1430+2828 | 4.306 | 2.777 | 4.253 | 1 |
| Q 1433+0223 | 2.14 | 1.634 | 2.111 | 4 |
| Q 1433-0025 | 2.04 | 1.634 | 2.012 | 4 |
| PSS J1435+3057 | 4.297 | 2.905 | 4.244 | 1 |
| GB 1436+4431 | 2.10 | 1.769 | 2.069 | 2 |
| Q 1439+0047 | 1.86 | 1.649 | 1.828 | 4 |
| Q 1440-0024 | 1.81 | 1.634 | 1.786 | 4 |
| Q 1440+356 | 0.0781 | 0.0080 | 0.0673 | 3 |
| Q 1444+407 | 0.2670 | 0.0080 | 0.2543 | 3 |
| Q 1444+0126 | 2.21 | 1.717 | 2.174 | 4 |
| Q 1444-0112 | 2.15 | 1.651 | 2.121 | 4 |
| Q 1451-375 | 0.3140 | 0.0080 | 0.3009 | 3 |
| Q 1455+123 | 3.08 | 1.830 | 3.033 | 16 |
| PSS J1456+2007 | 4.249 | 2.878 | 4.197 | 26 |
| MG 1500+0431 | 3.67 | 2.606 | 3.623 | 1 |
| Q 1503+118 | 2.78 | 1.957 | 2.740 | 16 |
| GB 1508+5714 | 4.283 | 2.73 | 4.230 | 22 |
| Q 1512+370 | 0.3710 | 0.0080 | 0.3573 | 3 |
| MG 1519+1806 | 3.06 | 1.955 | 3.019 | 2 |
| GB 1520+4347 | 2.18 | 1.775 | 2.148 | 2 |
| Q 1522+101 | 1.3210 | 0.0080 | 0.6310 | 3 |
| Q 1522+101 | 1.3210 | 0.8803 | 1.2978 | 3 |
| Q 1525+227 | 0.2530 | 0.0080 | 0.2405 | 3 |
| GB 1526+6701 | 3.02 | 1.955 | 2.980 | 2 |
| Q 1526+285 | 0.4500 | 0.0080 | 0.2428 | 3 |
| Q 1538+477 | 0.7700 | 0.3326 | 0.6326 | 3 |
| Q 1545+210 | 0.2640 | 0.0080 | 0.2514 | 3 |
| Q 1548+0917 | 2.749 | 1.874 | 2.707 | 21 |
| PC 1548+4637 | 3.544 | 2.607 | 3.499 | 1 |
| Q 1553+113 | 0.3600 | 0.0080 | 0.3464 | 3 |
| Q 1556+273 | 0.0899 | 0.0080 | 0.0790 | 3 |
| MG 1557+0313 | 3.891 | 2.66 | 3.842 | 22 |
| MG 1559+1405 | 2.24 | 1.737 | 3.059 | 2 |
| Q 1600+0729 | 4.38 | 3.062 | 4.326 | 1 |
| BR J1603+0721 | 4.385 | 3.062 | 4.331 | 26 |
| Q 1607+1819 | 3.123 | 1.814 | 3.0918 | 21 |
| Q 1612+261 | 0.1310 | 0.0080 | 0.1197 | 3 |
| Q 1613+658 | 0.1290 | 0.0080 | 0.1177 | 3 |
| Q 1623+268A | 2.47 | 1.644 | 2.433 | 16 |
| Q 1623+268B | 2.54 | 1.644 | 2.502 | 16 |
| Q 1630+377 | 1.4710 | 0.0080 | 0.6320 | 3 |
| Q 1630+377 | 1.4710 | 0.8641 | 1.4463 | 3 |
| Q 1631+3722 | 2.940 | 1.785 | 2.906 | 21 |
| PSS J1633+1411 | 4.351 | 2.536 | 4.297 | 26 |
| Q 1634+706 | 1.3340 | 0.5547 | 1.3107 | 3 |
| Q 1641+399 | 0.5950 | 0.0080 | 0.5791 | 3 |
| PC 1640+4628 | 3.700 | 2.604 | 3.653 | 1 |
| PSS J1646+5514 | 4.037 | 2.772 | 3.987 | 26 |
| Q 1704+608 | 0.3710 | 0.0080 | 0.3573 | 3 |
| Q 1705+0152 | 2.576 | 1.669 | 2.537 | 21 |
| Q 1715+535 | 1.9290 | 1.1009 | 1.5500 | 3 |
| Q 1718+481 | 1.0840 | 0.0080 | 1.0632 | 3 |
| PSS J1721+3256 | 4.031 | 2.791 | 3.981 | 26 |
| Q 1721+343 | 0.2060 | 0.0080 | 0.1939 | 3 |
| Q 1726+3425 | 2.429 | 1.669 | 2.393 | 21 |
| Q 1727+502 | 0.0550 | 0.0080 | 0.0445 | 3 |
| Q 1738+3502 | 3.240 | 2.093 | 3.197 | 21 |
| GB 1745+6227 | 3.901 | 2.47 | 3.852 | 22 |
| Q 1803+676 | 0.1360 | 0.0080 | 0.1246 | 3 |
| Q 1807+698 | 0.0512 | 0.0080 | 0.0407 | 3 |
| Q 1821+643 | 0.2970 | 0.0080 | 0.2840 | 3 |
| Q 1831+731 | 0.1230 | 0.0080 | 0.1118 | 3 |
| Quasar | Refa | |||
|---|---|---|---|---|
| Q 1833+326 | 0.0590 | 0.0080 | 0.0484 | 3 |
| Q 1836+5108 | 2.827 | 1.920 | 2.789 | 21 |
| Q 1839-785 | 0.0743 | 0.0080 | 0.0636 | 3 |
| Q 1845+797 | 0.0556 | 0.0080 | 0.0450 | 3 |
| Q 1912-550 | 0.4020 | 0.1769 | 0.2041 | 3 |
| Q 1928+738 | 0.3020 | 0.0080 | 0.2890 | 3 |
| PKS 1937-101 | 3.787 | 2.442 | 3.739 | 21 |
| Q 2000-3300 | 3.783 | 2.521 | 3.729 | 21 |
| Q 2005-489 | 0.0710 | 0.0080 | 0.0603 | 3 |
| Q 2038-0116 | 2.783 | 1.887 | 2.745 | 21 |
| Q 2045-377 | 1.8000 | 1.0040 | 1.5500 | 3 |
| Q 2048+3116 | 3.198 | 1.830 | 3.143 | 21 |
| Q 2050-359 | 3.49 | 2.605 | 3.445 | 1 |
| Q 2112+0555 | 0.4660 | 0.1105 | 0.4513 | 3,24,25 |
| Q 2113-4345 | 2.05 | 1.664 | 2.023 | 4 |
| Q 2113-4534 | 2.54 | 1.969 | 2.506 | 4 |
| Q 2114-4346 | 2.04 | 1.606 | 2.011 | 4 |
| Q 2115-4434 | 2.16 | 1.755 | 2.128 | 4 |
| Q 2117-4703 | 2.26 | 1.849 | 2.223 | 4 |
| Q 2122-4231 | 2.27 | 1.550 | 2.233 | 4 |
| Q 2126-1551 | 3.2660 | 2.011 | 3.218 | 21 |
| Q 2126-4618 | 1.89 | 1.715 | 1.859 | 4 |
| Q 2127-4528 | 2.71 | 2.018 | 2.676 | 4 |
| Q 2128-123 | 0.5010 | 0.0940 | 0.4860 | 3 |
| Q 2130+099 | 0.0610 | 0.0080 | 0.0504 | 3 |
| Q 2131-4257 | 2.10 | 1.590 | 2.065 | 4 |
| PMN J2134-0419 | 4.334 | 2.903 | 4.281 | 26 |
| Q 2134-4239 | 1.80 | 1.590 | 1.776 | 4 |
| Q 2134-147 | 0.2000 | 0.0080 | 0.1880 | 3 |
| Q 2135-4632 | 2.21 | 1.879 | 2.182 | 4 |
| Q 2136+141 | 2.43 | 1.784 | 2.390 | 16 |
| Q 2139-4434 | 3.23 | 2.373 | 3.188 | 4 |
| Q 2141+175 | 0.2130 | 0.0080 | 0.2009 | 3 |
| Q 2145+067 | 0.9900 | 0.9426 | 0.9701 | 3 |
| MG 2152+1420 | 2.56 | 1.800 | 2.524 | 2 |
| Q 2153-2056 | 1.85 | 1.634 | 1.821 | 4 |
| Q 2155-304 | 0.1170 | 0.0080 | 0.1058 | 3 |
| Q 2159-2058 | 2.12 | 1.634 | 2.089 | 4 |
| Q 2201+315 | 0.2970 | 0.0080 | 0.2840 | 3 |
| Q 2203-2145 | 2.27 | 1.692 | 2.240 | 4 |
| Q 2203-1833 | 2.73 | 1.849 | 2.691 | 4 |
| Q 2205-2014 | 2.64 | 1.652 | 2.599 | 4 |
| MG 2206+1753 | 3.14 | 1.769 | 3.099 | 2 |
| Q 2209-1842 | 2.09 | 1.634 | 2.061 | 4 |
| Q 2209+184 | 0.0700 | 0.0080 | 0.0593 | 3 |
| Q 2211-1915 | 1.95 | 1.634 | 1.923 | 4 |
| BR B2212-1626 | 3.990 | 2.69 | 3.940 | 22 |
| Q 2214+139 | 0.0658 | 0.0080 | 0.0551 | 3 |
| BR J2216-6714 | 4.469 | 2.795 | 4.414 | 26 |
| MG 2222+0511 | 2.32 | 1.800 | 2.287 | 2 |
| GB 2223+2024 | 3.56 | 2.101 | 3.514 | 2 |
| Q 2231+0125 | 1.90 | 1.634 | 1.871 | 4 |
| Q 2231-0212 | 1.90 | 1.634 | 1.871 | 4 |
| Q 2233+1341 | 3.209 | 2.216 | 3.167 | 21 |
| Q 2233+1310 | 3.298 | 2.134 | 3.252 | 21 |
| Q 2241+0014 | 2.14 | 1.657 | 2.099 | 4 |
| Q 2243+0141 | 2.30 | 1.663 | 2.267 | 4 |
| Q 2244-0234 | 1.97 | 1.787 | 1.940 | 4 |
| Q 2244-0105 | 2.04 | 1.634 | 2.010 | 4 |
| Q 2246-0006 | 2.05 | 1.651 | 2.019 | 4 |
| BR B2248-1242 | 4.161 | 2.94 | 4.109 | 22 |
| MG 2251+2429 | 2.33 | 2.019 | 2.297 | 2 |
| Q 2251-178 | 0.0680 | 0.0080 | 0.0573 | 3 |
| Q 2251+113 | 0.3230 | 0.1310 | 0.3098 | 3 |
| Quasar | Refa | |||
|---|---|---|---|---|
| MG 2254+0227 | 2.09 | 2.767 | 2.059 | 2 |
| Q 2256+017 | 2.67 | 1.786 | 2.629 | 16 |
| Q 2302+029 | 1.0440 | 0.3942 | 0.6290 | 3 |
| Q 2302+029 | 1.0440 | 0.8060 | 1.0236 | 3 |
| Q 2308+098 | 0.4320 | 0.0080 | 0.4177 | 3 |
| Q 2311-0341 | 3.048 | 1.714 | 3.001 | 21 |
| MG 2320+0755 | 2.09 | 1.780 | 2.059 | 2 |
| Q 2326-477 | 1.2990 | 0.9164 | 1.2760 | 3 |
| BR J2328-4513 | 4.359 | 2.926 | 4.305 | 26 |
| PC | 4.093 | 3.115 | 4.042 | 1 |
| Q 2334+1041 | 2.243 | 1.634 | 2.211 | 21 |
| Q 2344+092 | 0.6720 | 0.0080 | 0.6288 | 3 |
| BR J2349-3712 | 4.208 | 2.847 | 4.156 | 26 |
| Q 2351+1042 | 2.379 | 1.632 | 2.345 | 21 |
| Q 2351+0120 | 2.07 | 1.634 | 2.039 | 4 |
| Q 2351-1154 | 2.67 | 1.632 | 2.633 | 21 |
| Q 2352+0205 | 2.19 | 1.634 | 2.158 | 4 |
| Q 2354-0134 | 2.21 | 1.665 | 2.178 | 4 |
| Q 2356+0139 | 2.07 | 1.661 | 2.039 | 4 |
| Q 2356+0237 | 2.50 | 1.634 | 2.465 | 4 |
| Q 2359+0653 | 3.238 | 1.632 | 3.203 | 21 |
| Q 2359+0023 | 2.897 | 1.714 | 2.857 | 21 |
aReferences: 1) Storrie-Lombardi & Wolfe 2000; 2) Storrie-Lombardi & Hook 2000; 3) Lanzetta, Wolfe, & Turnshek 1995; 4) Wolfe et al. 1995; 5) Sargent, Steidel, & Boksenberg 1989; 6) Turnshek et al. 1989; 7) Wolfe et al. 1993; 8) Lu et al. 1993; 9) Lu & Wolfe; 10) Virgilio et al. 1995; 11) Pettini et al. 1994; 12) Francis & Hewett 1993; 13) Savaglio et al. 1994; 14) Sargent, Boksenberg, & Steidel 1988; 15) Black, Chaffee, & Foltz 1987; 16) Wolfe et al. 1986; 17) Wolfe et al. 1994; 18) Rauch et al. 1990; 19) Williger et al. 1989; 20) Meyer, Lanzetta & Wolfe 1995; 21) Lanzetta et al. 1991; 22) Storrie-Lombardi, McMahon, Irwin, & Hazard 1996; 23) Storrie-Lombardi, Irwin & McMahon 1996; 24) Jannuzi et al. 1998; 25) Fynbo, Moller & Thomsen 2001; 26) Péroux et al. 2001