Present address: Astronomy Dept., Yale University, P.O. Box 208101, New Haven, CT 06520-8101 USA
On leave from Altai State University, Dimitrov Street 66, 656099 Barnaul, Russia
A study of Tycho’s SNR at TeV energies with the HEGRA CT-System
Tycho’s supernova remnant (SNR) was observed during 1997 and 1998 with the HEGRA Čerenkov Telescope System in a search for gamma-ray emission at energies above 1 TeV. An analysis of these data, 65 hours in total, resulted in no evidence for TeV gamma-ray emission. The 3 upper limit to the gamma-ray flux (1 TeV) from Tycho is estimated at photons cm-2 s-1, or 33 milli-Crab. We interpret our upper limit within the framework of the following scenarios: (1) that the observed hard X-ray tail is due to synchrotron emission. A lower limit on the magnetic field within Tycho may be estimated G, assuming that the RXTE-detected X-rays were due to synchrotron emission. However, using results from a detailed model of the ASCA emission, a more conservative lower limit G is derived. (2) the hadronic model of Drury, Aharonian & Völk, and (3) the more recent time-dependent kinetic theory of Berezhko & Völk. Our upper limit lies within the range of predicted values of both hadronic models, according to uncertainties in physical parameters of Tycho, and shock acceleration details. In the latter case, the model was scaled to suit the parameters of Tycho and re-normalised to account for a simplification of the original model. We find that we cannot rule out Tycho as a potential contributor at an average level to the Galactic cosmic-ray flux.
Key Words.:
Gamma rays: observations - ISM: supernova remnants: individual objects: Tycho’s SNR1 Introduction
The search for gamma-ray emission of TeV energies from supernova remnants (SNRs) in recent years is motivated by the need to explain the origin of Galactic cosmic-rays (CR). SNRs are long-believed primarily responsible for the Galactic CR population, matching the CR energetics and spectral index (Völk Volk:1 (1997), Baring 2000a ). The production of -rays in SNRs is thought to result from the interaction of shock-accelerated particles (hadrons and electrons) with the interstellar medium (ISM) and local soft photon fields. Being relatively unattenuated over long distances and preserving the production site directionality, gamma radiation is one of the most accessible tracers of CR acceleration in the universe.
TeV gamma radiation is primarily expected from two channels (1) Collisions of hadronic CRs, producing gamma-rays via decay and (2) CR electrons up-scattering soft photons via the inverse Compton (IC) process, and CR electron collisions via Bremsstrahlung. Detailed modelling of SNR environments has revealed distinct spectral features in the GeV/TeV regime for these processes, and in combination with radio and X-ray observations, those in the TeV regime are deemed vital in establishing SNRs as sites of CR production (Drury, Aharonian & Völk et al. Drury:1 (1994), Naito & Takahara Naito:1 (1994), Berezhko & Völk Berezhko:1 (1997), Baring et al. 2000b ).
So far, evidence for TeV emission has come from CANGAROO observations of two southern hemisphere SNRs, SN 1006, and SNR RX J1713.7-3946 (Tanimori et al. Tanimori:1 (1998), Muraishi et al. Muraishi:1 (2000)), and the HEGRA Čerenkov Telescope CT-System (High Energy Gamma Ray Astronomy Čerenkov Telescope) after deep observations of Cas-A (Pühlhofer et al. Puhlhofer:1 (1999), Aharonian et al. 2000a ). Upper limits are reported for those other promising SNR candidates observed so far in both the TeV and PeV regimes (Buckley et al. Buckley:1 (1998), Prosch et al. Prosch:1 (1996), Goret et al. Goret:1 (1999), Allen et al. Allen:1 (1995), Rowell et al. Rowell:1 (2000)), including Tycho’s SNR, for which the Whipple Collaboration obtained 14.5 hours data. The CANGAROO and HEGRA detections might be interpreted in the framework of the SNR as a source of multi-TeV CR electrons by virtue of a strong non-thermal tail in their X-ray spectra above 1 keV (Koyama et al. Koyama:1 (1995, 1997), Allen et al. Allen:1 (1995)). On the other hand as argued by Aharonian & Atoyan (Aharonian:6 (1999)) and Berezkho, Ksenofontov & Petukhov (Berezhko:3 (1999)) for SN 1006, and by Atoyan et al. (Atoyan:1 (2000)) for Cas-A, the TeV results do not rule out the hadron channel. It is nevertheless less clear at the moment as to the location of CR hadron accelerators in our galaxy.
Tycho’s SNR (G120.11.4, 3C 10) is one of the most intensely studied SNRs. It is an archetypal shell-type (radio & X-Ray) SNR, formed most likely from a type Ia supernova (SN 1572), and has expanded at 0.1% yr-1 to a radius (Katz-Stone et al. Katz-Stone:1 (2000) and references therein). One estimate of distance is put at 2.2 kpc (Albinson et al. 1986 and references therein) based on proper motion studies, absorption against field stars and the fact that Tycho appears embedded in the Perseus arm of the Milky Way. A higher distance estimate of 4.5 kpc (Schwarz et al. Schwarz:1 (1995)) is derived from a model of the HI spectrum and number of HI absorbing features in the region. The radio synchrotron emission (20 & 90 cm) shows variation in photon index that appears correlated with edge filaments, perhaps tracing regions of enhanced magnetic field and particle acceleration (Katz-Stone et al. Katz-Stone:1 (2000)). Studies at the HI 21 cm line indicate expansion on the eastern side of Tycho is slowed by a region of higher density (160–325 cm-3, Reynoso et al. Reynoso:1 (1999)), suggesting that Tycho’s SNR may not be expanding into such a homogeneous region as earlier believed. The X-ray emission shows very strong line features and overall, is well fit by thermal bremsstrahlung components (Fink et al. Fink:1 (1994), Petre et al. Petre:1 (1999)). A power law however is necessary to fit a hard X-ray tail. This presumably non-thermal tail above 1 keV suggests that Tycho may a source of electrons up to 100 TeV, thereby joining the growing number of SNRs that exhibit this feature (see Petre et al. Petre:1 (1999) for a review).
2 Observations
The observations of Tycho’s SNR were made using the HEGRA CT-System incorporating, at the time of data taking (1997 & 1998), four identical imaging air Čerenkov telescopes111Since 1999, the full five telescopes have been in operation, CT2 being the most recent telescope brought online.(CT3-6). The telescopes are operated in coincidence to achieve a stereoscopic view of Čerenkov light air showers induced by and CR primaries. The CT-System is situated on the Roque de los Muchachos at La Palma (2200 m asl, N W) and at the zenith angles of these data, operates at an energy threshold for -ray primaries of 1 TeV (see Konopelko et al. Konopelko:1 (1999) and references therein).
| 1997 | 1998 | Total | |
|---|---|---|---|
| Obs. time (hrs) | 19.7 | 44.9 | 64.6 |
| Selected runs | 50 | 115 | 165(82%) |
| Configuration | CT3-6 | CT3-6 | |
| Zenith angle range | 32-41∘ | 32-45∘ | |
| CR Event Rate (Hz) | 8.4 (10.3) | 8.5 | 8.5 |
The Tycho data were accumulated in Jul-Sep 1997 and Aug-Dec 1998 in 2030 minute runs utilising the wobble mode of observation. In this mode, the source is offset in declination in alternating runs, enabling the background or OFF source data to be estimated from the opposing position (or a series of positions) 1.0∘ away. Table 1 gives a summary of these observations.
Approximately 20% of all runs were rejected, due primarily to weather effects. Bad runs were identified according to the criteria that the image width from each triggered telescope and stereo trigger rate match their expected values accordingly, within 6% for width and 15% for rate (representing levels outside their Gaussian distribution means). The bad runs actually comprised the non-Gaussian tails of these distributions. The trigger rate for CRs was significantly lower in 1998 compared to 1997 (by 25%), attributed mainly to photomultiplier tube (PMT) fatigue and mirror degradation. We accounted for this threshold difference by artifically raising the trigger threshold of 1997 data to 1998 levels by applying a 10 photoelectron threshold to the second-brightest pixel in the image, mimicking the hardware trigger threshold, at 8 photoelectrons. The effect of this software trigger is to simplify analysis and in particular, the estimation of upper limits. It may be justified given the negligible effect on the -ray threshold of this cut (following the 40 photoelectron cut described below) and the fact that the 1997 observation time is 45% that of 1998. The -ray energy threshold222The maximum differential trigger rate, for a number of photon indices. for both years’ data were found from simulations to be consistent within systematic errors (15%) to a value of 1 TeV.
Event filtering follows the standard method in that images containing more than 40 photoelectrons (size) are selected for further analysis. The rejection of the CR background is achieved with cuts on the image shape and the location of it’s reconstructed source position. The reconstruction is described as “Algorithm 1” by Hofmann et al. (Hofmann:1 (1999)) and the shape cut used is the so-called mean scaled width (msw). The msw is the average of the scaled widths from each accepted image. Each image is scaled according to it’s expected value (-ray hypothesis), dependent upon image size, zenith angle of observation and impact distance of the event from the CT-System centre. Following cuts on msw and , the difference between the reconstructed and actual source positions, the stereoscopic method permits unprecedented angular and energy resolution for -ray images on an event-by-event basis of and 20% respectively (Aharonian et al. 2000b ).
We use a combination of “tight cuts” in the shape (0.4msw1.1) and direction ( deg2) criteria to preferentially select ray images against those from CR. Tight cuts are optimal in the search for weak signals in background dominated statistics (35 level), with the caveat that systematic effects may become more important due to the cuts lying close to distribution tails. Tycho is a marginally extended source for the HEGRA CT-System, and thus the optimal cut will be slightly larger than that for a point source at 0.015 deg2. A simple Monte Carlo, matching roughly the statistics of the background of our Tycho dataset, was used to determine an optimal cut, assuming various morphologies for the SNR with the results displayed in Fig. 1.
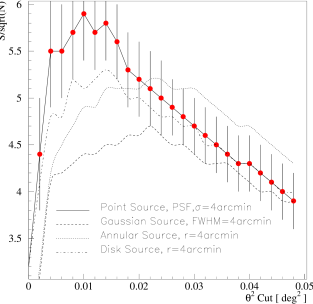
Given the uncertainty in the SNR morphology (disk, Gaussian, annular or a combination), a cut of 0.02 deg2 was deemed suitable.
A useful indicator of data quality is the CR acceptance () of the msw cut on a run-by-run basis (Fig. 2).

We can see that is consistent over the entire dataset and moreover, the cut of 10 p.e on the second brightest pixel applied to 1997 data introduced no significant change in .
3 Results
We evaluate the statistical significance of the post-cut excess using equation 9 of Li & Ma (Li:1 (1983)). The background or OFF source counts are taken from three control regions at position angles 180∘ & , on a circle 0.5∘ radius centred on the tracking position, as the wobble mode of observation permits. A normalisation factor of is therefore used in the significance calculation. By using more than one background region, effects of skynoise, camera response and zenith angle difference are averaged out further (on top of that already afforded by the stereoscopic technique), reducing somewhat any systematics expected from such properties, and moreover, reducing the statistical error in the background. A distribution of for the combined data after application of the msw cut discussed above is presented in Fig. 3.

We summarise further the results in Table 2. No significant excess was seen in either dataset, and the combined excess represents a significance of 1.4.
| 1997 | 1998 | Total | |
|---|---|---|---|
| ON | 127 | 259 | 386 |
| OFF () | 383 | 871 | 1254 |
| ON–OFF () | 0.7 | 1.6 | 1.4 |
| 3 UL (Crab) | 0.033 | ||
| 3 UL ( ph cm-2s-1) | 5.78 | ||
We may express our upper limit in absolute units by using the TeV flux from the Crab Nebula, thereby taking advantage of the substantial simulation effort in deriving the absolute Crab flux (Aharonian et al. 2000b ). Fluctuating the ON–OFF excess according to Helene (Helene:1 (1983)) and using the method described by Aharonian et al. 2000c , our 3 UL (99.7%) corresponds to 33 milli-Crab3331 Crab: ph cm-2s-1 (Aharonian et al. 2000b ). Here, those Crab data used to estimate the UL (6 hours in total), were subjected to an identical analysis as described above, and selected to match the zenith angle distribution as that for Tycho. Above the threshold energy of 1 TeV, our UL is ph cm-2s-1.
Finally, we should point out that the method of Aharonian et al. 2000c (which downward fluctuates the Crab excess) to estimate the UL in Crab units was tested for accuracy with a simple Monte Carlo and found to overestimate a true 3 UL (for the numbers of Table 2 by about 25%. This overestimate is effectively canceled however by the negative bias of our 1.4 excess, an underestimate of 30% relative to a zero excess result. We therefore may assume that our 3 UL represents closely a true estimate. Secondly, any integral UL or flux estimate quoted in absolute units will naturally depend somewhat on the difference in photon index between the Crab and Tycho. This uncertainty amounts to 30% on the UL estimation for a 20% uncertainty in the values of 1 TeV and 1.59 respectively for energy and photon index.
4 Inverse Compton Interpretation
The evidence for a non-thermal tail (Fink et al. Fink:1 (1994), GINGA data; Petre et al. Petre:1 (1999), RXTE data) may suggest that Tycho’s SNR is an accelerator of CR electrons to multi-TeV energies. In such a framework, the synchrotron process is assumed to account for these X-ray photons, and the possibility of inverse Compton (IC) TeV -ray emission should be considered. However, one must be careful here since a power law fit is reasonable only at energies above 10 keV and, alternative physical explanations to the synchrotron scenario do exist (see for e.g. Asvarov et al. Asvarov:1 (1990), Laming Laming:1 (1998), and Tatischeff et al. Tatischeff:1 (1998)).
Assuming that the synchrotron model is valid for Tycho, we may use the direct relationship between the expected IC () and X-ray energy fluxes444Energy flux: () arising from the same electrons:
| (1) |
to establish a condition on the magnetic field of the SNR. The mathematical caveat here is that the correct energy range in the TeV and keV regimes must be adhered to and that we assume that the emission regions of both components have the same size. In the -function approximation of the synchrotron emissivity for an electron, the IC ( / 1 TeV) and X-ray ( / 1 keV) synchrotron energies in Eq. (1) are coupled according to (see Aharonian et al. Aharonian:4 (1997)):
| (2) |
so that for IC fluxes at 1 TeV, a comparison with the X-ray flux at energies 0.1 to 1.0 keV is required for values of to 100 G expected in a SNR. Eq. (1) follows from the fact that the ratio of the synchrotron and IC energy fluxes is proportional to the ratio of the energy densities in the magnetic and CMB fields respectively. The dominant IC flux arises from the up-scattering of CMB photons by CR electrons of energy 10 to 100 TeV. Preliminary results from RXTE data (Petre et al. Petre:1 (1999)) indicate a normalisation (at 1 keV) and photon index respectively of 0.30 photons cm-2 s-1 and 3.18, valid at energies from 10 to 20 keV. From earlier GINGA data Fink et al. (Fink:1 (1994)) derived a power law fit (in combination with a thermal bremsstrahlung and Fe line component) of photon index 2.72 (see Fink for error details) and normalisation of 7.4 ph cm-2s-1 (at 1 keV), which is valid from 4.5 to 20 keV. A direct extrapolation to energies required for the field estimate, namely 0.1 to 1.0 keV, will lead to overestimation of the synchrotron flux since one would expect a turnover near this range. A more reasonable method to estimate fluxes at such lower energies is to fit to the X-ray flux a power law spectrum with exponential cutoff. The RXTE data is preferred for such a fit due to the much reduced errors compared to those of GINGA data. We fit the spectrum using the function:
| (3) |
where (radio photon index) and (cutoff energy) are free parameters and is the normalisation determined from the flux density at 1 GHz =56 Jy (Green Green:1 (2000)). Eq. (3) is derived for an electron spectrum with exponential cutoff using the -function approximation for the electron synchrotron emissivity and is shown to adequately describe the X-ray spectrum out to energies (Reynolds Reynolds:1 (1999)). Our fit yields values of =0.7 and =1.6 keV respectively with differing somewhat from the radio photon index, listed as 0.61 in Green’s catalogue. Katz-Stone et al. (Katz-Stone:1 (2000)) summarise historical measurements of the radio index as varying between 0.5 and 0.7 at different radio bands. From their VLA study, Katz-Stone indicate an average index of the filaments at 0.52. Results are plotted in Fig. 4a showing our best fit, and that when fixing =0.61. We note that Hwang et al. (Hwang:2 (1998)) have placed an upper limit to the non-thermal luminosity in the 0.5 to 10 keV regime on the order of 1034 erg s-1 (0.5 to 10 keV), based on careful modelling of the non-thermal ASCA detection. In order to accommodate their upper limit to the non-thermal luminosity (for a distance of 2.3 kpc as used by Hwang) our synchrotron spectrum fit to RXTE data must be scaled down by a factor 15.5, assuming that their upper limit is exactly 1034 erg s-1 (dotted line in Fig. 4a).
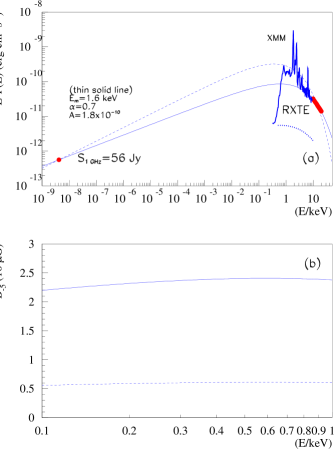
If we take the estimated synchrotron fluxes from 0.1 to 1 keV from the direct RXTE fit with our upper limit at 1 TeV for the IC flux, a range of values 22 to 24 G, plotted in Fig. 4b (solid line), are obtained, which are reasonably consistent with that expected after amplification by the SNR shock. Using however the lower synchrotron energetics implied by Hwang et al. (Hwang:2 (1998)) we arrive at more conservative lower limits on at 6 G, (dotted line). Such a value would result if little or no amplification was present. Allowing for uncertainty of one order of magnitude in the Hwang estimate (ie. 5 to 4 erg s-1) would, for the upper bound case, give a field lower limit a factor higher, ie. 12 G.
5 Comparisons with DAV
We will consider here the production of -radiation by the hadronic or -decay channel described in two-fluid model by Drury, Aharonian & Völk (Drury:1 (1994)), hereafter DAV, that has been used extensively in the past (see also Naito & Takahara Naito:1 (1994)). The DAV prediction may be scaled simply according to the energy budget of the SNR , density of the upstream target matter , and distance to the remnant :
| (4) |
The parameter represents the fraction of energy available for the acceleration of CR that are ultimately released into the ISM. The mean value of per SNR in the galaxy is estimated in the range 0.05 – 0.3 (Berezhko & Völk Berezhko:5 (2000)), and pertains to an evolutionary state well into the Sedov phase when accelerated particles start to be released into the ISM. We shall adopt the reasonable, and often used value of , particle spectral index 1.1 (nominal theory), and for purposes of argument that Tycho has progressed well into the Sedov phase.
Fig. 5 highlights a comparison of this DAV prediction under limiting parameter-space selections as calculated by Völk (Volk:1 (1997)) with our present UL, and those of previous measurements (Whipple, Buckley et al. Buckley:1 (1998) & HEGRA AIROBICC, Prahl et al. Prahl:1 (1997), and CASA-MIA, Borione et al. Borione:1 (1995)).
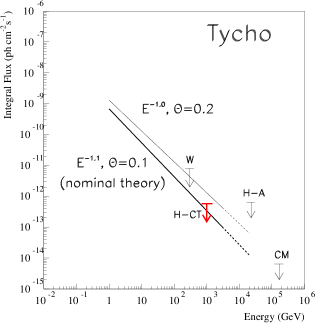
It is clear that with a factor 4 reduction between the Whipple and present upper limits (assuming a spectral index of 1.1 for this comparison), the DAV model is now constrained when allowing for a reasonable range of input parameters. We are approaching the conservative boundary assumed by Völk (Volk:1 (1997)) for the Sedov phase.
An important parameter in view of the expected TeV emission from a SNR is it’s evolutionary phase. Generally accepted is the notion that the maximum TeV -ray emission occurs at the beginning of the Sedov phase and a broad maximum in the total CR energy is reached during the Sedov phase. At the former time the mass of swept-up material will just exceed that ejected, and the outer SNR shock begins to expand with radius . Typical ages of Galactic SNRs for the onset of the Sedov phase are 500 to 1000 yrs. Tycho is a rather young SNR (428 yrs old) expanding into an ISM with density typical of that expected within the Galactic plane and so it may not be clear as to exactly what phase Tycho is presently in. Observational evidence indicates that globally, Tycho’s SNR is near to the Sedov phase (, , Tan & Gull Tan:1 (1985)), and is expanding into, on a global scale at least, a homogeneous ISM. Reynoso et al. (Reynoso:2 (1997)) report a similar value, from VLA data for the global expansion, but note that varies between 0.2 and 0.8 around the shell and suggest the presence of denser material along the eastern side (see also recent 21cm observations by Reynoso et al. (Reynoso:1 (1999))). The expansion rate at X-ray energies is significantly higher than at radio energies, but as in the radio, it also varies considerably azimuthally (Hughes Hughes:1 (2000)). In contrast to the radio behaviour however, the expansion rate at X-ray energies varies radially, supporting the idea of an ejecta-dominated, or pre-Sedov evolutionary state. Taking these results together with the Rayleigh-Taylor instabilities along the eastern side suggested by Velazquez et al. (Velazquez:1 (1998)), we may conclude that the global evolution state of Tycho’s SNR is pre-Sedov, although at regions of high density ISM, the evolutionary state will be locally advanced.
A comparison with DAV predictions should therefore allow for the current evolutionary state of Tycho. The lower curve of Fig. 5 (nominal theory) may be lowered further since the age of Tycho is likely less than the sweep-up time (=555 yrs) which signals the onset of the Sedov phase. A reduction in the -ray emissivity for pre-Sedov epochs can be manifested as a reduction in the parameter to values 0.1. A quantitative estimate for in this case is not trivial but generally one can expect a reduction by a factor 2 based on consideration of results in figs. 1 to 3 of DAV, describing different rates of luminosity increase with time. In the next section comparisons to a model dealing with time-dependence in detail are made.
6 Comparisons with Kinetic Theory
The most recent nonlinear kinetic models are the time-dependent, spherically symmetric solution of Berezhko & Völk Berezhko:1 (1997), hereafter BV, and the Monte Carlo simulation of a quasistationary outer SNR shock in plane parallel geometry by Baring et al. Baring:3 (1999). The BV model is based on the numerical solution of Berezhko, Yelshin & Ksenofontov (Berezhko:4 (1994)) and invokes a distribution of ejecta velocities (e.g. Chevalier & Liang Chevalier:1 (1989) and references therein) that contains very high speed components compared to the mean ejecta velocity. At early evolutionary phases this leads to much higher shock speeds than implied by the mean ejecta velocity, and thus to much more intensive CR and -ray production. We will in this paper make use of BV as it was calculated in their paper, scaling the parameters to those of Tycho’s SNR. As we shall note shortly, in addition, a physical re-normalisation of these results is necessary. For a more complete treatment, we refer to a companion paper elsewhere in which the BV model will be calculated assuming Tycho parameters.
A scaling of the original BV calculations is required since the start-up parameters (in particular ejected mass and SNR energy =1051 erg) may differ from those one might expect for Tycho’s SNR. For this scaling we may reasonably assume, that the ejecta mass only effects the initial normalisation in the form of the sweep-up time , and that other parameters will scale the flux in the same way they do the DAV prediction, ie. independent of time. The first row of Table 3 presents a numerical comparison of our upper limit with the predictions of the BV model, (in units of 10-13 ph cm-2 s-1), scaled to Tycho parameters. is the released fraction of energy available for CRs and is the value assumed for an average SNR, discussed previously.
| Case | a | b | c | d† |
|---|---|---|---|---|
| (G) | 5 | 30 | 5 | 5 |
| 10-3 | 10-3 | 10-4 | 10-4 | |
| 91.00 | 49.20 | 20.00 | 9.00 | |
| 0.60 | 0.55 | 0.50 | 0.50 | |
| 0.17 | 0.18 | 0.20 | 0.20 | |
| 15.50 | 9.00 | 4.00 | 1.80 | |
| /UL | 2.60 | 1.50 | 0.69 | 0.31 |
| 0.06 | 0.04 | 0.04 | 0.04 | |
| HEGRA CT-System UL = 5.78 (10-13 ph cm-2 s-1) | ||||
| Using a mean value for ejecta velocities. | ||||
Inspection of for all cases in Table 3 reveals that they are inconsistent with our upper limit.
However, we must now invoke a further, physical re-normalisation of the Tycho-scaled BV predictions for the following reason. The BV model assumes a parallel shock geometry (shock normal parallel to the average up-stream field) over the entire spherical shock surface. For spherical geometry expected of a SNR, such an assumption will only apply for a limited part of the SNR shock surface. Over other parts the shock is quasi-perpendicular. A strongly reduced injection efficiency below that derived from injection theory for parallel shocks () along with a commensurate reduction of the particle production will be noticed in such regions (regarding the question of injection in general, see Kirk & Dendy Kirk:1 (2001) for a recent review). Correcting for this effect in detail is complicated, and will be discussed in a follow-up paper. However, a rough, but empirically-argued implementation of a re-normalisation is achieved by reducing the fluxes by the ratio to a re-normalised flux , where =0.1 is the empirically expected value for an average Galactic SNR discussed earlier (and adopted by DAV), and is that value predicted by the BV model. The re-normalised fluxes are those -subscripted in Table 3, and are rather close to our upper limit and the relative CR energy calculated at the present age of Tycho. corresponds to values of around ergs. Fig. 6 graphically compares for the different cases discussed. It appears that cases (c) and (d), with a lower injection rate and -field, are preferred. However, the combinations of and used here are not exhaustive. For example a case assuming higher (perhaps suggested by our inverse Compton interpretation in section 4) and low injection rate has not been tested by BV. More thorough comparisons will be made later. The uncertainties in scaling parameters, , and will weaken of course the conclusion favouring cases (c) and (d), in which lower injection rates and fields are assumed. The uncertainty in , where roughly a factor of two above the value used here (2.3 kpc) is published (Schwarz et al. Schwarz:1 (1995)), will have strong influence. Also, a somewhat lower value of =0.3 cm-3 derived by Seward et al. (Seward:1 (1983)) for the pre-shock density may also be preferable to the value given by Smith et al. (Smith:1 (1988)) used here. At this point we would conclude that a general consistency with the BV model is obtained, perhaps favouring lower injection rates and higher fields (noting the reduction in emissivity between cases (a) and (b), due to a change in field), but note that use of a wider parameter space under a dedicated BV calculation is required.
7 Conclusion
A search for TeV -radiation from Tycho’s SNR has been performed over two years (1997 & 1998) with the HEGRA CT-system. We find no evidence for such emission and the upper limit (3 level) to the TeV flux is estimated at 33 milli-Crab or ph cm-2s-1, a value which is a factor 4 less than that previously published by the Whipple collaboration (when assuming a spectral index of 1.1 in for the comparison).
Making use of preliminary RXTE results, it is possible to set a lower limit on the magnetic field in Tycho G under the assumption that the observed hard or non-thermal tail in the X-ray spectrum is attributed to synchrotron radiation from multi-TeV electrons. A more conservative field lower limit of 6 G is obtained if we use the upper limit to the non-thermal X-ray flux estimated by Hwang et al. (Hwang:2 (1998)). It may therefore be premature to draw conclusions about the minimum magnetic field until full analysis of RXTE data are complete. Interestingly the upper limit to the non-thermal energetics of Hwang et al. (Hwang:2 (1998)) is well below that implied by a purely non-thermal interpretation of the RXTE and GINGA results.
Comparisons to a long-adopted model of TeV emission from the decay of were made (Drury, Aharonian & Völk Drury:1 (1994), denoted DAV), in the initial case assuming that Tycho’s SNR is well in to the Sedov phase of evolution. Our upper limit is close to a conservative prediction of DAV. Uncertainty in the global evolutionary state (Sedov, or pre Sedov) of Tycho presents a complication upon comparison to the DAV decay -ray predictions. As a function of time, advanced kinetic theory (Berezhko & Völk Berezhko:1 (1997), denoted BV) indicates a relatively early rise in the -ray emissivity of the hadronic channel for pre-Sedov epochs, in contrast to the less realistic case of single-velocity ejecta, as adopted in the DAV model. We find that after adjusting the predictions of BV, firstly scaling for Tycho’s parameters and secondly, re-normalising to account for quasi-perpendicular shock directions expected in an SNR, a general consistency with our upper limit is found for a range of injection rates and fields.
We conclude from this non-detection and the interpretation assuming Tycho to be a source of multi-TeV electrons and hadrons that Tycho’s SNR is yet to be ruled out as an average accelerator of Galactic CRs. Our upper limit supports the notion that Tycho is in a pre-Sedov evolutionary state. A more complete investigation will be left to a companion paper in which a dedicated calculation in the framework of the BV model will be performed for the parameters (and their uncertainties) of Tycho’s SNR.
Resulting from a type Ia supernova, Tycho’s SNR in principle represents the simplest category in terms of a theoretical understanding of the SNR dynamics and interaction with the ISM. Yet, given the complexity in modeling non-thermal processes, the basic consistency between experiment and theoretical predictions certainly encourages future observations of Tycho’s SNR and other examples of it’s class. Because of the dependence on instrument sensitivity, it is likely that further observations at TeV energies of Tycho will have to wait for the next generation of telescopes operating in the northern hemisphere (e.g MAGIC, Lorenz et al. Lorenz:1 (1999); VERITAS, Krennrich et al. Krennrich:1 (1999)). With roughly one order of magnitude improvement in sensitivity for the next generation instruments over that currently available, and the fact that current theory does not leave much room for non-detection at higher instrument sensitivity, a decisive test of the question of whether or not Tycho’s SNR contributes to the Galactic CR population at an average level is expected within the next few years.
Acknowledgements.
We acknowledge the financial support of the German Ministry for Research and Technology (BMBF) and the Spanish Research Council. We thank the Instituto Astrofísica de Canarias for the use of their site and for the excellent working conditions at La Palma. The technical support staff of the Heidelberg, Kiel, Munich and Yerevan Institutes are also acknowledged. Glenn Allen is thanked for providing a fit to the RXTE Tycho data, and Anne Decourchelle for the model fit to the XMM data. GPR gratefully acknowledges receipt of a von Humboldt Fellowship. An anonymous referee is thanked for helpful comments.References
- (1) Aharonian F.A., Atoyan A.M., Kifune T., 1997, MNRAS 291, 162
- (2) Aharonian F.A. & Atoyan A.M., 1999, A&A 351, 330
- (3) Aharonian F.A, Akhperjanian A.G., Andronache M. et al. 2000a, A&A, submitted
- (4) Aharonian F.A, Akhperjanian A.G., Barrio J.A. et al. 2000b, ApJ 539, 317
- (5) Aharonian F.A., Akhperjanian A.G., Barrio J.A. et al. 2000c, A&A 353, 847
- (6) Aharonian F.A., Akhperjanian A.G., Barrio J.A. et al. 2000d, A&A 361, 1073
- (7) Albinson J.S. et al. 1986, MNRAS 219, 427
- (8) Allen G.E., Berley D., Biller S., et al. 1995, ApJ 448, L25
- (9) Asvarov A.I., Dogiel V.A., Guseinov O.H., Kasumov F.K. 1990, A&A 229, 196
- (10) Atoyan A.M., Aharonian F.A., Tuffs R.J., Völk H.J. 2000, A&A 355, 211
- (11) Baring M.G. 2000a, in Rapportuer Vol. 26th ICRC, ed. B.L. Dingus (AIP, New York, 2000)
- (12) Baring M.G. 2000b, Towards a Major Atmospheric Cherenkov Detector - VI ed. B.L. Dingus, M.H. Salamon, D.B. Kieda (AIP Conf. Series 515, New York, 2000)
- (13) Baring M.G., Ellison, D.C., Reynolds, S.P. et al. 1999, ApJ 513, 311
- (14) Barrio, J.A. et al. 1998, “The MAGIC Telescope”, design study, MPI-PhE/98-5
- (15) Berezhko, E.G., Yelshin V.K., Ksenofontov L.T. 1994, Astropart. Phys. 2, 215
- (16) Berezhko E.G. and Völk H.J. 1997, Astropart. Phys. 7, 183
- (17) Berezhko, E.G, Ksenofontov L.T., Petukhov S.I. 1999, Proc. 26th Int. Cosmic Ray Conf. (Salt Lake City) 4, 431
- (18) Berezhko, E.G. and Völk H.J. 2000, ApJ 540, 923
- (19) Borione A., Catanese M., Covault C.E. et al. 1995, Proc. 24th Int. Cosmic Ray Conf. (Rome) 2, 439
- (20) Buckley J.H., Akerlof C.W., Carter-Lewis D.A., et al. 1998, A&A 329, 639
- (21) Chevalier R.A. and Liang E.P. 1989, ApJ 344, 332
- (22) Decourchelle A., Sauvageot J.L., Audard M. et al. 2001, A&A 365, L218
- (23) Drury L. O’C, Aharonian F., Völk H.J. 1994, A&A 287, 959
- (24) Fink H.H., Asaoka I., Brinkman W. et al 1994, A&A 283, 635
- (25) Goret P., Gouiffes C., Nuss E., et al. 1999, Proc. 26th Int. Cosmic Ray Conf. (Salt Lake City) 3, 496
- (26) Green D.A., 2000, ‘A Catalogue of Galactic Supernova Remnants (2000 August version)’, Mullard Radio Astronomy Observatory, Cavendish Laboratory, Cambridge, United Kingdom (available on the World-Wide-Web at http://www.mrao.cam.ac.uk/surveys/snrs/).
- (27) Heavens A.F. 1984, MNRAS 211, 195
- (28) Helene O. 1983, Nucl. Inst. Meth. 212, 319
- (29) Hofmann W., Jung I., Konopelko A. et al. 1999, Astropart. Phys. 12, 135
- (30) Hwang U., Gotthelf E.V. 1997, ApJ 475, 665
- (31) Hwang U., Hughes J.P., Petre R. 1998, ApJ 497, 833
- (32) Hughes J.P. 2000, ApJ, in press, astro-ph/0010122
- (33) Katz-Stone D.M., Kassim N.E., Joseph T., et al 2000, AJ 529, 453
- (34) Kirk J.G., Dendy R.O. 2000, J.Phys. G: Nucl.Part.Phys. in press
- (35) Konopelko A., Hemberger M., Aharonian F.A., et al. 1999, Astropart. Phys. 10, 275
- (36) Koyama K., Petre R., Goffhelf E.V. et al. 1995, Nat 378, 255
- (37) Koyama K., Kinusaga K., Matsuzaki K. et al. 1997, PASJ 49, L7
- (38) Krennrich F. et al. 1999, Towards a Major Atmospheric Cherenkov Detector - VI, pg 515, ed B.L. Dingus, M.H. Salamon, D.B. Kieda (AIP Conf. Series 515, New York, 2000)
- (39) Laming J.M. ApJ 499, 309
- (40) Li T., Ma Y. 1983, ApJ 272, 317
- (41) Longair M.S. High Energy Astrophysics (Cambridge University Press, 1997)
- (42) Lorenz E. et al. 1999, Towards a Major Atmospheric Cherenkov Detector - VI, pg 510, ed B.L. Dingus, M.H. Salamon, D.B. Kieda (AIP Conf. Series 515, New York, 2000)
- (43) Muraishi H., Tanimori T., Yanagita S., et al. 2000, A&A 354, L57
- (44) Naito T., Takahara F. 1994, J Phys G: Nucl Part Phys 20, 477
- (45) Petre R., Allen G.E., Hwang U. 1999, Astronomische Nachrichten, 320, 199
- (46) Prahl J., Prosch C. for the HEGRA collab. 1997, Proc. 25th Int. Cosmic Ray Conf. (Durban) 3, 217
- (47) Prosch C., Feigl E., Plaga, R., et al. 1996, A&A 314, 275
- (48) Pühlhofer G., Völk H., Wiedner C.A., et al. 1999, Proc. 26th Int. Cosmic Ray Conf. (Salt Lake City) 3, 492
- (49) Reynolds S.P., Keohane J.W. 1999, ApJ 525, 368
- (50) Reynoso E.M., Velazquez P.F., Dubner G.M., Goss W.M. 1999, AJ 117, 1827
- (51) Reynoso E.M., Moffett D.A., Goss W.M. et al. 1997, ApJ 491, 816
- (52) Rowell G.P., Naito T., Dazeley S.A., et al. 2000, A&A 359, 337
- (53) Schwarz U.J., Goss W.M., Kalberla P.M., Benaglia P. 1995 A&A 299, 193
- (54) Seward F., Gorenstein P., Tucker W. 1983, ApJ 266, 287
- (55) Smith A., Davelaar J., Peacock A., et al. 1988, ApJ 325, 288
- (56) Tan S.M. and Gull S.F. 1985, MNRAS 216, 949
- (57) Tanimori T., Hayami Y., Kamei S. et al. 1998, ApJ 492, L33
- (58) Tatischeff V., Ramaty R., Kozlovsky B. 1998, ApJ 504, 874
- (59) Velazquez P.F., Gomez D.O., Dubner G.M. et al. 1998, A&A 334, 1060
- (60) Völk H.J. 1997 in “Towards a Major Atmopsheric Cerenkov Detector - V”, ed O.C. deJager (WESPRINT, Potchefstroom 1997), 87