A 1.2 mm MAMBO/IRAM-30m Survey of Dust Emission from the Highest Redshift PSS Quasars
We report 250 GHz (1.2 mm) observations of redshift quasars from the Palomar Sky Survey (PSS) sample, using the Max-Planck Millimetre Bolometer (MAMBO) array at the IRAM 30-metre telescope. Eighteen sources were detected and upper limits were obtained for 44 with 3 flux density limits in the range 1.5–4 mJy. Adopting typical dust temperatures of 40–50 K, we derive dust masses of a few and far-infrared luminosities of order . We suggest that a substantial fraction of this luminosity arises from young stars, implying star formation rates approaching or more. The high millimetre detection rate supports current views on a connection between AGN and star forming activity, suggesting a parallel evolution of the central black hole and of the stellar core of a galaxy, although their growth-rate ratio seems higher than the mass ratio observed in nearby galaxies. The observed, exceptionally bright objects may trace the peaks of the primordial density field, the cores of future giant ellipticals.
Key Words.:
Galaxies: formation – Galaxies: starburst – Galaxies: high-redshift – Quasars: dust emission – Cosmology: observations – Submillimeter1 Introduction
Understanding the history of the formation of stars and massive black holes during the early stages of galaxy evolution is one of the great challenges in our quest to understand the history of our Universe. Recent COBE, SCUBA, and MAMBO observations of the far-infrared to millimetre extragalactic background show that most of the energy generated in star formation at high redshift is absorbed by dust, which re-emits the energy at far-infrared (far-IR) wavelengths, a spectral range that is red-shifted into transparent submillimetre and millimetre atmospheric windows (e.g., Gispert et al. 2000; Ivison et al. 2000a; Blain 2001; Bertoldi et al. 2000a,b and Carilli et al. 2001a).
In the early stages of formation of galaxies, a large fraction of all stars apparently formed in strong bursts within highly obscured regions. At optical and near-IR wavelengths, much of the star formation activity in such objects remains not directly visible. Thus from the ground, only (sub)millimetre observations provide a comprehensive measure of the energy generated in such objects. Deep blank field surveys at 850 m with SCUBA at the JCMT, and at 1.2 mm with MAMBO at the IRAM 30-m telescope have by now revealed over one hundred faint (2 to 10 mJy) background sources, the majority of which remains invisible in deep optical and near-IR images. This makes conventional, spectroscopic redshift determinations of this population mostly impossible.
Global estimates, based on photometric redshifts in the visible/IR (e.g., Ivison et al. 2000a; Smail et al. 2001) or (sub)millimetre/radio (Carilli & Yun 1999), on the far-IR/submillimetre background intensity and on theoretical modelling (Dole et al. 2000 and references therein), show that the peak of star formation in the Early Universe probably occured in the range , if we assume that much of the far-IR luminosity arises from star formation. It is unclear though, to what extent nucleus activity contributes to the luminosity of high-redshift starburst galaxies, and thereby to the far-IR background. The two brightest objects found in SCUBA and MAMBO blank field surveys (Knudsen et al. 2001; Bertoldi et al. 2000b) are in fact quasars, and two of the three SCUBA sources for which optical emission lines were detected show AGN signatures (Lilly et al. 1999; Smail et al. 1999; Ivison et al. 2000a)
To understand the relation between the formation of black holes, and the formation of galaxies and their bulges, it is necessary to study (aside from the (sub)millimetre background sources) the emission properties of distant objects identified at X-ray, optical, near- and mid-infrared, and radio wavelengths. At very high redshifts (), where no blank field millimetre/submillimetre source has yet been spectroscopically identified, the relation between star formation and AGN is best studied through targeted (sub)millimetre observations of optically selected luminous QSOs and of radio galaxies. It is still unclear to what extent the thermal emission of radio-quiet QSOs is powered by starbursts, or by the black hole accretion. Just as for local ULIRGs and Seyfert galaxies (Genzel et al. 1998), there is increasing evidence that in high-redshift AGN a substantial part of the thermal emission comes from starbursts.
Well before any SCUBA or MAMBO deep imaging surveys, we were able to detect seven powerful high-redshift millimetre sources through targeted observations of ultra-luminous quasars using the 7- and 19-element bolometer arrays at the IRAM 30-metre telescope (McMahon et al. 1994; Omont et al. 1996a) and the JCMT (Isaak et al. 1994). Evidence for the starbust origin of their millimetre emission arose from the determination of their spectral energy distribution, including 850–450 observations at the JCMT (Isaak et al. 1994, McMahon et al. 1999) and 350 m measurements at the CSO (Benford et al. 1999), and from the detection of CO emission in three objects (Ohta at al. 1996; Omont et al. 1996b; Guilloteau et al. 1997, 1999).
We here report on a substantial extension of the surveys for 1.2 mm continuum emission from ultra-luminous quasars with 18 detections, which multiplies by three the number of detections. Results of 850 m observations of a part of the present sample are presented in Isaak et al. (2001).
2 Observations and Results
The observations were made in February and March 2000 with the 30-metre IRAM telescope at Pico Veleta (Spain), using the Max-Planck Millimetre Bolometer (MAMBO; Kreysa et al. 1999). MAMBO is a 37-element bolometer array operating at 300 mK. It is sensitive between 190 and 315 GHz, with half-power sensitivity limits at 210 and 290 GHz, and an effective bandwidth center for steep spectra at 250 GHz. The bolometer feed horns are matched to the telescope FHWM beam at 1.2 mm of , and they are arranged in an hexagonal pattern with a beam separation of 22′′. The sources were observed with the array’s central channel, using the standard on-off observing mode with the telescope secondary chopping in azimuth by 50′′ at a rate of 2 Hz. The pointing was monitored regularly on nearby sources and was found to be stable typically within . Gain calibration was performed using observations of the planets Mars and Uranus as well as the asteroid Ceres. A calibration factor of 12500 counts per Jansky is adopted, which we estimate to be accurate to within 20%. The data were reduced using the MOPSI software package (Zylka 1998). The point-source sensitivity of MAMBO at 1.2 mm is 20 to 40 mJy, depending on weather conditions and the effectiveness of sky-noise subtraction. In order to remove the strong sky signal from the underlying source signal, we subtract from each channel the weighted, average correlated signal from its surrounding channels. Subtracting correlated noise has shown to effectively reduce the sky-noise by typical factors of 2 to 3. Because the channels are separated on the array by two beams, point sources do not produce correlated signals between neighboring channels. Since the source signal is not affected by the sky-noise subtraction (which is confirmed by extensive tests), the error on the final source signal is given by the remaining noise level of the source channel. Systematic errors however are introduced by bad pointing, focus, and gain variations that lead to uncertainties in the flux calibration. We have eliminated observations where we judge such errors to be significantly larger than the errors due to the normal system- and sky-noise. The remaining flux calibration uncertainty are of order 10%.
| Source | † | R.A. | Dec. | Flux Density | Quality‡ | Time | Comments♯ | |
|---|---|---|---|---|---|---|---|---|
| (J2000.0) | (mJy, ) | (sec) | ||||||
| PSS J0209+0517 | 4.18 | 28.1 | 02 09 44.7 | 05 17 13.3 | 3.30.6 | A | 2240 | |
| PSS J04390207 | 4.40 | 27.5 | 04 39 23.1 | 02 07 01.7 | 2.30.7 | A | 1940 | RL3 |
| PSS J0808+5215 | 4.44 | 28.7 | 08 08 49.4 | 52 15 15.2 | 6.60.6 | A | 1420 | RQ2 smm |
| PSS J1048+4407 | 4.40 | 27.4 | 10 48 46.6 | 44 07 12.7 | 4.60.4 | A | 3100 | (b) (c) W As Comp smm |
| PSS J1057+4555 | 4.12 | 28.8 | 10 57 56.3 | 45 55 53.3 | 4.90.7 | A | 1930 | (c) W As Comp smm |
| BR B11171329 | 3.96 | 28.2 | 11 20 10.2 | 13 46 26.2 | 4.10.7 | A | 1420 | (a) (b) BAL smm1 |
| BR B11440723 | 4.15 | 27.7 | 11 46 35.6 | 07 40 05.5 | 6.00.7 | A | 2000 | (a) (b) BAL smm1 |
| PSS J1226+0950 | 4.34 | 27.4 | 12 26 23.8 | 09 50 04.7 | 2.80.7 | A | 1410 | |
| PSS J1248+3110 | 4.35 | 27.6 | 12 48 20.2 | 31 10 44.3 | 6.30.8 | A | 2050 | RQ1 smm |
| PSS J1253-0228 | 4.00 | 27.2 | 12 53 36.4 | 02 28 08.3 | 5.50.8 | A | 1290 | RQ1 Comp |
| PSS J1317+3531 | 4.36 | 27.5 | 13 17 43.1 | 35 31 32.3 | 3.71.1 | B | 1160 | RQ1 RQ2 W As |
| PSS J1347+4956 | 4.56 | 28.3 | 13 47 43.3 | 49 56 21.3 | 5.70.7 | A | 1650 | |
| PSS J1403+4126 | 3.85 | 26.8 | 14 03 55.7 | 41 26 16.2 | 1.50.5 | A | 2300 | |
| PSS J1418+4449 | 4.32 | 28.6 | 14 18 31.7 | 44 49 37.6 | 6.30.7 | A | 1290 | RQ1 smm |
| PSS J1535+2943 | 3.99 | 27.1 | 15 35 53.9 | 29 43 13.0 | 1.90.6 | A | 1410 | |
| PSS J1554+1835 | 3.99 | 26.6 | 15 54 09.9 | 18 35 51.0 | 6.71.1 | A | 1170 | RQ1 |
| PSS J1555+2003 | 4.22 | 27.4 | 15 55 02.6 | 20 03 24.4 | 3.10.6 | A | 1410 | |
| PSS J1646+5514 | 4.10 | 28.7 | 16 46 56.5 | 55 14 46.0 | 4.61.5 | B | 380 | RQ2 smm |
| PSS J1745+6846 | 4.13 | 27.0 | 17 45 50.4 | 68 46 20.5 | 2.50.7 | B | 1530 | |
| PSS J1802+5616 | 4.18 | 26.9 | 18 02 48.8 | 56 16 49.6 | 2.80.9 | A | 1540 | |
| PSS J2322+1944 | 4.11 | 28.1 | 23 22 07.2 | 19 44 23.0 | 9.60.5 | A | 1930 | RQ1 smm |
Notes: Redshifts and coordinates of observed positions for the PSS quasars are from G. Djorgovski’s web page (see text). Redshifts and coordinates for the APM BRI quasars are from Storrie-Lombardi et al. (1996). Note that new astrometry has led to a redetermination of the position of PSS J1057+4555, which is now listed as 10 57 56.39, +45 55 51.97. For PSS J1048+4407, Isaak et al. (2001) point out that the correct position is 10 48 46.64 +44 07 10.9.
† Absolute B-band magnitudes have been calculated as described in Isaak et al. (2001), for Mpc-1 and =0.5.
‡ Quality of the observations: A is good and B is poor.
♯ (a) Omont et al. (1996a) (b) Guilloteau et al. (1999) (c) see text for radio properties. RQ=radio-quiet, RL=radio-loud: the subscripts 1, 2 and 3 refer to Carilli et al. (2001b), Stern et al. (2000) and Isaak et al. (2001), respectively; BAL=Broad Absorption Lines; W=Weak (and broad) emission lines; As=Associated absorption system; Comp=companion(s); smm and smm1 refer to 850 m detections reported by Isaak et al. (2001) and McMahon et al. (1999), respectively.
Most of our sources were observed several times on different dates, and we were able to check for consistency in the resulting fluxes. We noticed that several observing periods yielded source fluxes which were altogether inconsistent with observations of the same objects on other dates. We suspect that during such periods, either the telescope pointing, optics, or an unstable atmosphere lead to a significant sensitivity loss, and we therefore ignored observations during such suspect periods. For a reliable flux determination, a source should be observed at least on two different dates and yield consistent results, or a reliable, nearby flux calibrator should have been observed along with the source. These considerations were used to define a quality factor which we list with the fluxes in Table 1.
The high-redshift quasars were selected from the multicolor Palomar Digital Sky Survey (DPOSS: Kennefick et al. 1995a and b; Djorgovski et al. 1999), that were available at the time from G. Djorgovski’s web page:
http://astro.caltech.edu/ george/z4.qsos
In order to study the most luminous objects, we arbitrarily limited the observations to sources brighter than with a few exceptions. Altogether, 62 PSS sources were observed out of the 90 PSS quasars listed by G. Djorgovski at the time.
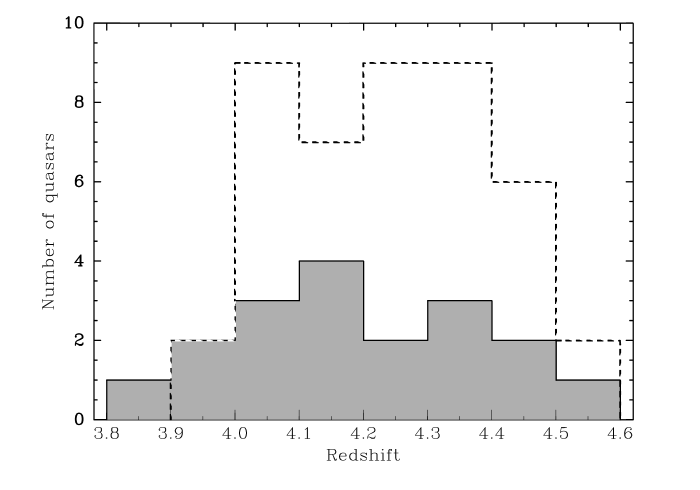
Eighteen new sources were detected at levels , of which 12 sources were detected at levels , as outlined in Table 1. Figure 1 shows that their redshifts are uniformly distributed between and 4.5. Figure 2 displays the observed 1.2 mm flux density versus , the optical absolute magnitude in the B rest-frame band, which represents well the bolometric magnitude, (Sec. 3.6). It shows that there is no strong correlation between and .

Nine of the quasars are detected with a 1.2 mm flux density . PSS J2322+1944, with a flux density of 9.60.6 mJy, is the strongest millimetre source at just after BR12020725, which has a 1.2 mm flux density of 18.52 mJy (derived from Guilloteau et al. 1999). Both sources are exceptional and are indeed brighter than any other high-redshift source known, except the most strongly lensed sources, H1413+117 (Cloverleaf), FIRAS10214+4724 and APM08279+5255 (however, see also the case of BRI B13350417, Guilloteau et al. 1999).
| Source | † | R.A. | Dec. | Flux Density | Quality ‡ | Time | Comments | |
|---|---|---|---|---|---|---|---|---|
| (J2000.0) | (mJy, ) | (sec) | ||||||
| PSS J0014+3032 | 4.40 | 28.1 | 00 14 43.0 | 30 32 03.3 | B | 780 | ||
| PSS J0121+0347 | 4.13 | 27.6 | 01 21 26.1 | 03 47 07.2 | B | 780 | RL2, RL3 | |
| PSS J0121+3453 | 4.22 | 27.6 | 01 21 11.5 | 34 53 00.0 | B | 780 | ||
| PSS J0131+0633 | 4.43 | 27.8 | 01 31 12.2 | 06 33 40.0 | B | 780 | ||
| PSS J0134+3307 | 4.52 | 27.4 | 01 34 21.5 | 33 07 55.4 | A | 780 | RQ2 | |
| PSS J0211+1107 | 3.99 | 27.1 | 02 11 20.1 | 11 07 16.0 | A | 1420 | RL3 | |
| PSS J0452+0355 | 4.38 | 27.6 | 04 52 51.5 | 03 55 57.0 | A | 1300 | smm | |
| PSS J0747+4434 | 4.42 | 28.5 | 07 47 49.7 | 44 34 16.0 | A | 780 | RQ2 | |
| PSS J0852+5045 | 4.20 | 28.2 | 08 52 27.3 | 50 45 10.9 | A | 1300 | ||
| PSS J0926+3055 | 4.19 | 29.5 | 09 26 36.3 | 30 55 04.9 | A | 2330 | ||
| PSS J0950+5801 | 3.97 | 28.3 | 09 50 13.9 | 58 01 38.0 | A | 780 | ||
| PSS J0955+5940 | 4.34 | 28.9 | 09 55 11.3 | 59 40 30.5 | A | 900 | ||
| PSS J0957+3308 | 4.25 | 28.3 | 09 57 44.5 | 33 08 20.4 | B | 640 | ||
| PSS J1026+3828 | 4.18 | 27.8 | 10 26 56.7 | 38 28 44.9 | B | 900 | ||
| PSS J1058+1245 | 4.33 | 28.8 | 10 58 58.4 | 12 45 54.8 | B | 1290 | ||
| PSS J1159+1337 | 4.08 | 28.8 | 11 59 06.6 | 13 37 37.6 | B | 1380 | RQ2 | |
| PSS J1315+2924 | 4.18 | 27.4 | 13 15 39.8 | 29 24 39.1 | A | 900 | ||
| PSS J1326+0743 | 4.17 | 28.4 | 13 26 11.8 | 07 43 57.5 | A | 1800 | ||
| PSS J1339+5154 | 4.08 | 27.2 | 13 39 13.0 | 51 54 03.8 | B | 1540 | ||
| PSS J1401+4111 | 4.01 | 27.9 | 14 01 32.8 | 41 11 50.9 | B | 520 | ||
| PSS J1430+2828 | 4.30 | 27.1 | 14 30 31.6 | 28 28 34.3 | B | 650 | ||
| PSS J1432+3940 | 4.28 | 28.2 | 14 32 24.8 | 39 40 24.4 | A | 1420 | ||
| PSS J1435+3057 | 4.35 | 28.5 | 14 35 23.5 | 30 57 22.1 | A | 390 | RQ2 W | |
| PSS J1443+2724 | 4.42 | 27.3 | 14 43 31.2 | 27 24 36.9 | A | 2190 | RQ2 | |
| PSS J1443+5856 | 4.27 | 28.5 | 14 43 40.7 | 58 56 53.3 | B | 2320 | ||
| PSS J1500+5829 | 4.22 | 27.8 | 15 00 07.7 | 58 29 37.7 | A | 640 | ||
| PSS J1506+5220 | 4.18 | 27.7 | 15 06 54.6 | 52 20 04.6 | A | 780 | ||
| PSS J1531+4517 | 4.20 | 27.4 | 15 31 29.9 | 45 17 07.9 | B | 1940 | ||
| PSS J1543+3417 | 4.39 | 29.4 | 15 43 40.4 | 34 17 44.5 | A | 1290 | ||
| PSS J1615+1803 | 4.01 | 27.6 | 16 15 22.9 | 18 03 56.0 | A | 1420 | ||
| PSS J1618+4125 | 4.21 | 27.4 | 16 18 22.7 | 41 25 59.7 | B | 500 | RQ2 | |
| PSS J1633+1411 | 4.35 | 27.8 | 16 33 19.6 | 14 11 42.3 | B | 640 | ||
| PSS J1721+3256 | 4.03 | 27.1 | 17 21 06.7 | 32 56 35.9 | A | 1160 | RQ2 Comp | |
| PSS J2134+0817 | 4.** | 27.1 | 21 34 43.2 | 08 17 28.6 | A | 780 | ||
| PSS J2154+0335 | 4.46 | 27.5 | 21 54 06.7 | 03 35 39.2 | A | 1530 | ||
| PSS J2155+1358 | 4.26 | 28.1 | 21 55 02.2 | 13 58 25.5 | B | 910 | ||
| PSS J2203+1824 | 4.38 | 28.7 | 22 03 43.4 | 18 28 13.1 | B | 780 | ||
| PSS J2238+2603 | 4.03 | 28.9 | 22 38 41.6 | 26 03 45.3 | B | 750 | ||
| PSS J2241+1352 | 4.46 | 28.0 | 22 41 47.8 | 13 52 02.0 | A | 510 | ||
| PSS J2244+1005 | 4.04 | 26.9 | 22 44 05.4 | 10 47 38.6 | A | 520 | ||
| PSS J2256+3230 | 4.04 | 26.0 | 22 56 10.4 | 32 30 18.5 | B | 780 | RL3 | |
| PSS J2315+0921 | 4.52 | 28.1 | 23 15 59.1 | 09 21 43.6 | B | 910 | ||
| PSS J2323+2758 | 4.18 | 27.3 | 23 23 40.9 | 27 58 00.4 | A | 780 | ||
| PSS J2344+0342 | 4.30 | 28.1 | 23 44 03.2 | 03 42 26.4 | A | 1540 | ||
Note: Same notations as in Table 1.
In addition, three quasars (PSS J1048+4407, BR B11171329 and BR B11440723) which were previously detected at the 30-metre telescope, but were not detected at similar levels in observations with the Plateau de Bure interferometer (Omont et al. 1996a, Guilloteau et al. 1999 Table 2), were remeasured. Their new 1.2 mm flux densities are between 4 and 5 mJy (Table 1), confirming the previous 30-metre data (, , and , respectively, at 1.25 mm). These values are also compatible with the 850 m flux densities measured with SCUBA at the JCMT: for PSS J1048+4407 (Isaak et al. 2001), and for BR B11171329 and BR B11440723, respectively (McMahon et al. 1999). This consistent set of data makes the flux densities measured at 1.2 mm and 850 m with single dishes very robust for the three sources. For BR B11440723 a new measurement at 850 m with a better sensitivity would be desirable. As a consistency check, this source was remeasured in February 2001 with the 30-metre telescope at 1.2 mm yielding a result which is perfectly consistent with the measurements done in 2000. The value of the flux density listed in Table 1 includes this recent measurement.
Interestingly, all these single-dish measurements (except at 850 m for BR B1144072) are incompatible, for point sources, with the results of the IRAM interferometer measurements at 1.35 mm reported by Guilloteau et al. (1999). If PSS J1048+4407, BR B11171329 and BR B11440723 are unresolved by the interferometer beam (), their 1.35 mm flux densities should be limited to , and , respectively. The most natural explanation of the poor agreement between the single dish and the interferometer would be that the dust millimetre emission of these three sources is extended with respect to the interferometer beam. Such extensions have been reported for other high redshift sources (Omont et al. 1996b; Papadopoulos et al. 2000, 2001; Richards 2000). However, this needs confirmation for PSS J1048+4407, BR B11171329 and BR B11440723.
Forty-four PSS quasars were not 3 detected at 1.2 mm, with typical 3 flux density upper limit of 1.5–4 mJy. Table 2 lists their names, redshifts, and the 1.2 mm flux densities with errors.
We have detected 30% of the 62 new sources observed. Such a detection rate is consistent with previous studies, in particular with that of Omont et al. (1996a) on a three times smaller sample of similar brightness APM BRI survey quasars. It is also consistent with the parallel, deeper MAMBO study of a sample of 41 SDSS quasars (Carilli et al. 2000, 2001a). It should be stressed that such bright quasars with MB are rare, with an average surface density of one per 50-100 deg2 (Storrie–Lombardi et al. 2001). The number of quasars detectable in the (sub)millimetre with flux densities is thus less than one per 100 deg2.
3 Discussion
3.1 The case for thermal dust emission
There is little doubt that, for nearly all the high-redshift quasars detected in the millimetre, this emission is due to dust, and not to synchrotron radiation. This is shown either by their large and positive submillimetre/millimetre spectral index, which is characteristic of dust emission, or by the fact that they are not radio-loud at 1.4 GHz or 5 GHz. Both indicators have well established the dust origin of the millimetre emission of the quasars detected until now at 1.2 mm (Isaak et al. 1994; Benford et al. 1999; McMahon et al. 1999; Carilli et al. 1999; Kawabe et al. 1999; Priddey and McMahon 2001).
The characteristics of the dust emission of previously detected sources have been derived by combining observations made at various (sub)millimetre wavelengths. For instance, by comparing 350 m measurements of six high- quasars with 1.3 mm - 450 flux densities, Benford et al. (1999) showed that most of the dust contributing to the millimetre/submillimetre emission is at a temperature close to 50 K, with a power-law emissivity index =1.50.2. Recently, Priddey & McMahon (2001) compiled an average spectral energy distribution (SED) for the quasars detected by Omont et al. (1996a) and derived and =1.950.3. Note that these data are not exclusive of dust at higher temperature, as seen in H1413+117 (Cloverleaf), F10214+4724 or APM08279+5255, and expected from models (e.g., Andreani et al. 1999). The luminosities which have been derived in previous studies from the SEDs of quasars detected in the millimetre are (see also Eq. 3), slightly greater than the typical luminosity of ultra-luminous infrared galaxies such as Arp 220.
Similarly, radio and submillimetre data begin to be available for a part of the broader PSS sample, especially for the sources that we have detected at 1.2 mm. All results point to dust emission. A very deep radio VLA study of nine PSS QSOs, among the strongest 1.2 mm sources of Table 1, shows that their millimetre emission is most likely thermal dust emission (Carilli et al. 2001b). Six of them are radio-quiet (Table 1). PSS J1057+4555 is shown as a weak radio-loud quasar and PSS J1048+4407 as a weaker one. However, the steep radio spectrum of both sources makes it unlikely that their large 1.2 mm flux densities result from synchrotron emission.
Stern et al. (2000) and Isaak et al. (2001) have also addressed the radio properties of optically selected quasars. From a deep 5 GHz imaging survey, Stern et al. have identified as radio-quiet two of the sources of Table 1 (detected at 1.2 mm) and seven of Table 2 (undetected at 1.2 mm). From a comparison with the shallow NVSS 1.4 GHz survey, Isaak et al. (2001) have identified as radio-loud one source detected at 1.2 mm, PSS J04390207, and three undetected ones (Table 2).
Seven of the 1.2 mm MAMBO PSS detections (marked by ‘smm’ in Table 1) were also detected at 850 by Isaak et al. (2001), indicating 850 /1.2 mm flux ratios which are characteristic of dust emission, in agreement with their radio properties. A detailed discussion of the submillimetre properties of these quasars and parameters inferred from them is left to a later publication (Priddey et al., in preparation).
3.2 Dust mass
In the likely case that the millimetre emission is optically thin, the total mass of dust is directly proportional to the millimetre flux
| (1) |
where is the flux density at 1.2 mm (i.e., 250 GHz), is the rest-frame frequency, is the dust absorption coefficient, is the Planck blackbody function and is the luminosity distance which depends on the cosmological parameters (see, e.g., Eq. (1) in McMahon et al. 1994). Hereafter, we adopt a standard Einstein-de Sitter cosmology with Mpc-1 and =0.5. To convert to a Lambda cosmology with , , and =65 Mpc-1, the masses and luminosities given here should be multiplied by . For the median value of the redshift distribution of Fig. 1, , the rest-frame wavelength is 230 m. Equation (1) can then be rewritten as
| (2) |
where accounts for the temperature dependence. The dust absoption coefficient at 230 m, m) = 7.5 , is the value extrapolated from the value at 125 m of Hildebrand (1983), and a frequency dependence of = 1.5. Using Eq. (2) and , the mass of dust of the sources detected at 1.2 mm (Table 1) is in the range to with a median value of .
Equation (2) is consistent with previous formulae (e.g., Omont et al. 1996a; Rowan-Robinson 2000). However, note that for the above relation is slightly different from Eq. (1) in Omont et al. (1996a) where a dust temperature of 80 K was assumed. For K, the temperature dependence of is roughly .
Note that other temperature dust components may be present. As quoted in Sec. 3.1, in the few quasars for which higher frequency measurements are available, a warm dust component is evident. A significant cold dust component could also be hidden below the spectral energy distribution of the warm dust. In the most extreme case of dust at the CMB temperature at , K, a given flux density at 1.2 mm could arise from five times the amount of dust we would estimate assuming K. More realistically, we estimate that within the flux density uncertainties a hidden cold dust component could still be present with perhaps about twice the mass we estimate ignoring such a cold component.
We should emphasize that the estimates of Md depend on the assumed values of the dust temperature and emissivity. The latter remains highly uncertain, particularly for the unknown properties of dust in luminous quasars. Dust masses are derived by Andreani et al. (1999) in their Table 3 for the sources whose 1.25 mm flux values are reported by Omont et al. (1996a). The origin of such low values of is probably due to the high dust temperature resulting from AGN heating and to the adopted grain model (Granato & Danese 1994; Rowan-Robinson 1986) which has a large emissivity at millimetre wavelengths.
3.3 Dust heating: Starburst or AGN?
As discussed by various authors (Sanders & Mirabel 1996; Andreani et al. 1999; Rowan-Robinson 2000; Yun et al. 2000; Carilli et al. 2000), for ultra luminous infrared galaxies (ULIRGs) it is difficult to disentangle the dust heating contributions from a starburst and from the central AGN, even in the local universe (Genzel et al. 1998; Downes & Solomon 1998; Veilleux et al. 1999), where such objects are bright but rare. Due to the lack of detailed spectral, geometric, and kinematic information, for sources at very high redshifts only indirect arguments can be made in favour of one or the other heating mechanism.
An argument that favours AGN as the dominant heating source is the large power available that could heat the dust even at kpc distances. Simple torus models can account for the observed SED of AGN at small and moderate redshift (Sanders et al. 1989; Granato & Danese 1994; Granato et al. 1996; Andreani et al. 1999). In particular, AGN heating seems required to explain the dust detected at higher temperature in lensed sources such as H1413+117, FIRAS10214+4724 and APM08279+5255, if not due to differential lensing (e.g., Rowan-Robinson 2000 and references therein).
Starbursts as a source of the far-IR luminosity are favoured by the large observed dust masses, , which imply the presence of of gas, much of which may be molecular as indicated by the detection of CO in three quasars (Ohta et al. 1996; Omont et al. 1996b; Guilloteau et al. 1997, 1999). Such gas masses are typical for local ULIRGs (Solomon et al. 1997; Downes & Solomon 1998) and hyper-luminous infrared galaxies (Rowan-Robinson 2000). The high gas masses, the dust temperatures (Benford et al. 1999), and the faint radio emission (Yun et al. 1999; Kawabe et al. 1999; Carilli et al. 2000, 2001b) are consistent with starbursts with star formation rates, , of order . The total far-IR luminosity, , which we take to be the integrated luminosity at rest wavelengths , has been well determined from millimetre to 350 m detections (Benford et al. 1999) for several objects at .
For a modified black-body with and , is related to through - see Eq. (5) in McMahon et al. (1999). Therefore, from Eq. (2)
| (3) |
3.4 Starbursts: Implied star formation rates
Let us consider the case that the far-IR luminosity arises exclusively from starbursts, and that the stellar radiation is completely absorbed and reemitted by warm dust. Then the far-IR luminosity equals the starburst’s total luminosity. In a continuous starburst the star formation rate relates to the far-IR luminosity
| (4) |
where is a function of the mass function (MF), i.e., of the present mass composition of the stellar population. To determine , as an example, we first consider stars forming with a Salpeter initial mass function (IMF), , with a low mass cutoff, . We can adopt the approximate expressions for the stellar luminosities and lifetimes given by Telesco & Gatley (1984). Then for a 100 Myr old continuous starburst, and 3.8, for a low mass cutoff and , respectively, (Fig. 3). These values of are lower by a factor of two from those which are commonly adopted from Thronson & Telesco (1986), which were computed for a continuous starburst of age 2 Myr. Such a short starburst age is certainly inappropriate for the massive starbursts we observe in high-redshift galaxies, which more likely occur on timescales comparable to the dynamical timescale of the starburst regions, yr.
We have alternatively computed using recent stellar evolution models (Schaerer et al. 1993), considering a range of metallicities and IMFs. For starburst ages of 10–100 Myr, and a more realistic flat IMF at low masses ( at , ), ranges between 0.8 and 2 (Fig. 3), well in agreement with previous studies (see, e.g., Kennicutt 1998; Barger et al. 2000; Rowan-Robinson 2000). Whilst the exact value of for the sample discussed in this paper is unknown, it is unlikely that it will deviate much from this range.

In reality, the far-IR luminosity may differ from the starburst’s total luminosity for two main reasons: either part of the stellar radiation is not absorbed by dust and escapes, or part of the dust heating is achieved by the quasar radiation. Let be the ratio between the starburst’s total luminosity and . Note that is just an empirical definition which can depend on several parameters. It follows from Eqs. (3) and (4) that the star formation rate of a continuous starburst relates to the 1.2 mm flux density, ,
| (5) |
3.5 Heavy element production and FIR emission
The dust seen through its far-IR emission was generated by stars that formed during current or past star formation events. The mass of dust may provide an estimate of the minimum amount of heavy elements (i.e., amu) already synthesized, and hence of the energy radiated from nucleosynthesis and of the total star formation. The energy directly generated in the nucleosynthesis of a mass of heavy elements is 0.008 c2. Accounting for the energy released in the formation of helium which is simultaneously synthesized in massive stars, but not transformed in heavy elements, one may estimate that the radiative energy, , emitted by the stars which release a mass, , of heavy elements into the interstellar medium, is of the order of
| (6) |
(see Harwit 1999). From Eqs. (4) and (6), the factor of proportionality betwen the total mass of formed stars and of released heavy elements is
| (7) |
The mass of heavy elements ever released in a galaxy must be larger than the mass of dust we can observe through its FIR emission. We introduce
| (8) |
as the ratio between the total mass of released heavy elements and the visible dust mass. This ratio accounts for heavy elements in the gas phase and in the intergalactic medium, or reprocessed in new stars, and for cold dust. In the local interstellar medium, the mass fraction of heavy elements locked in dust grains is 40%, when adopting a total abundance of heavy elements 2/3 solar (Meyer et al. 1998) and a gas-to-dust ratio 190 (Allen 1999, Table 7.12). This fraction is unknown in local starburst galaxies, but there are no indications that it is very different, and the presence of a consistent amount of gas phase oxygen and carbon at least is attested through the detection of CO. Adopting the Galactic dust fraction of heavy elements, we speculate that in high-redshift starbursts, , but that this value is uncertain by a factor of two in either direction.
Some of the heavy elements produced in a starburst may be blown into the intergalactic medium or scattered throughout the galaxy to regions far from radiative energy sources. The dust in this component may not be heated sufficiently to contribute noticably to the integrated far-IR emission. The intergalactic ejection of enriched gas is expected to be particularly significant in extreme starbursts such as those we might be observing in the high-redshift quasars, and could well be significant in the observed enrichment of the intergalactic medium of galaxy clusters. The fraction of metal to observed dust may thus be significantly larger than the quoted value of 2.5. In conclusion, it is difficult to estimate a more precise value for , which probably ranges between 1 and 10.
If the radiative energy that is emitted along with the generation of heavy elements in a galaxy is released over a timescale , the average total luminosity of the stars during that time would be
| (9) | |||||
using Eqs. (6), (8) and (2). Would this energy be steadily emitted from the Big Bang to , i.e., over a time of Gyr, then the average luminosity would be similar to that of local ULIRGs, which is bright, but below the detection limit of (sub)millimetre observations. It appears unlikely that such a high rate of star formation has been maintained for a Hubble time (however, see Isaak et al. 2001). More likely, vigorous star formation started at a later time, in a series of short duration bursts, during which the mass of the heavy elements implied by the dust emission was produced.
One-third of the PSS quasars studied in this paper have . If most of this luminosity comes from a starburst, Eq. (9) shows that its duration cannot much exceed . This is the typical duration of starbursts in local ULIRGs. The duration of the peak luminosity of the bright quasars is close to the Eddington-Salpeter time, (e.g., Rees 1984). It is likely that most of this peak-luminosity phase of the PSS quasars that we observed, took place in the studied redshift range 4–4.5 (which spans a total time ), since few similar objects are known at . Because about one third of the PSS quasars were detected at 1.2 mm, the duration of their starburst phase cannot be much shorter than 15 Myr. It could well exceed this value if similar starbursts extended over the period when the quasar are less luminous, as possibly supported by the high detection rate of the low luminosity part of our sample (Fig. 2).
In summary, starbursts in high redshift quasars can consistently account for the far-IR luminosity, the observed dust content, and the fraction of quasars which are bright at far-infrared wavelengths. However, we can not exclude the possibility that the observed far-IR luminosity is due to AGN heating, and that the dust was generated in weaker (below our detection limit) and longer (to generate the required dust mass) past starburst events.
3.6 Star formation and black hole growth
Massive black holes are now recognized as a normal, perhaps ubiquitous, component of elliptical galaxies and spiral galaxy bulges. There is increasing evidence that the growth of central supermassive black holes and the formation of the first stellar populations are closely linked (see, e.g., Combes 2001, and Haehnelt & Kauffmann 2000 and references therein). Therefore the presence of strong starbursts in luminous high-redshift quasars would not be surprising.
In nearby galaxies, there is good evidence for a correlation between the black hole mass, , and the bulge mass, , with
| (10) |
(Magorrian et al. 1998; Kormendy & Richstone 1995; Gebhardt et al. 2000 and references therein). Although the average value of this ratio is close to 500, it appears (see Laor 2001) that it is lower for the most massive local black holes.
The PSS quasars we observed are extremely luminous, with a typical blue magnitude (Table 1). Adopting the blue luminosity bolometric correction factor of derived for the PG sample by Elvis et al. (1994), the typical bolometric luminosity of the quasars is . Only a fraction, , of the mass equivalent energy accreted onto the black hole is radiated, so that the rate of growth of a black hole relates to its luminosity
| (11) |
The ratio between the star formation rate and the black hole growth rate is thus
| (12) |
where we used Eqs. (4), (5) and (11). The FIR to bolometric luminosity ratio of the millimetre-detected PSS quasars ranges between 0.04 and 0.2, with an average value of 0.1, whereas the average ratio over the whole sample is . The rate at which stars form in the PSS quasars is therefore more than a factor ten lower than expected if stars and black holes formed simultaneously with the same ratio of bulge to black hole mass, as observed in local galaxies.
The fact that the far-IR luminosity in the sample does not appear to correlate with the blue luminosity (Fig. 2), indicates that the instantaneous rates of bulge star formation and of black hole growth are not directly related, and that the rate ratio of Eq. (12) may vary in time. However, there is a similar relation between the global masses . The mass of a black hole radiating near the Eddington limit is (e.g. Rees 1984)
| (13) |
Since the bulge mass can be related to the mass of heavy elements released (Eq. 7), thus to the dust mass emitting the observed far-IR radiation (Eq. 8), which is proportional to the millimetre flux detected (Eq. 2), we find that
| (14) |
which is independent of the time scale of star formation and of the source of dust heating. Despite the uncertainty on and , this ratio is again an order of magnitude smaller on average than the local observed ratio / 160 (Eq. 10).
The bulge to black hole mass ratio which is implied for the present sample of PSS quasars thus supports the idea that supermassive black holes grow relatively faster at early epochs than their surrounding host galaxies. This has also been suggested by observations of host galaxies of lensed quasars at high (Rix et al. 1999) and by modelling (Kauffmann & Haehnelt 2000).
The relatively faster black-hole growth compared to the bulge growth at could be in part due to the special conditions of the primordial gas infall into the central potential wells of very young galaxies and to the larger proportion of gas in mergings at than at later epochs (e.g., Haehnelt & Rees 1993 and Rees 1998).
Such effects could be enhanced in the PSS quasars which have bolometric luminosities much higher than those of the average quasar population. The high-redshift PSS quasars were selected by their optical brightness, so only the most luminous objects were discovered, which are not representative of the median 4 quasar population (Fan et al. 2001), nor, a fortiori, of the median population (Boyle et al. 2000). The PSS quasars could thus be unusual objects which at later times have more massive black holes than typical quasars with comparable bulge mass, or they later accrete a larger stellar bulge mass without much growth of the black hole.
3.7 Relation with other quasar properties
There is as yet very little information published about the PSS quasars listed in Tables 1 and 2, in particular about their spectra, their environment and possible lensing. The information from the few published spectra (Kennefick et al. 1995a,b) is given in Tables 1 and 2. This information is too limited to allow us to confirm that broad absorption lines (BAL) or/and broad and weak emission lines indicate strong millimetre emission (Omont et al. 1996a). Djorgovski (1998, 1999) have observed the surroundings of about twenty such quasars and found companion galaxies in almost every case. Specific information is only given for a few sources (as indicated in Tables 1 and 2). These findings give further support to the general arguments that quasars at may form at the very highest peaks of the primordial density field, in the cores of future giant ellipticals (Djorgovski 1998). The presence of associated absorption systems points in the same direction, but we still lack conclusive information on this issue. Indications that the quasars detected at 1.2 mm have a rich environment could be related to recent results on high- radio galaxies showing spatially distributed dust and CO emission (Ivison et al. 2000b; Papadapoulos et al. 2000), to the discovery of clusters of Ly emission sources (Pentericci et al. 2000) and, if it is not due to lensing, to the double peak observed in the 1.2 mm dust continuum of BR B12020725 (Omont et al. 1996b).
4 Conclusion
The availability of ever more sensitive bolometer detectors and of vast optical surveys have lead to the discovery of thermal emission from tens of radio-quiet quasars. (Sub)millimetre astronomy is thus entering an era of statistical analysis of star formation in high- ultra-luminous quasars. The detection of warm dust with masses and far-infrared luminosities of suggests substantial star formation activity that could be associated with a large initial collapse or with major merging. Millimetre and submillimetre observations thus provide unique information with which to study the parallel growths of bulges and central black holes at very large redshift. The exceptional objects we discussed may trace the very highest peaks of the primordial density field, in the cores of proto-clusters and of future giant ellipticals.
An important question still to be addressed is how the millimetre emission of bright quasars at compares to that of quasars in the redshift range , at which the quasar activity peaks. In earlier studies (Omont et al. 1996a; Guilloteau et al. 1999) only a few detections were achieved in this redshift range.
Acknowledgements: We thank G. Djorgovski and the DPOSS QSO search team for making available a list of PSS quasars on the web. We also wish to thank R. Priddey for having provided the compilation of values, and G. Lagache and A. Beelen for useful discussions. We are most grateful to E. Kreysa and the MPIfR bolometer group for providing MAMBO, to R. Zylka for creating the MOPSI data reduction package, and to the IRAM staff for their support. This work was carried out in the context of EARA, a European Association for Research in Astronomy. The National Radio Astronomy Observatory (NRAO) is a facility of the National Science Foundation, operated under cooperative agreement by Associated Universities, Inc.
References
- (1) Allen, C.W. 1999, Astrophysical Quantities, 4th edition, Springer
- (2) Andreani, P., Franceschini, A., & Granato, G. 1999, MNRAS, 306, 161
- (3) Barger, A.J., Cowie, L.L., Richards E.A. 2000, ApJ 119, 2092
- (4) Benford, D.J., Cox, P., Omont, A., Phillips, T.G., & McMahon, R.G. 1999 ApJ 518, L65
- (5) Blain A.W. 2001, in Deep millimeter surveys. Implications for galaxy formation and evolution, J.D. Lowenthal & D. Hughes (eds.), World scientific (astro-ph/0009012)
- (6) Bertoldi, F., Carilli, C.L., Menten, K.M. et al. 2000a, A&A 360, 92
- (7) Bertoldi, F., Menten, K.M., Kreysa, E., Carilli, C.L., & Owen, F. 2000b, in Cold Gas and Dust at High Redshift Highlights in Astronomy, Vol. 12, D.J. Wilner (ed.)
- (8) Boyle, B.J., Shanks, T., Croom, S.M. et al. 2000, MNRAS, 317, 1014
- (9) Carilli, C. L. & Yun, M. S. 1999, ApJ 513, L13
- (10) Carilli, C. L., Menten, K.M. & Yun, M. S. 1999, ApJ 521, L25
- (11) Carilli, C. L. & Yun, M. S. 2000, ApJ 539, 1024
- (12) Carilli, C.L., Bertoldi F., Menten K.M., et al. 2000, ApJ 533, L13
- (13) Carilli, C.L., Bertoldi F., Bertarini A., et al. 2001a, in Deep millimeter surveys. Implications for galaxy formation and evolution, J.D. Lowenthal & D. Hughes (eds), World scientific (astro-ph/0009298)
- (14) Carilli, C.L., Bertoldi F., Omont, A., Cox, P., McMahon, R.G., Isaak, K. 2001b, in preparation
- (15) Combes, F., 2001, in Advanced Lectures on the Starburst-AGN Connection, D. Kunth & I. Aretxaga (eds.), World scientific (astro-ph/0010567)
- (16) Djorgovski, S. G. 1998, in Fundamental Parameters in Cosmology, proc. XXXIII Recontres de Moriond, Y. Giraud-Héraud et al. (eds.), Editions Frontières, p.313
- (17) Djorgovski, S. G. 1999, in The Hy-Redshift Universe: Galaxy Formation and Evolution at High Redshift, ASP Conference Proceedings, Vol. 193, A.J. Bunker & W. J. M. van Breugel (eds.), p.397
- (18) Djorgovski, S. G., Gal, R.R., Odewahn, S.C. et al. 1999 in Wide Field Surveys in Cosmology, S. Colombi & Y. Mellier (eds.), Editions Frontières, p.89
- (19) Dole H., Gispert, R., Lagache, G. et al. 2000 in ISO Surveys of a Dusty Universe Springer Lecture Notes of Physics, eds. D. Lemke, M. Stickel, K. Wilke (eds), (astro-ph/0002283)
- (20) Downes, D. & Solomon, P. 1998, ApJ, 507, 615
- (21) Elvis, M., Wilkes, B.J., McDowell,J.C. et al. 1994, ApJS, 95, 1
- (22) Fan, X., Strauss, M.A., Schneider, D.P. et al. 2001, AJ 121, 54
- (23) Gebhardt, K., Bender, R., Dressler, A., et al. 2000, ApJ 543, L5
- (24) Genzel, R., Lutz, D., Sturm, E. et al. 1998, ApJ 498, 579
- (25) Gispert, R., Lagache, G., & Puget, J.-L. 2000, A&A, 360, 1
- (26) Granato, G.L. & Danese, L. 1994, MNRAS 268, 235
- (27) Granato, G.L., Danese,L. & Franceschini, A. 1996, ApJ, 486, 147
- (28) Guilloteau, S., Omont, A., McMahon, R.G, Cox, P., & Petitjean, P. 1997, A&A, 328, L1
- (29) Guilloteau, S., Omont, A., Cox, P., McMahon, R.G., & Petitjean, P. 1999, A&A, 349, 363
- (30) Haehnelt, M.G. & Rees, M.J. 1993, MNRAS 263, 168
- (31) Haehnelt, M.G. & Kauffmann, G. 2000, MNRAS 318, L35
- (32) Harwit, M. 1999, ApJ, 510, L83
- (33) Hildebrand, R.H. 1983, QJRAS 24, 267
- (34) Isaak, K.G., McMahon, R.G., Hills, R.E., & Withington, S. 1994, MNRAS, 269, L28
- (35) Isaak, K.G., Priddey, R.S., McMahon, R.G., Omont, A., Peroux, C., Sharp R.G., & Withington, S. 2001, submitted to MNRAS
- (36) Ivison, R.J., Smail, I., Barger, A.J., et al. 2000a, MNRAS 315, 209
- (37) Ivison, R.J., Dunlop, J.S., Smail, A.I., et al. 2000b, ApJ 542, 27
- (38) Kauffmann, G. & Haehnelt, M. 2000, MNRAS, 311, 576
- (39) Kawabe, R., Kohno, K., Ohta, K., Carilli, C. 1999, in ASP Conf. Ser.156, in Highly Redshifted Radio Lines C.M. Carilli, S.J.E. Radford, K.M. Menten & G.I. Langston (eds), ASP, p.48
- (40) Kennefick, J. D., De Carvalho, R. R., Djorgovski, S. G et al. 1995a, AJ, 110, 78
- (41) Kennefick, J.D., Djorgovski, S.G., & Calvalho, R.R. 1995b, AJ 110, 2553
- (42) Kennicutt, R.C. Jr 1998, ARAA 36, 189
- (43) Knudsen, K.K., van der Werf, P.P., Jaffe W. 2001, in Deep millimeter surveys. Implications for galaxy formation and evolution, J.D. Lowenthal & D. Hughes (eds.), World scientific (astro-ph/0009024)
- (44) Kormendy, J. & Richstone, D. 1995, ARAA 33, 581
- (45) Kreysa, E. et al. 1999, SPIE, 3357, 319
- (46) Laor, A. 2001, ApJ 553, 677
- (47) Lilly, S.J., Eales, S.A., Gear, W.K. al. 1999, ApJ, 518, 641
- (48) Magorrian, J., Tremaine, S., Richstone, D., et al. 1998, AJ 115, 2285
- (49) McMahon, R.G, Omont, A., Bergeron, J., Kreysa, E., & Haslam, C.G.T. 1994, MNRAS, 267, L9
- (50) McMahon, R.G., Priddey, R.S., Omont, A., Snellen, I. & Withington, S. 1999, MNRAS 309, L1,
- (51) Meyer, D.M., Jura, M. & Cardelli, J.A. 1997, ApJ 493, 222
- (52) Ohta, K., Yamada, T., Nakanishi, K., et al. 1996, Nature, 382, 426
- (53) Omont, A., McMahon, R.G, Cox, P., et al. 1996a, A&A, 315, 1
- (54) Omont, A., Petitjean, P., Guilloteau, S. et al. 1996b, Nature, 382, 428
- (55) Papadopoulos, P.P., Rottgering, H.J.A., van der Werf, P.P. et al. 2000, ApJ, 528, 626
- (56) Papadopoulos, P.P., Ivison, R.J., Carilli, C.L., & Lewis, G. 2001, Nature, 409, 58
- (57) Pentericci, L., Kurk, J.D., Röttgering, H.J.A., et al. 2000, A&A 361, L25
- (58) Priddey, R.S., & McMahon, R.G. 2001, submitted to MNRAS (astro-ph/0102116)
- (59) Rees, M.J. 1984, ARA&A, 22, 471
- (60) Rees, M.J. 1998, in Black Holes and Relativistic Stars, R. M. Wald. (ed.), University of Chicago Press, p.79
- (61) Richards, E. 2000, ApJ 533, 611
- (62) Rix H.-W., Falco E., Impey C., & al. 1999, in Gravitational Lensing: Recent Progress and Future Goals, T. Brainerd and C. Kochanek (eds.) (astro-ph/9910190)
- (63) Rowan-Robinson, M. 1986, MNRAS, 219, 737
- (64) Rowan-Robinson, M. 2000, MNRAS, 316, 885
- (65) Sanders, D.B. & Mirabel, I.F. 1996, ARAA, 34, 749
- (66) Sanders, D.B., Phinney, E.S., Neugebauer, G., et al. 1989, ApJ, 347, 29
- (67) Schaerer, D., Meynet, G., Maeder, A., Schaller, G. 1993, A&AS 98, 523
- (68) Smail, I., Ivison, R.J., Kneib, J.P. et al. 1999, MNRAS, 308, 1061
- (69) Smail I., Ivison R.J., Blain A., Kneib, J.P. 2001, in Deep millimeter surveys. Implications for galaxy formation and evolution, J.D. Lowenthal & D. Hughes (eds.), World scientific (astro-ph/0008237)
- (70) Solomon P.M., Downes D., Radford S.J.E., Barrett J.W. 1997, ApJ 478, 144
- (71) Stern, D., Djorgovski, S.G., Perley, R.A., de Carvallho, R.R., Wall, J.V. 2000, AJ, 119, 152
- (72) Storrie-Lombardi, L.J., Irwin, M.J., McMahon, R.G., Irwin, M.J., & Hazard, C. 1996, ApJ 468, 121
- (73) Storrie-Lombardi, L.J., Irwin, M.J., McMahon, R.G., Hook, I.M. 2001, MNRAS 322, 933
- (74) Thronson, H., & Telesco, C.M. 1986, ApJ 311, 98
- (75) Telesco, C.M. & Gatley, I. 1984, ApJ, 284, 557
- (76) Veilleux S., Kim D.C., Sanders D.B., 1999, ApJ 522, 113 & 139
- (77) Yun, M.S., Carilli, C.L., Kawabe, R., et al. 2000, ApJ 528, 171
- (78) Zylka, R. 1998, MOPSI Users Manual, (IRAM: Grenoble)