Chandra detection of X-ray Absorption Associated with a Damped Ly System
Abstract
We have observed three quasars, PKS 1127-145, Q 1331+171 and Q 0054+144, with the ACIS-S aboard the Chandra X-ray Observatory, in order to measure soft X-ray absorption associated with intervening 21-cm and damped Ly absorbers. For PKS 1127-145, we detect absorption which, if associated with an intervening =0.312 absorber, implies a metallicity of 23 solar. If the absorption is not at =0.312, then the metallicity is still constrained to be less than 23 solar. The advantage of the X-ray measurement is that the derived metallicity is insensitive to ionization, inclusion of an atom in a molecule, or depletion onto grains. The X-ray absorption is mostly due to oxygen, and is consistent with the oxygen abundance of 30 solar derived from optical nebular emission lines in a foreground galaxy at the redshift of the absorber. For Q 1331+171 and Q 0054+144, only upper limits were obtained, although the exposure times were intentionally short, since for these two objects we were interested primarily in measuring flux levels to plan for future observations. The imaging results are presented in a companion paper.
1 Introduction
The optical-ultraviolet spectra of quasars show narrow absorption lines from a range of heavy elements which originate in the gaseous disks or halos of intervening galaxies (reviewed by Bechtold 2001). The highest column absorbers – the damped Ly- systems and 21-cm absorbers – are thought to originate in the progenitors of large galaxies like the Milky Way at high redshift (Wolfe, Lanzetta, Foltz, & Chaffee 1995; Rao, Turnshek, & Briggs 1995; Storrie-Lombardi & Wolfe 2000 and references therein). At moderate redshift (z1) they generally appear associated with spirals or low surface brightness galaxies (Steidel, Dickinson Persson 1994; Steidel, Pettini, Dickinson Persson 1994; Steidel et al. 1997; Le Brun, Bergeron, Boisse, & Deharveng 1997; Lane et al. 1998; Boisse et al. 1998). The damped Ly absorbers have been the subject of many detailed studies of the metallicity of the absorbing gas, since the damping profile of Ly- yields an accurate measure of the H I column density, a first step in measuring abundances, and the relatively high columns enable weak, unsaturated transitions of important ions to be detected. For some damped Ly systems, 21-cm absorption can be detected as well; individual 21-cm velocity components can often be deblended more easily than the UV absorption components, allowing kinematics of the parent galaxy to be probed (Wolfe & Briggs 1981; Briggs & Wolfe 1983; Carilli et al. 1996; Lane, Briggs, & Smette 2000)
The detailed abundance pattern of the heavy elements in quasar absorbers reflect the nucleosynthetic history of the parent galaxy, and hence the origin of the gas. The interpretation of the UV absorption spectrum, however, is uncertain, despite very high quality spectra in many cases (Lu et al. 1996; Prochaska & Wolfe 1999; Pettini et al. 2000 and references therein). The problem is disentangling the effect of dust depletion from intrinsic metallicity variations, in the face of large uncertainties due to saturation of the lines of the most abundant elements, and the uncertain ionization corrections for the abundant elements.
In this paper, we report the first results of a program to measure abundances in quasar absorbers in a new way, namely by measuring the photoelectric absorption in the soft X-rays. The advantage of the X-ray absorption is that it will give a measure of the heavy element column density that is essentially independent of ionization, inclusion of an atom in a molecule, or depletion onto grains (Morrison & McCammon 1983; Wilms, Allen & McCray 2000). Here, we describe Chandra ACIS-S observations of two 21-cm and damped Ly absorbers, at in PKS 1127-145 (=1.17), in Q 1331+171 (=2.08), and a third candidate damped Ly absorber, Q 0054+1331 (=0.171). The imaging of PKS 1127-145 is presented in a companion paper (Siemiginowska et al. 2001).
2 Observations and Analysis
We observed the quasars with a back-side illuminated CCD, ACIS-S (CCD number 7) on board the Chandra X-ray Observatory (Weisskopf et al. 1996; 2000). Details of the observations are listed in Table 1. We read out custom subarrays (1/8 subarray) and moved the target off-axis in order to mitigate pile-up”, which distorts the X-ray spectrum. The measured count rates indicate that pile-up is negligible: less than 1 of the source photons are affected (McNamara, 2001). For all objects, the position of the X-ray source agreed with the optical positions to better than 1 . The right ascension and declination of the X-ray sources are listed in Table 1.
The data were reduced by the standard pipeline (version R4CU5UPD7.1 with CALDB v.1.7 for Q 0054+1331 and version R4CU5UPD13.3 with CALDB 2.1 for PKS 1127-145 and Q 1331+171). CALDB 2.1 was used to create the instrument responses and PSF files. We used CIAO 2.0 and Sherpa to analyze the data, and cross-checked the fits with XSPEC where feasible.
Source and background spectra were extracted from the event files assuming circular or elliptical regions for the quasars with dmextract and then fit in Sherpa. (Data for Q1331+171 were obtained far off-axis so an elliptical source region was required).
Results of spectral fitting are given in Table 2. We fit each spectrum with a power law, with fixed unredshifted absorption with the Galactic column, and redshifted absorbers, as indicated in Table 2. We did not use data with E 0.4 keV since large uncertainties exist in the calibration for soft energies at this time. We discuss each object in turn.
3 Q 0054+144, PHL 909,
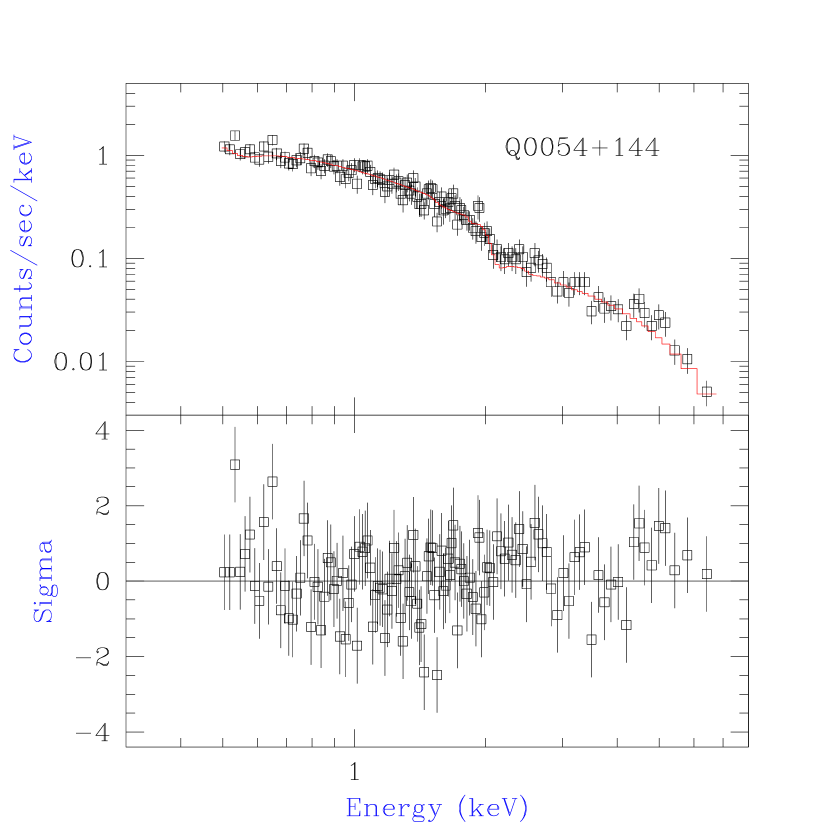
Q 0054+144 is a low redshift QSO, which, prior to the launch of Chandra, was known from observations to be bright in the X-rays (HEASARC ROSAT archive, Snowdon et al. 1995). It is radio quiet, and has a well-studied host galaxy, which has colors and morphology suggesting that it is an early-type galaxy (Bahcall, Kirhakos & Schneider 1996; McLure et al. 1999). A candidate damped Ly absorber at was suggested by Lanzetta et al. (1995) using data. Because Q 0054+144 appeared to be bright enough to allow a high quality grating observation with , we obtained a short exposure to measure the spectral energy distribution precisely, particularly in the critical soft X-ray region where the oxygen edges are expected. The results of the observation spectral fits are listed in Table 2, and the best fit power law is shown in Figure 1.
The X-ray spectrum is adequately fit with a power law and no intervening absorption. Subsequently, we became aware of a Hubble Space Telescope GHRS spectrum of Q 0054+144 taken with the G140L grating, which showed that no damped Ly absorption is present at . The GHRS spectrum is shown in Figure 2. The most prominent absorption feature is a complex of absorption at the emission line redshift, seen in Ly and N V 1238,1242. Si II and Si III are weak or absent, suggesting that the system originates with material intrinsic to the quasar, although O VI is also absent. A low ionization metal absorption line system is present at , but Ly is not damped. Lines at 1354 and 1365 are probably Ly lines at and 0.123, with metal absorption weak or absent.
Despite the lack of an intervening damped Ly absorber or a strong X-ray absorber in the Chandra spectrum, Q0054+144 would be a good candidate for future X-ray grating observations, because of its high count rate, steep X-ray spectrum and associated () ultraviolet absorption system.
4 Q1331+170,
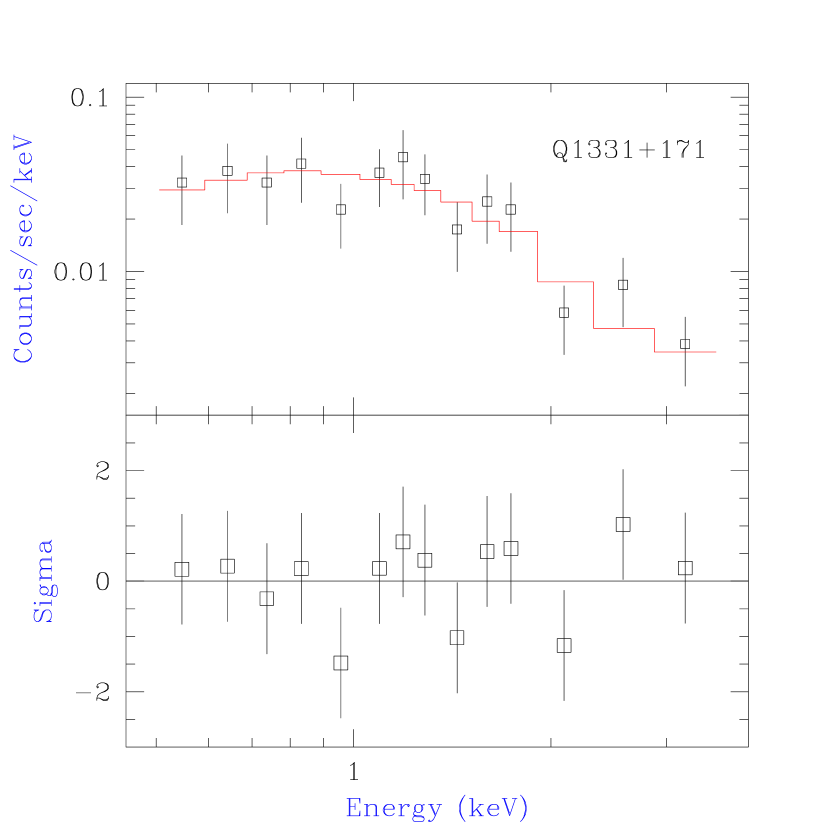
Prior to our observations, Q 1331+170 had never been observed before in the X-rays, even though optically it is one of the brightest quasars known. There is a strong damped Ly and 21-cm absorber at which contains unusually low ionization material, including C I (Carswell et al. 1979; Wolfe & Davis 1979; Songaila et al. 1994).
The short (3000 second) observation yielded only 198 counts, and a 3- upper limit to NH at =1.77 of 1.9 1022 cm-2, assuming solar abundance. This value is larger than the observed N(HI) from Ly of 1.61021 cm-2. With a longer exposure, X-ray absorption should be detectable.
5 PKS 1127-145,
PKS 1127-145 is a bright, gigahertz-peaked radio source with a VLBI and X-ray jet (Kellerman et al. 1998; Siemiginowska et al. 2001). The properties of the X-ray jet are discussed in the companion paper (Siemiginowska et al. 2001). A strong intervening Mg II and Mg I absorption system at was discovered by Bergeron & Boisse (1991) who also identified two late type galaxies near the quasar line of sight at the redshift of the absorber. The nearer galaxy, separated by 9.6 from the quasar (27 h kpc), has strong [O II], [O III] and H emission lines. An observation with FOS of the galaxy by Deharveng et al. (1995) did not detect Ly emission, and although this galaxy is one of the reddest in the survey of Steidel (1993) it appears to have little extinction. Deharveng et al. (1995) then estimated that the oxygen abundance is approximately 30 solar, based on the nebular emission line ratios.
Lane et al. (1998) discovered H I 21-cm absorption at and described the Ly profile of the absorber, based on FOS data, which appears damped. The neutral hydrogen column density derived from the damped Ly profile is N(HI)=(5.10.9) 1021 cm-2. Further, they obtained an optical spectrum of a third galaxy with [O III] emission lines, and a separation, 3.9 , or 11 h kpc from the quasar. This may be the absorber, or the absorption could arise in tidal debris associated with this group of galaxies.
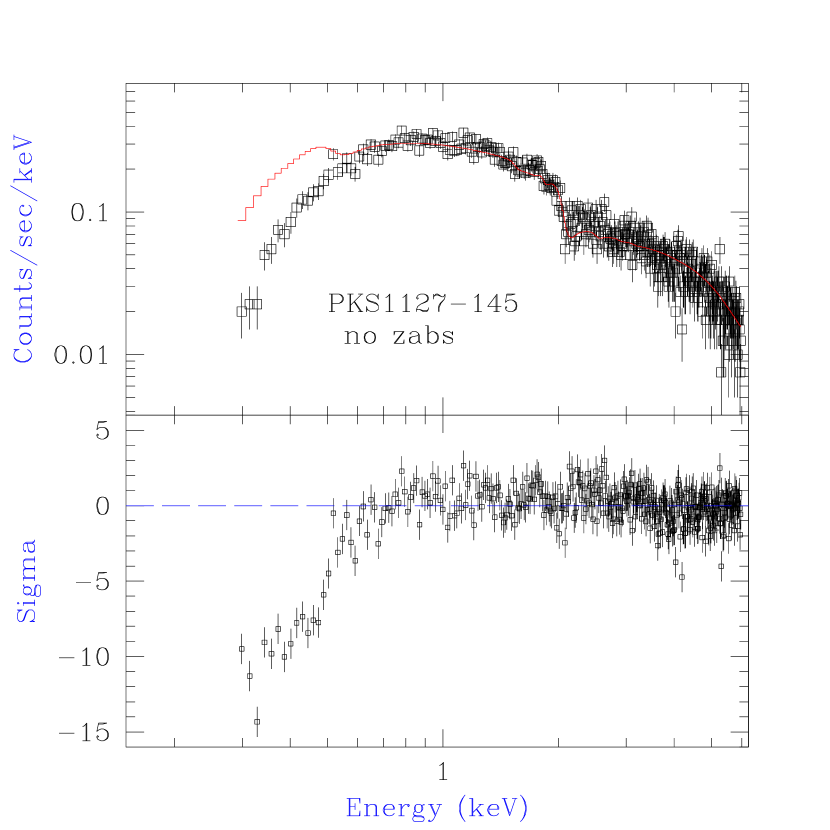
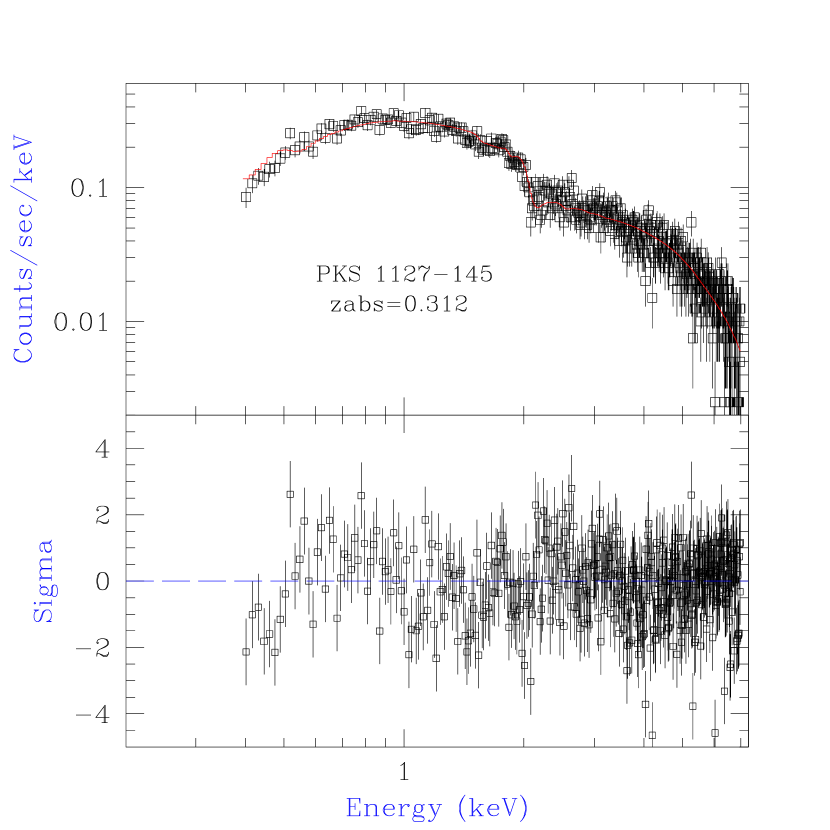
The X-ray spectrum of PKS 1127-145 shows significant absorption in excess of the Galactic value. Figure 3a shows the data with E2 keV fit by a power law and Galactic absorption; the fit extrapolated for E2 keV is poor, with systematic residuals. Figure 3b shows the data fit by a power law, Galactic absorption, and intervening absorption at the redshift of the 21-cm absorber, .
The statistics are good enough to show significant features in the residuals. All of the features can be accounted for by calibration uncertainties, that is, they occur at energies where there are sharp features in the effective area curve due to instrumental properties. Improved calibration may therefore change our fits, but we have been conservative in our interpretation of the X-ray data, and we estimate that these changes will only make the conclusions we have drawn stronger. We fit the spectrum with both Morrison & McCammon (1983) and Wilms, Allen & McCray (2000) cross-sections, and obtain similar residuals for both.
If we fix the redshift of the absorber to be for PKS 1127-145, then the absorber has N(HI)=1.2 0.08 1021 cm-2 if the abundance is solar, compared to N(HI) = 5.1 0.9 cm-2 derived from the damped Ly profile (Lane et al. 1998). The X-ray absorption implies that the abundance is about 23 solar, consistent with that found from the nebular emission lines.
With the low spectral resolution of the ACIS-S, the redshift of the X-ray absorption is not certain to be that of the intervening 21-cm absorption. The two parameters of the absorber, redshift and NH are correlated: higher redshift requires higher NH to fit the observed spectrum. Figure 4 shows the confidence levels for the two parameters, where the 1 contour has an elongated shape. When we allow the redshift of the absorber to vary, the best fit redshift is , but the chi-squared minimum is very shallow, and adequate fits are allowed at other redshifts. Better calibration of ACIS below 0.4 keV is needed to constrain the redshift better. A grating observation would give a definite answer about the location of the absorber, because of the possible detection of the oxygen edge in the high resolution data.
However, the most plausible redshift for the X-ray absorber is . The UV spectrum shows that the absorber has by far the highest column of H I of any redshift system along the line of sight (Figure 5). There is an absorber at , but it is weak, and has no associated O VI or N V absorption; it is likely a low column density Ly forest cloud.
We can rule out with high confidence an origin for the absorption in diffuse Milky Way interstellar gas. We refit the X-ray data using a power law and absorption only, with the column density allowed to vary as a free parameter. The best fit reduced = 1.31 (517 degrees of freedom), compared to = 1.125 for the case with a 0.312 absorber. Further, the best fit column if all the absorption is at is 1.35 0.07 cm-2, compared to 0.383 0.01 cm-2 measured from high resolution 21-cm emission data by Murphy et al. (1996). The absorption column required to fit the X-ray data is more than 10 greater than the Galactic column, and is unlikely to be at .
6 Limits on Abundances of Individual Elements for the PKS1127-145 Absorber
The spectral resolution of the ACIS-S is insufficient to resolve the individual edges of the elements. Moreover, we expect that most of the opacity is from oxygen, and if the absorption is at , the K-edge of oxygen at rest energy 0.532 keV is redshifted to 0.405 keV, outside the part of the ACIS-S pass-band with reliable calibration. We tried a fit with =0.312 frozen, and two absorbers, one with He/H only, frozen at the primordial value, and the other with processed” metals, including oxygen (c.f. Madesjki et al. 1996). We allowed the total column of each to vary. The results are shown figure 5.
We found that we could fit the data with a model where all the absorption is the result of helium (and NH= cm-2), about a factor of 3 greater than the column derived assuming heavy metals are present. It is implausible however that the X-ray absorber would be pure helium and hydrogen, since the 0.312 system shows strong metal absorption in the ultraviolet.
Even if the X-ray absorption opacity is due to helium and hydrogen only, we can still place a limit on the oxygen abundance relative to the H I measured by the damped Ly profile. The 3 upper limit to the oxygen abundance is 17 solar. Improved calibration of ACIS-S may change these results significantly. Grating observations with Chandra will be able to measure the oxygen edge directly, and remove the ambiguity in the assumed ratio of the elements heavier than hydrogen.
7 Discussion
High quality spectra from ground and from HST have been used to investigate the detailed abundance patterns in damped Ly absorbers (Lauroesch, Truran, Welty & York 1996; Pettini et al. 1999 and references therein). The observed pattern appears to be consistent with the Galactic halo pattern (Population II) with little dust depletion, although dust depleted solar ratios cannot be ruled out (Lu et al. 1996; Prochaska & Wolfe 1999), although uncertainties remain. Saturation of the absorption lines, particularly for the more abundant elements like C, N and O mean that column densities of these elements are difficult to determine (Lu, Sargent & Barlow 1998). Elements condense out of the gas phase onto dust grains, so that the absorption line columns are estimated to be low by factors of 3-5 for lightly refractory elements such as C, N and O, and depleted by factors of 1000 or so for Fe, Mg or Si (Jenkins, Savage & Spitzer 1986). The exact ratio depends on details of the grain chemistry, and the particular history of shocks which the material has suffered. Wide variations in the depletion factors are seen empirically in Milky Way ISM clouds (see Tielens 1998, and references therein).
One element which is not depleted onto dust, however, is zinc (Morton 1974; de Boer, Fitzpatrick, & Savage 1985; Sembach, Steidel, Macke, & Meyer 1995). and extensive surveys of the abundance of Zn II relative to hydrogen in damped Ly absorbers (Meyer, Lanzetta, & Wolfe 1995, Pettini et al. 1997). Zinc shares the same nucleosynthetic origin as iron and so Zn/H gives a reliable indication of Fe/H. Iron unfortunately suffers heavy, variable depletion onto dust grains and therefore is impossible to use to measure abundances (deBoer & Lamers 1978).
The signature of Population II abundances is an enhancement of oxygen and other even-proton nuclei (Ne, Mg, Si, S, Ar and Ca) relative to the iron group elements (Fe, Zn, Cr) (Lauroesch et al. 1996; Timmes, Lauroesch & Truran 1995 and references therein). Such an enhancement is observed very clearly in the analysis of the oldest, metal-poor halo stars in the Milky Way where the oxygen group (by which we mean O, Ne, Mg, Si, S, Ar and Ca) is enhanced by a factor of 3 relative to solar ratios of iron and other even-Z iron peak nuclei (Zn, Fe, Cr, Ni). The reason is that oxygen, along with other -elements, is produced primarily by massive stars which evolve on short time scales compared with the lower-mass progenitors of Type Ia SNe which produce the iron group elements such as zinc. It is therefore expected that O/H will increase towards the solar value earlier than Zn/H, particularly given the high star-formation rates expected in the early stages of galaxy evolution.
The X-ray absorption detected with Chandra for PKS 1127-145 measures the abundance of the oxygen group elements directly. The X-ray absorbing column measures the metallicity of the gas independent of dust depletion and saturation effects, and is caused by exactly those elements (O, Ne, Mg, Si, S, Ar. Ca) which are expected to be enhanced in Pop II objects (see Morrison and McCammon (1983). By comparing metallicity derived from the X-ray absorbing column with that measured by the Zn II lines (iron group) we can see directly if the damped Ly has a halo-type abundance pattern, or a disk-type abundance pattern. These observations also serve as an important check on the UV absorption line spectroscopy.
The existing HST spectra of PKS 1127-145 unfortunately are inadequate to detect Zn II at the strength predicted by our X-ray measurements. Ultraviolet transitions of S II are also interesting to search for, but fall within the Ly forest; the strongest S II transition at 1259 is also blended with the much stronger Si II 1260 line. Future high resolution observtions in the UV may be able to detect S II lines for direct comparison to the oxygen abundance derived from the X-ray data. Spectroscopy to search for Zn II absorption with the echelle on STIS is planned.
ACKNOWLEDGMENTS
We thank the staff of the Chandra X-ray Center for their aid with the planning and analysis of these observations. We thank Greg Madejski for suggesting we consider the relative importance of absorption by helium. JB appreciates financial support from NSF grant AST-9617060 and Chandra Guest Observer grant GO0-1164X from NASA. AS, ME, TA and AD acknowledge support from NASA contract No. NAS8-39073 (ASC). This research has made use of the NASA/IPAC Extragalactic Database (NED) which is operated by the Jet Propulsion Laboratory, California Institute of Technology, under contract with NASA, as well as data obtained with the the NASA/ESA Hubble Space Telescope, retrieved from the archive at the Space Telescope Science Institute, which is operated by the Association of Universities for Research in Astronomy, Inc. under NASA contract No. NAS5-26555.
References
- Bahcall, Kirhakos, & Schneider (1996) Bahcall, J. N., Kirhakos, S., & Schneider, D. P. 1996, ApJ, 457, 557
- Bechtold (2001) Bechtold, J. 2001, in press, proceedings of the XI Canary Islands Winter School on High Redshift Galaxies.
- Bergeron & Boisse (1991) Bergeron, J. & Boisse, P. 1991, A&A, 243, 344
- Lauroesch, Truran, Welty, & York (1996) Lauroesch, J. T., Truran, J. W., Welty, D. E., & York, D. G. 1996, PASP, 108, 641
- Boisse, Le Brun, Bergeron, & Deharveng (1998) Boisse, P., Le Brun, V., Bergeron, J., & Deharveng, J. 1998, A&A, 333, 841
- Briggs & Wolfe (1983) Briggs, F. H. & Wolfe, A. M. 1983, ApJ, 268, 76
- Carilli et al. (1996) Carilli, C. L., Lane, W., de Bruyn, A. G., Braun, R., & Miley, G. K. 1996, AJ, 112, 1317
- Carswell et al. (1975) Carswell, R. F., Hilliard, R. L., Strittmatter, P. A., Taylor, D. J., & Weymann, R. J. 1975, ApJ, 196, 351
- Centurión, Bonifacio, Molaro, & Vladilo (2000) Centurión, M., Bonifacio, P., Molaro, P., & Vladilo, G. 2000, ApJ, 536, 540
- de Boer & Lamers (1978) de Boer, K. S. & Lamers, H. J. G. L. M. 1978, A&A, 69, 327
- de Boer, Fitzpatrick, & Savage (1985) de Boer, K. S., Fitzpatrick, E. L., & Savage, B. D. 1985, MNRAS, 217, 115
- Deharveng, Buat, & Bergeron (1995) Deharveng, J. -., Buat, V., & Bergeron, J. 1995, A&A, 298, 57
- Jenkins, Savage, & Spitzer (1986) Jenkins, E. B., Savage, B. D., & Spitzer, L. 1986, ApJ, 301, 355
- Kellermann, Vermeulen, Zensus, & Cohen (1998) Kellermann, K. I., Vermeulen, R. C., Zensus, J. A., & Cohen, M. H. 1998, AJ, 115, 1295
- Lane, Briggs, & Smette (2000) Lane, W. M., Briggs, F. H., & Smette, A. 2000, ApJ, 532, 146
- Lane et al. (1998) Lane, W., Smette, A., Briggs, F., Rao, S., Turnshek, D., & Meylan, G. 1998, AJ, 116, 26
- Lanzetta, Wolfe, & Turnshek (1995) Lanzetta, K. M., Wolfe, A. M., & Turnshek, D. A. 1995, ApJ, 440, 435
- Lu et al. (1996) Lu, L., Sargent, W. L. W., Barlow, T. A., Churchill, C. W., & Vogt, S. S. 1996, ApJS, 107, 475
- Lu, Sargent, & Barlow (1998) Lu, L., Sargent, W. L. W., & Barlow, T. A. 1998, AJ, 115, 55
- Le Brun, Bergeron, Boisse, & Deharveng (1997) Le Brun, V., Bergeron, J., Boisse, P., & Deharveng, J. M. 1997, A&A, 321, 733
- Madejski et al. (1996) Madejski, G., Takahashi, T., Tashiro, M., Kubo, H., Hartman, R., Kallman, T., & Sikora, M. 1996, ApJ, 459, 156
- McLure et al. (1999) McLure, R. J., Kukula, M. J., Dunlop, J. S., Baum, S. A., O’Dea, C. P., & Hughes, D. H. 1999, MNRAS, 308, 377
- (23) McNamara, B., 2001, http://asc.harvard.edu/cal/
- Meyer, Lanzetta, & Wolfe (1995) Meyer, D. M., Lanzetta, K. M., & Wolfe, A. M. 1995, ApJ, 451, L13
- Morrison & McCammon (1983) Morrison, R. & McCammon, D. 1983, ApJ, 270, 119
- Morton (1974) Morton, D. C. 1974, ApJ, 193, L35
- Murphy, Lockman, Laor, & Elvis (1996) Murphy, E. M., Lockman, F. J., Laor, A., & Elvis, M. 1996, ApJS, 105, 369
- Pettini, Ellison, Steidel, & Bowen (1999) Pettini, M., Ellison, S. L., Steidel, C. C., & Bowen, D. V. 1999, ApJ, 510, 576
- Pettini, Smith, King, & Hunstead (1997) Pettini, M., Smith, L. J., King, D. L., & Hunstead, R. W. 1997, ApJ, 486, 665
- Pettini et al. (2000) Pettini, M., Ellison, S. L., Steidel, C. C., Shapley, A. E., & Bowen, D. V. 2000, ApJ,
- Prochaska & Wolfe (1999) Prochaska, J. X. & Wolfe, A. M. 1999, ApJS, 121, 369
- Rao, Turnshek, & Briggs (1995) Rao, S. M., Turnshek, D. A., & Briggs, F. H. 1995, ApJ, 449, 488
- Sembach, Steidel, Macke, & Meyer (1995) Sembach, K. R., Steidel, C. C., Macke, R. J., & Meyer, D. M. 1995, ApJ, 445, L27
- Siemiginowska et al. (2001) Siemiginowska, A. et al. 2001, ApJ, submitted.
- Songaila et al. (1994) Songaila, A. et al. 1994, Nature, 371, 43
- Snowden et al. (1995) Snowden, S. L. et al. 1995, ApJ, 454, 643
- Stark et al. (1992) Stark, A. A., Gammie, C. F., Wilson, R. W., Bally, J., Linke, R. A., Heiles, C., & Hurwitz, M. 1992, ApJS, 79, 77
- Steidel (1993) Steidel, C. C. 1993, private communication to Deharveng et al. (1995).
- Steidel, Dickinson, & Persson (1994) Steidel, C. C., Dickinson, M., & Persson, S. E. 1994, ApJ, 437, L75
- Steidel, Pettini, Dickinson, & Persson (1994) Steidel, C. C., Pettini, M., Dickinson, M., & Persson, S. E. 1994, AJ, 108, 2046
- Steidel et al. (1997) Steidel, C. C., Dickinson, M., Meyer, D. M., Adelberger, K. L., & Sembach, K. R. 1997, ApJ, 480, 568
- Storrie-Lombardi & Wolfe (2000) Storrie-Lombardi, L. J. & Wolfe, A. M. 2000, ApJ, 543, 552
- Tielens (1998) Tielens, A. G. G. M. 1998, ApJ, 499, 267
- Timmes, Lauroesch, & Truran (1995) Timmes, F. X., Lauroesch, J. T., & Truran, J. W. 1995, ApJ, 451, 468
- Weisskopf, O’dell, & van Speybroeck (1996) Weisskopf, M. C., O’dell, S. L., & van Speybroeck, L. P. 1996, Proc. SPIE, 2805, 2
- Weisskopf, O’dell, & van Speybroeck (2000) Weisskopf, M. C., et al. 2000, Proc. SPIE, 4012, 2
- Wilms, Allen, & McCray (2000) Wilms, J., Allen, A., & McCray, R. 2000, ApJ, 542, 914
- Wolfe & Briggs (1981) Wolfe, A. M. & Briggs, F. H. 1981, ApJ, 248, 460
- Wolfe & Davis (1979) Wolfe, A. M. & Davis, M. M. 1979, AJ, 84, 699
- Wolfe, Lanzetta, Foltz, & Chaffee (1995) Wolfe, A. M., Lanzetta, K. M., Foltz, C. B., & Chaffee, F. H. 1995, ApJ, 454, 698


| Object | Date | Exp.a | NHIb | , | Countsd | |
|---|---|---|---|---|---|---|
| Seq. No., OBSID | () | (J2000) | ||||
| Q 0054+144 | 0.171 | 2000 July 29 | 4660 | 4.35 | 00:57:09.99 | 6210 |
| 700170, 865 | +14:46:10.46 | |||||
| PKS 1127-145 | 1.187 | 2000 May 28 | 27,358 | 3.83 | 11:30:07.014 | 16,238 |
| 700171, 866 | -14:48:27.35 | |||||
| Q 1331+170 | 2.08 | 2000 April 3 | 3021 | 1.8 | 13:33:35.708 | 198 |
| 700172, 867 | +16:49:03.73 |
| Object | Normd | ||||
|---|---|---|---|---|---|
| Q 0054+144 | 0.171 | 2.8 | 1.950.04 | 13.290.04 | 36.7 |
| None | – | 1.970.03 | 13.240.18 | 36.8 | |
| PKS 1127-145 | 0.312 | 1.190.08 | 1.190.02 | 6.480.15 | 59.7 |
| 1.187 | 3.410.21 | 1.170.02 | 6.280.11 | 60.3 | |
| None | – | 0.980.01 | 5.100.08 | 68.0 | |
| Free | 1.1980.061 | 1.210.02 | 6.670.06 | 59.7 | |
| Q 1331+170 | 1.77 | 19.1 | 1.480.19 | 0.540.09 | 3.14 |
| None | – | 1.480.13 | 0.540.05 | 3.13 |