Is the Compact Source at the Center of Cas A Pulsed?
Abstract
A 50 ksec observation of the Supernova Remnant Cas A was taken using the Chandra X-Ray Observatory High Resolution Camera (HRC) to search for periodic signals from the compact source located near the center. Using the HRC-S in imaging mode, problems with correctly assigning times to events were overcome, allowing the period search to be extended to higher frequencies than possible with previous observations Murray (2000). In an extensive analysis of the HRC data, several possible candidate signals are found using various algorithms, including advanced techniques developed by Ransom (2001) to search for low significance periodic signals. Of the candidate periods, none is at a high enough confidence level to be particularly favored over the rest. When combined with other information, however (e.g., spectra, total energetics, and the historical age of the remnant), a 12 ms candidate period seems to be more physically plausible than the others, and we use it for illustrative purposes in discussing the possible properties of a putative neutron star in the remnant. We emphasize that this is not necessarily the true period, and that a follow-up observation, scheduled for the fall of 2001, is required.
A 50 ksec Advanced CCD Imaging Spectrometer (ACIS) observation was taken, and analysis of these data for the central object shows that the spectrum is consistent with several forms, and that the emitted X-ray luminosity in the 0.1 -10 keV band is depending on the spectral model and the interstellar absorption along the line of sight to the source. The spectral results are consistent with those of Pavlov et al. (2000) and Chakrabarty et al. (2001) .
1 Introduction
The first high resolution X-ray image of Cas A was obtained using the Einstein HRI. A search for a point source near the center of the remnant resulted only in an upper limit on its luminosity (Murray et al. (1979); Fabian et al. (1980)). Other X-ray observations using ROSAT and ASCA also failed to detect a central point source. This situation changed dramatically with the first light image from the Chandra X-ray Observatory taken on 1999, August 20. In a relatively short (6ksec) Advanced CCD Imaging Spectrometer (ACIS; Garmire (1997)) observation, the power of the Chandra high resolution X-ray telescope was demonstrated by revealing immediately the existence of a point-like object near the center of the remnant (Tananbaum (1999)). This object is likely to be either a neutron star or black hole left over from the explosion of the progenitor star. Subsequent searches in the radio (McLaughlin et al. (2001)) and optical (Kaplan,Kulkarni, & Murray (2001); Ryan,Wagner, & Starrfield (2001)) have yet to detect a point source at the center of Cas A.
One distinguishing characteristic of a rotating neutron star would be the presence of periodic pulses. The ACIS observations were made in the timed exposure mode with a frame integration time of 3.24 seconds so that searches for pulsations could be made only for fairly long periods . To search for shorter periods down to the rotational breakup period for a neutron star (around 1 msec Shapiro & Teukolsky (1983) ), it was necessary to observe Cas A with the High Resolution Camera (HRC; Murray et al. (1998); Zombeck et al. (1995) ). The HRC is an event triggered detector with about timing resolution. As part of the orbital verification and calibration program, two 10 ksec observations of Cas A were taken, one each with the HRC-I (imaging) and the HRC-S (spectroscopy) detectors on 1999, September 3 and 5. When these and additional public data were analyzed for pulsations from the point source, no significant signals were found (Chakrabarty et al. (2001)). On average there are only about 300 HRC counts per 10 ksec from the source (counts within a 1 arc second radius), and Chakrabarty et al. placed an upper limit of 35% pulsed fraction for periods longer than 20msec.
Spectral analysis of the public ACIS data by both Chakrabarty et al. and Pavlov et al. (2000) result in only marginal conclusions regarding the nature of the central point source. “At present we do not have a unique model to account for the observed properties of the X-ray point source in Cas A” Chakrabarty et al. (2001). “Critical observations to elucidate the nature of CCO (Compact Central Object) include searching for periodic and aperiodic variabilities, deep IR imaging, and longer ACIS Chandra observations which would provide more source quanta for the spectral analysis” Pavlov et al. (2000). As discussed below, we present a deeper observation of Cas A of 50 ksec with the HRC for timing purposes, and 50 ksec with the ACIS for higher accuracy spectral analysis than was possible from the calibration data sets.
1.1 Problems with HRC-I Timing
Using the Chandra X-Ray Observatory and the HRC, we obtained a 50 ksec observation of Cas A specifically to search for pulsations from the compact source detected near the center of the remnant. This observation (OBSID 01505) was taken using the HRC-I on 1999 December 20. The standard Chandra X-ray Center (CXC) pipeline processing system was used to produce the Level 1 and Level 2 data products for further analysis as described below. Data from the point source were extracted from the event list in a arc second radius region (8 HRC pixels) around the source.
It was subsequently found that the HRC has a wiring error that incorrectly assigns event times such that the assigned time is that for the previous event trigger (Murray (2000); Seward (2000)). If every event trigger resulted in an event in the telemetry, this error could be easily corrected by simply shifting event times by one event during ground processing. However, due to telemetry limitations () and on-board event screening, not all event triggers necessarily result in an event entering the telemetry stream. Therefore determining true event times is not always possible, and under normal HRC operating conditions cannot be done for a significant fraction of the events.
For OBSID 01505, the average rate of event triggers was about (total event rate), many of which were due to cosmic rays and solar protons. The HRC includes an active plastic scintillator coincidence shield that is normally used to veto event triggers arising from penetrating charged particles. With this veto enabled (normal mode), the average rate of telemetered events was reduced to about (valid event rate). Thus, in this normal operating mode, of the event triggers did not produce the events in the telemetry which are needed to correctly assign proper event times to the events coming from the central point source.
In order to evaluate the impact of the HRC timing error on our ability to detect pulsations, we developed a high fidelity software simulation of the detector and telemetry system. Simulations for this observation (OBSID 01505) show that if no attempt is made to correct the timing error, or if the only correction made is to shift the telemetered time for each event by one event, then a sinusoidal pulse signal with modulation amplitude or with a period of less than 20 msec will be undetectable (similar to the conclusions of Chakrabarty et al. (2001)).
Some data recovery techniques have been investigated to improve the probability that an event time will be correct. For example a filter can be used to select event pairs where there is a high likelihood that the events occurred in succession and therefore the time of the first event of the pair can be obtained from the time assigned to the second event. This class of filters reduces the number of events that can be used for timing studies and therefore decreases sensitivity. As discussed by Tennant et al. (2001) in their analysis of a Chandra observation of the Crab Pulsar, this type of data recovery can be useful when the pulse period is known, and therefore the signal needed to make a measurement can be smaller than that needed for detection. For OBSID 01505, no statistically significant period signal was found, regardless of the algorithm or filter used.
1.2 Solution using HRC-S in Imaging Mode
For HRC-I using the coincidence shield and requiring anti-coincidence between detector events and the shield for inclusion in the telemetry stream reduces the cosmic ray background and limits the valid event rate to a level below telemetry saturation. For HRC-S we would have expected the same behavior; however, the coincidence window between the event trigger and shield signal is too small, and an alternative means of selecting events is used. The rate is reduced by pre-selecting only about 1/2 of the detector active area using the edge blanking feature of the instrument. This reduction is fine for spectroscopic observations since the transmission gratings disperse the spectrum along a thin region of the detector and the edges that are blanked do not contain “interesting” events. The consequences are essentially the same as for the HRC-I. There are about 250 event triggers per second, which would exceed the telemetry limit if all were allowed to be processed as valid events. The on-board edge blanking veto selectively suppresses “uninteresting” events (for spectroscopy) to the level where the telemetry is not filled and all processed events can be transmitted to the ground. However, as with the HRC-I, the times of events can not all be properly corrected since many event triggers are not included in the data sent to the ground.
Fortunately, the HRC-S can be operated in a “special” mode where all event triggers result in events that are included in the telemetry. In this mode, only the central MCP segment is able to initiate an event trigger. This restriction reduces the background by about a factor of three from the normal HRC-S rate (i.e., total event rate goes from to ). and therefore allows the on-board event screening to be turned off. All event triggers are processed as valid events and fit within the telemetry limit of . This mode is designated as the HRC-S (Imaging) Mode. It is now available for all observers and was used to re-observe those AO-1 and AO-2 targets requiring the high time resolution of the HRC, including our Cas A observation.
2 Observations
The new 50 ksec observation of Cas A (OBSID 01857) was carried out on 2000 October 5 using the imaging mode of the HRC-S. The standard Level 1 event list provided by the CXC pipeline processing system was used as a starting point for more detailed analysis. This file contains all of the HRC triggered events with their positions corrected for instrumental (de-gap) and aspect (dither) effects. The events were then time corrected by assigning the time of event n+1 to event n, and then screened using the background reduction algorithm developed by Murray et al. (2000).
A 50 ksec observation of Cas A on 2000 January 30 with the backside-illuminated ACIS S-3 chip (OBSID 00114) provided roughly 5000 counts from the point source. The CCD was operated in normal time exposure mode at a temperature of . Instrument response files for the spectral analysis were generated using software made available by the CXC with calibration data from 2000 May.
2.1 Image Analysis
The images obtained with the HRC and ACIS provide upper limits to the X-ray flux that might be associated with a synchrotron nebula around the central compact object. Scaling from the Vela or Crab pulsar nebula, we expect a nebula of order 10 arcsec in radius, and this should emit a total luminosity of order 10 times that of the compact object, assuming that it is a pulsar like the Crab. The compact source in Cas A yields 1424 counts within 1 arc second radius ( ). Thus the nebula brightness should yield about 45 HRC counts per square arc second in the 50 ksec observation or a total flux .111The area of the nebula is 100 times the region of emission from which the pulsar flux is measured, but the total flux of the nebula is 10 times the pulsar’s. Thus, the emission/arc second is about 10/100 as compared with the pulsar. The central region of Cas A is shown in Figure 1.
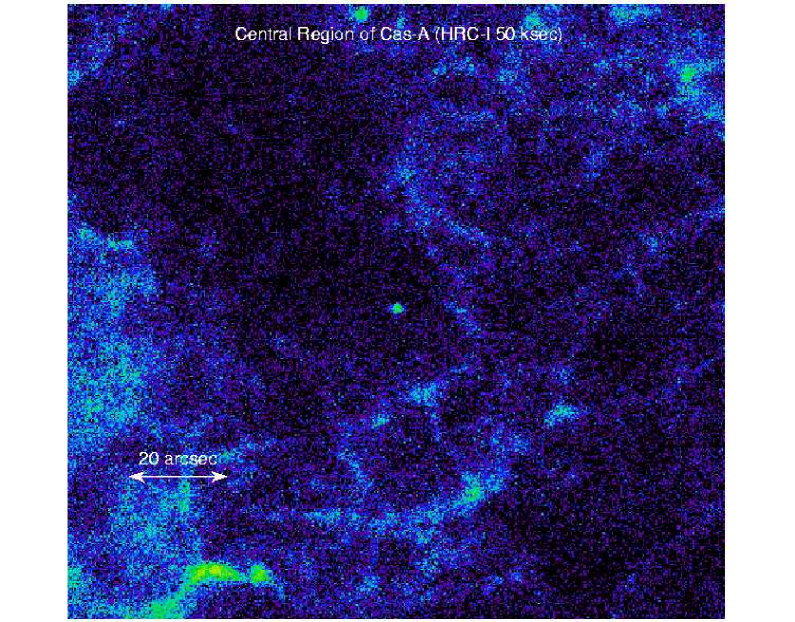
For the extended region, excluding the 1 arc second radius region around the compact object, we observe about 20 HRC counts per square arc second, well below the expected value for a Crab-like nebula. To further quantify this result, we examined the region around the point source for excess emission using a wavelet decomposition (Vikhlinin, Forman, & Jones (1994)) to subtract the emission from the filamentary structures of the SNR in the central part of the image as well as the point-like source itself. We use the wavelet residuals as an estimate for the upper limit from any nebula emission associated with the central object. From the HRC-I image (OBSID 01505) we considered a central 2 arc minute region for the wavelet decomposition. Using the residual image (i.e., the image after all of the wavelet components are subtracted), we found a total flux of within a 10 arc second radius ( within a 15 arc second radius giving essentially the same surface brightness in both cases, and indicating that most of the small scale remnant structures have been removed), corresponding to an X-ray luminosity (within 10 arc seconds) of assuming and a photon spectral index of 2.0. Using the ACIS-S data from OBSID 00114 we obtain a similar result. We take this as an estimate of the upper limit to any emission from a synchrotron nebula around the point source in Cas A.
2.2 Timing Analysis
In the image from OBSID 01857, the point source is clearly detected at a location: (CXO positions are accurate to within arcsec), within 1.7 arcsec of the position reported by Tananbaum (1999). For the timing analysis, only events within a arcsec radius of this location were used (a total of 1424 events). The event times (provided in terrestrial time by the CXC) were corrected to barycentric time at the solar system barycenter using the definitive Chandra geocentric spacecraft ephemeris. The standard axBary program tool (which uses the JPL DE450 solar system ephemeris) was provided by the CXC yielding a time of arrival (TOA) list.
We conducted initial searches for pulsations using two different methods, a “standard” Fourier transform search, as well as a brute force epoch folding based on the Gregory & Loredo (1992) technique. In both cases, provisions were made to eliminate losses in sensitivity due to finite frequency resolution (i.e. “scalloping”) and the possibility of a signal with a slowly changing frequency (i.e. from pulsar spin-down). The statistically most significant candidate in both searches was a nearly sinusoidal signal with a period of 12.15 msec (82.267 Hz), but numerous other plausible candidates were present as well.
For the Fourier transform search, the events were binned into a 50 million point (1 msec time resolution) time series and then transformed using an FFT (Fast Fourier Transform) algorithm. As the power spectrum was dominated by white noise, all powers were normalized with the number of events (1424), making the statistical properties of the power spectrum equivalent to an exponential distribution with mean and standard deviation of one. We utilized Fourier domain matched filtering techniques to completely and coherently recover power that had spread over up to frequency bins and to correct for “scalloping” effects for signals appearing at frequencies between Fourier bins (Ransom (2001)). Such a search is warranted since young pulsars are predicted to be rotating rapidly () with a relatively large negative frequency derivative (). An identical observation of the fundamental harmonic of the Crab pulsar (, ) would show a drift of -0.94 frequency bins and power losses of from for uncorrected Fourier amplitudes (due to scalloping and frequency drift). Incoherent summing of 1, 2, 4, and 8 harmonics was also used to improve sensitivity to narrow pulse shapes. All frequencies and periods that we mention will be the average values over the course of the observation.
The best candidate from the Fourier transform search had a frequency , or equivalently , and a marginally significant . The normalized power level was 19.5 which corresponds to when the number of independent trials searched is included. Subsequent analyses searched a much wider range of frequency derivatives ( bin drifts) resulting in several candidates with higher significance than the 12.15 msec candidate. The most significant was found as a summation of 8 harmonics with the fundamental at , and an overall significance of .
The modified folding search based on that found in Gregory & Loredo (1992) has several significant advantages over “standard” epoch-folding techniques. The two most significant advantages are that the method does not depend on a specific pulse shape and that it optimizes the signal-to-noise for a profile based on the starting phase of the signal. These two factors can increase the sensitivity of a search by a factor of a few. We searched a frequency range of 0.001 to 500 Hz, and a frequency derivative range of . Our frequency step size of is equivalent to oversampling the Independent Fourier Spacing ( ) by a factor of eight.
With our current implementation of the Gregory and Loredo search it is very difficult to estimate an overall probability that a signal is “real” when searching a very large frequency range. What we can determine, however, is the relative merit of a candidate with respect to another. Data containing a single strong signal would produce a candidate list with the signal as the best candidate with the next best candidate ranked significantly lower than the first. In our search, the best candidate had with a marginally significant consistent with the most physically realistic candidate from the Fourier search, and was ranked approximately 25 times better than the second best candidate. The light curve for this candidate period is shown in Figure 2, where we have used a simple epoch fold with a constant period corresponding the frequency given above. The oscillation has a modulation of (peak - mean/ mean).

2.2.1 Statistical Significance
We stress that although hard to quantify, the statistical significance for the detection of period pulsations is low and cannot be taken as definitive proof of their existence. However, the data do allow us to place an upper limit on any sine-like oscillatory modulation of the signal from the central source in Cas A.
For the HRC-S observation (OBSID 01857), we ran a standard epoch folding analysis centered around the 12.155526 msec period found in the period search discussed in Section 2.2. The figure of merit for the epoch fold is the reduced chi-squared () obtained by comparing the folded (binned) data against the hypothesis of a constant source. The period search was limited to 100,000 test periods starting at 12.15 msec, and ending at 12.16 msec. The expected period (12.155526 msec) was recovered with , which (for 9 degrees of freedom) can be expected accidentally only 1 time in . Given that trials were made there is 1% chance of obtaining this value for from unpulsed data. As mentioned in Section 1 we developed a simulation program for the HRC and the Chandra Observatory that allows us to mimic the Cas A observations including the effects of the wiring error in the instrument. We generated 100 simulated data sets for the case of no pulsations, and ran each though the standard epoch folding algorithm, testing periods per simulated data set as described above. In total, epoch folds and calculations were made. There was one occurrence of exceeding 6, consistent with statistical expectations.
In an effort to determine a reasonable detection limit for a periodic signal, we ran a series of simulations using a modulated signal, approximated by a sinusoidal period of 12.155526 msec and with a modulation (defined as the ratio of the peak deviation from the mean amplitude to the mean amplitude) from 15% to 35%. That is, the number of counts at phase bin is given by , and the modulation is . For each modulation value we ran 100 simulations and obtained the average value for the figure of merit () and its standard deviation. We conclude that if there is an oscillatory signal from the central compact source, it is not highly modulated () or we would have detected the signal with a higher level of confidence than reported above. This result is consistent with the conclusions of Chakrabarty et al. (2001) but is more restrictive in the amplitude of the modulation and in the frequencies spanned.
2.3 Spectral Analysis
Using the ACIS-S3 data from OBSID 00114, the source spectrum was extracted from a 1.5 arcsec radius region centered on the point source, and the background spectrum from an annulus surrounding the source region with radii between 2.75 and 5.5 arcsec. We tried a number of different background regions and found that the spectral analysis was not very sensitive to the exact background region used.
| Photon | ||||||
| Model | ( | Index | (keV) | (km) | ( | |
| PL | … | … | 510 | 161.5, 0.88 | ||
| ThBr | … | … | 5.9 | 155.3, 0.84 | ||
| BB | … | 0.46 | 1.6 | 206.2,1.12 | ||
| BB+PL | 0.23 | 0.7, 2000 | 148.1, 0.81 | |||
| BB+PL | 1.1 (fixed) | 0.54 | 1.5, 0.4 | 182.5,1.0 |
The point source spectrum was fit to a number of simple spectral models, including a blackbody, power-law, combination of blackbody and power-law, and thermal bremsstrahlung (see 1). Figure 3 shows a representative spectral fit for a simple blackbody with interstellar absorption. All the models gave acceptable fits with per degree of freedom , but the thermal bremsstrahlung, power-law and combination models required neutral Hydrogen column densities that are in excess of the expected interstellar value of in the direction of Cas A (Keohane (1998)). Unless there is significant internal absorption, it would appear that these models are less favored. For the power-law models, the slope is generally steep with a photon index . In combination with a blackbody component with the Hydrogen column density fixed at the expected value, the power-law component is not unusually steep, but also does not dominate the flux. The luminosity emitted at the source (corrected for interstellar absorption, and assumed to be isotropic) varies between a few to several times , except for the models with a steep power-law component, for which this luminosity is .222Luminosities are 0.1-10.0 keV assuming a distance of 3.4 kpc for Cas-A, except for the blackbody case where the bolometric luminosity at infinity is given.

The spectral results are consistent with those based on the early ACIS calibration observations reported by Pavlov et al. (2000) and Chakrabarty et al. (2001), with the minor exception that we obtain a somewhat steeper index combined with correspondingly higher absorption for the power-law fits where is unconstrained; this is most likely due to the improved statistics of our longer observation. As found by those authors, the power-law index is significantly steeper and the luminosity lower than is normally found for X-ray pulsars. For the blackbody models, the temperature is too high and the emitting area too small to correspond to the entire surface of a neutron star. The emergent blackbody spectrum will be modified by the atmosphere of the neutron star, however, in a manner dependent on its composition, the strength of its magnetic field, and orientation (e.g., see Pavlov et al. (2000)). In particular, the true temperature can be significantly smaller than would be inferred without accounting for the atmosphere. Even after including these effects in their models, Pavlov et al. found that the emitting area was still too large to be due to surface radiation from the entire neutron star surface, and suggested that the emission is coming predominantly from hot polar caps on the neutron star. The consistency of our spectral parameters with those obtained by Pavlov et al. for the simple blackbody models supports this conclusion.
3 Interpretation
As discussed above, the evidence for the existence of a pulsar in Cas A is statistically weak, and the frequency of its possible period and the degree of luminosity modulation are highly uncertain. Pavlov et al. (2000) suggest that the source is a neutron star with hot spots. This model is consistent with the spectral data and could result in an oscillatory light curve like the one we observe, though our data imply only a modest luminosity modulation, and such models will usually have a strong modulation (Chakrabarty et al. (2001)). If our candidate 12 ms period is correct, it would appear unfavorable for the interpretation of the source as an anomalous X-ray pulsar, as suggested by Chakrabarty et al. (2001), since these objects tend to have long periods on the order of seconds. Likewise, it would tend to exclude neutron star accretion models with high magnetic fields, since such models require slow rotations to avoid centrifugal expulsion of the accreted material. Accretion onto a low field neutron star model would still appear to be viable.
Without additional observational evidence, however, any interpretation based on the existing data is speculative. A follow up Chandra observation of Cas A with the HRC-S (Timing) has been approved in Cycle 2. It is scheduled for September 2001.
3.1 Example Calculations
Despite the disclaimers cited above, we have taken what we consider to be the most likely period (12.155526 msec) extracted from our observations to calculate possible physical parameters for a putative Cas A pulsar. If we assume that the Cas A pulsar is a classical magnetic dipole (Pacini (1967); Ostriker & Gunn (1969)) and if we use the empirical relationship between the nebula X-ray luminosity () and the spin down energy () given by Seward & Wang (1988) , or the relationship between the pulsar luminosity and the spin down energy given by Becker & Truemper (1997), then we can estimate the following properties for this object (we use and for a nominal neutron star):
-
1.
We can place an upper limit to any synchrotron X-ray nebula based on the HRC or ACIS images as described in Section 2.1:
- 2.
-
3.
From this estimate we calculate (taking ):
-
4.
Using the historical age for Cas A :
The above calculations are illustrative. They depend on the initial assumptions regarding the validity of the classical magnetic dipole model for the pulsar, and the estimated spin-down luminosity. The lack of an observable X-ray synchrotron nebula suggests that the magnetic field of the Cas A pulsar is considerably less then typical (e.g., as for the Crab), and is consistent with the above estimate. However, without a confirmation of the pulse period, and a determination of the pulsar spin down rate, additional interpretation and analysis is too speculative to merit further discussion. We note that given the precision with which the putative pulse period is measured (), an observation of Cas A in Chandra Cycle 2 will provide an adequate baseline to measure to the limits suggested by the above calculations.
4 Conclusions
The point-like source near the center of Cas A has been observed for 50 ksec using the Chandra X-ray Observatory HRC, operating the HRC-S in a special mode to permit high resolution timing measurements. We find weak evidence for a pulsed signal at a period of 12.155526 msec. The period-folded light curve is approximately sinusoidal and the overall modulation is about 25%. However, at approximately the same significance level there are several period candidates, and we cannot say at this time that the compact central object is indeed a pulsar.
From a 50 ksec ACIS-S observation, the spectrum of the central compact object in Cas A can be fitted to several simple models with more or less equal significance, as in previously published results based on shorter calibration observations. If the 12 ms period is real, the central source probably has a low magnetic field, disfavoring its interpretation as an anomalous X-ray pulsar. Despite the relatively low modulation of the periodic signal, the X-ray emission may be due to local hot spots near the polar caps of the putative neutron star Pavlov et al. (2000).
Assuming that the pulse period is correct, and taking a conservative upper limit for an X-ray synchrotron nebula around the neutron star, we find the surface magnetic field to be small ( ), and the spin down rate also to be small ( ). If confirmed in a follow up observation (Chandra Cycle 2) these values also imply that the pulsar was initially spinning with a period close to 12 msec.
References
- Becker & Truemper (1997) Becker, R. H. and Truemper, J. 1997 A&A326, 682
- Chakrabarty et al. (2001) Chakrabarty, D., Pivovaroff, M. J., Hernquist, L. E., Heyl, J. S., and Narayan, R. 2001, ApJ 548,800
- Fabian et al. (1980) Fabian, A. C., Willingale, R., Pye, J. P., Murray, S. S., and Fabbiano, G. 1980, MNRAS 193,175
- Garmire (1997) Garmire, G. G. 1997, BAAS 190,34.04
- Gregory & Loredo (1992) Gregory,P.C., and Loredo, T.J. 1992, ApJ 398,146
- Gregory & Loredo (1996) Gregory,P.C., and Loredo, T.J. 1996, ApJ 473,1059
- Juda et al. (2000) Juda, M., Austin, G., Chappell, J., Gomes,J., Kenter, A., Kraft,R., Murray, S.S., and Zombeck, M. 2000, Proc. SPIE 4140, 155
- Kaplan,Kulkarni, & Murray (2001) Kaplan, D. L., Kulkarni, S. R., Murray, S. S. 2001, ApJ submitted for publication(astro-ph/0102054)
- Keohane (1998) Keohane, J. T. 1998, PhD Thesis, University of Minnesota
- McLaughlin et al. (2001) McLaughlin, M. A., Cordes, J. M., Deshpande, A. A., Gaensler, B. M., Hankins, T. H., Kaspi, V. M., and Kern, J. S. 2001, ApJ 547,L41
- Murray et al. (1979) Murray, S. S., Fabbiano, G., Epstein, A., Giacconi, R., and Fabian, A. C. 1979, ApJ 234, L69
- Murray et al. (1998) Murray, S. S., Chappell, J. H., Kenter, A., Kraft, R., Meehan, G., and Zombeck, M. 1998, Proc. SPIE 3356,974
- Murray (2000) Murray, S. S. 2000, HRC Timing Problem Fix, Chandra X-ray Observatory announcement http://asc.harvard.edu/udoc/status.html
- Murray et al. (2000) Murray, S.S., Chappell, J., Kenter, A., Juda, M., Kraft, R., Zombeck, M., Meehan, G., Austin, G., and Gomes, J. 2000, Proc. SPIE 4140, 144
- Ostriker & Gunn (1969) Ostriker, J. P. and Gunn, J. E. 1969, ApJ 157,1395
- Pacini (1967) Pacini, F. 1967, Nature 216,567
- Pavlov et al. (2000) Pavlov, G. G., Zavlin, V. E., Aschenbach, B., Trümper, J., and Sanwal, D. 2000, ApJ 531,53
- Ransom (2001) Ransom, S. Harvard University, Department of Astronomy PhD Thesis, 2001
- Rots (2001) Rots, A. 2001, private communication
- Ryan,Wagner, & Starrfield (2001) Ryan, E., Wagner, R. M., Starrfield, S. G. 2001, ApJ 548,811
- Seward (2000) Seward, F. D. 2000, HRC Timing Problem, Chandra X-ray Observatory announcement http://asc.harvard.edu/udoc/status.html
- Seward & Wang (1988) Seward, F. D. and Wang, Z. 1988, ApJ 332,199
- Shapiro & Teukolsky (1983) Shapiro, S. and Teukolsky, S. , 1983, “Black Holes, White Dwarfs, and Neutron Stars”, John Wiley and Sons
- Tananbaum (1999) Tananbaum, H. D. 1999, IAU Circ. 7246
- Tennant et al. (2001) Tennant, A. F., Becker, W., Juda, M., Elsner, R. F., Kolodziejczak, J. J., Murray, S. S., O’Dell, S. L., Parells, F., Swartz, D. A., Shibazaki, N., and Weisskopf, M.C. 2001, ApJ submitted for publication
- Vikhlinin, Forman, & Jones (1994) Vikhlinin, A., Forman, W., and Jones, C. 1994, ApJ 435,162
- Zombeck et al. (1995) Zombeck, M. V., Chappell, J. H., Moore, R., Murray, S. S., Fraser, G. W., and Serio, S. 1995, Proc. SPIE 2280,96