The 2dF Galaxy Redshift Survey: The population of nearby radio galaxies at the 1 mJy level
Abstract
We use redshift determinations and spectral analysis of galaxies in the 2dF Galaxy Redshift Survey to study the properties of local radio sources with mJy. 557 objects (hereafter called the spectroscopic sample) drawn from the FIRST survey, corresponding to per cent of the total radio sample, are found in the 2dFGRS catalogue within the area and , down to a magnitude limit . The excellent quality of 2dF spectra allows us to divide these sources into classes, according to their optical spectra.
Absorption line systems make up 63 per cent of the spectroscopic sample. These may or may not show emission lines due to AGN activity and correspond to “classical” radio galaxies belonging mainly to the FRI class. They are characterized by relatively high radio-to-optical ratios, red colours, and high radio luminosities (). Actively star-forming galaxies contribute about 32 per cent of the sample. These objects are mainly found at low redshifts () and show low radio-to-optical ratios, blue colours and low radio luminosities. We also found 18 Seyfert 2 galaxies (3 per cent) and 4 Seyfert 1’s (1 per cent).
Analysis of the local radio luminosity function shows that radio galaxies are well described by models that assume pure luminosity evolution, at least down to radio powers . Late-type galaxies, whose relative contribution to the RLF is found to be lower than was predicted by previous works, present a luminosity function which is comparable with the IRAS galaxy LF. This class of sources therefore plausibly constitutes the radio counterpart of the dusty spirals and starbursts that dominate the counts at 60 m.
keywords:
Galaxies: active – Galaxies: starburst – Cosmology: observations – radio continuum galaxies1 Introduction
During the last twenty years, several attempts have been made to model the space density and evolution of radio sources. These attempts have mainly followed two well defined tracks, where the first class of models (Orr & Brown 1982; Padovani & Urry 1992; Maraschi & Rovetti 1994, Wall & Jackson 1997 just to mention a few) base their predictions on the unification paradigm which originates from the ‘relativistic jet’ model of Blandford & Rees (1978), while the second one (Wall, Pearson & Longair 1980; Danese et al. 1987; Dunlop & Peacock 1990; Condon 1984; Rowan-Robinson et al. 1993) relies on the evolutionary properties of the galaxy hosting the radio source.
One of the main limitations affecting both classes of models (especially those from the unification paradigm) is the fact that they were mainly based on datasets including very bright sources ( Jy). As a consequence, the low-power tail of the AGN radio luminosity function is poorly defined, and their predictions at faint flux densities diverge. Some of the models belonging to the second class (e.g. Danese et al. 1987; Condon 1984; Rowan-Robinson et al. 1993) have pushed their analysis down to much lower flux densities ( mJy), and assume the contribution to the radio population at mJy to be principally given by a new class of objects which greatly differs from the radio AGN which dominate at higher fluxes. The limited statistical samples that are available at such faint flux densities, mean that the nature of this population has remained an issue of debate. For instance, Condon (1984) suggests a population of strongly-evolving normal spiral galaxies, while others (Windhorst et al. 1985; Danese et al. 1987; Rowan-Robinson et al. 1993) claim the presence of an actively star-forming galaxy population.
More recently, great efforts have been made to determine the photometric and spectroscopic properties of radio sources at mJy levels and fainter (Gruppioni et al. 1999; Georgakakis et al. 1999; Magliocchetti et al. 2000; Masci et al. 2001). These studies have proven extremely useful in characterizing the populations of radio sources but, once again, the limited statistical samples over small areas of the sky leave significant uncertainties such as the relative contribution of actively star-forming galaxies to the total mJy counts.
The advent of large area radio surveys which probe the radio sky down to mJy levels (e.g. FIRST, Becker, Helfand & White 1995; NVSS, Condon et al. 1998; SUMSS, Bock et al. 1999) overcomes these small sample limitations which have affected studies of faint radio sources up to now. This can be achieved with multi-wavelength follow-ups of large samples of sources drawn from such wide-area surveys. In particular, the acquisition of optical spectra enables to derive spectral types, luminosity functions and redshift distributions for the different radio-populations.
The first results in this direction are given by Sadler et al. (1999) who use spectra from the 2dF Galaxy Redshift Survey (Maddox 1998, Colless et al. 2001) to investigate the nature of 127 radio sources drawn from the NVSS survey down to mJy. More recently this analysis has been extended to include 912 candidate optical counterparts to NVSS sources (Sadler et al. 2002). The present paper follows a similar approach, and presents results for a subsample of 557 sources taken from the FIRST radio catalogue. The FIRST survey includes radio sources that are up to 3 times fainter than the NVSS, and the accuracy of the FIRST radio positions is much better than the NVSS, which means that the likelihood of correct identifications is significantly improved. On the other hand, the NVSS overlaps a much larger area of the 2dF survey, giving a larger sample of objects to study. For both samples, the 2dF survey spectra provide information on the composition of the radio population associated with optical counterparts brighter than . Redshift determinations further allow us to estimate quantities such as luminosity functions and redshift distributions for the different classes of sources contributing to the local population (the 2dF Galaxy Redshift Survey samples galaxies up to ; Colless et al. 2001).
The layout of the paper is as follows: Section 2 briefly introduces the surveys which provided the data (Section 2.1 and 2.2) and describes the procedure we adopted to obtain the spectroscopic counterparts of a subsample of FIRST radio sources (Section 2.3). Section 3 illustrates the optical and spectroscopic properties of the objects in the sample, while Section 4 deals with their radio properties and present the results for the local radio luminosity function, obtained by comparing our data with model predictions for different classes of sources. Finally, Section 5 is devoted to the analysis of the observed redshift distributions and Section 6 summarizes our conclusions. Throughout the paper we will assume and , where .
2 The Datasets
2.1 The 2dFGRS
The 2dF Galaxy Redshift Survey (2dFGRS: Maddox 1998; Colless et al. 2001) is a large-scale survey aimed at obtaining spectra for 250 000 galaxies to an extinction-corrected limit for completeness of over an area of 2151 square degrees. The survey geometry consists of two broad declination strips, a larger one in the SGP covering the area , and a smaller one set in the NGP with , , plus 100 random 2-degree fields spread uniformly over the 7000 square degrees of the APM catalogue in the southern Galactic hemisphere.
The input catalogue for the survey is a revised version of the APM galaxy catalogue (Maddox et al. 1990a, 1990b, 1996) which includes over 5 million galaxies down to in both north and south Galactic hemispheres over a region of almost 104 square degrees. The astrometric rms error for galaxies with is 0.25 arcsec, while the photometry of the catalogue has a precision of about 0.15 mag for galaxies within the same magnitude limits. The mean surface brightness isophotal detection limit of the APM catalogue is .
Redshifts for all the sources brighter than are determined in two independent ways, via both cross-correlation of the spectra with specified absorption-line templates (Colless et al. 2001) and by emission-line fitting. These automatic redshift estimates have then been confirmed by visual inspection of each spectrum, and the more reliable of the two results chosen as the final redshift. A quality flag was assigned to each redshift: , and correspond to reliable redshift determination, means a probable redshift and indicates no redshift measurement. The success rate in redshift acquisition for the surveyed galaxies (determined by the inclusion in the 2dF sample of only those objects with quality flags to ) is estimated about 95 per cent (Folkes et al. 1999). The median redshift of the galaxies is 0.11 and the great majority have . In this work we use the version of the catalogue derived from the November 1997 to January 2001 observations of the north galactic cap equatorial area, which includes 35,347 galaxies.
2.2 The Radio Data
The input catalogue for the radio data has been obtained by matching together sources in the FIRST and APM catalogues as extensively described in Magliocchetti & Maddox (2002).
Briefly, the original radio catalogue comes from the FIRST (Faint Images of the Radio Sky at Twenty centimetres) survey (Becker et al. 1995). The latest release (5 July 2000) of the catalogue covers about 7988 square degrees of the sky in the north Galactic cap and equatorial zones, including most of the area , and , , and comprises approximately 722,354 sources down to a flux limit mJy, with a 5 source detection limit of mJy. The catalogue has been estimated to be 95 per cent complete at 2 mJy and 80 per cent complete at 1 mJy (Becker et al. 1995).
Optical counterparts for a sub-sample of FIRST radio sources have then been obtained by matching together objects included in the radio catalogue with objects coming from the APM survey. Since the APM and FIRST surveys only overlap in a relatively small region of the sky on the equatorial plane between and , the search for optical counterparts was restricted to this area.

Out of approximately 24,000 radio sources with mJy in the considered area, Magliocchetti & Maddox (2002) find 4075 identifications – corresponding to 16.7 per cent of the original sample – in the APM catalogue for and for a matching radius of 2 arcsec. This last value was chosen after a careful analysis of the distribution of the residuals , between the positions of radio and optical sources. The rms value of the – distribution is found to be 0.7 arcsec, which is consistent with the uncertainty obtained by summing the positional uncertainties of the FIRST ( arcsec) and APM ( arcsec) surveys in quadrature and taking into account a small distortion between the radio and optical reference frames. So a 2 arcsec match radius is equivalent to about , which should include of the true identifications. Furthermore, using this match radius limits the number of random coincidences to a negligible per cent (225 sources out of 4075). To ensure uniform completeness over the optical survey, we restricted the analysis to objects with , leading to 3176 identifications.
Since the adopted version of the APM data includes magnitude measurements only in the band, R magnitudes were then assigned to the optical identifications by making use of the -R colour estimates given in APMCAT (found online at http://www.ast.cam.ac.uk/ ∼apmcat Irwin et al.). This version of the APM data has been processed to provide accurate stellar magnitudes, and so the galaxy magnitudes are not so reliable, but it does include both R and UKST plates. Since the data are not designed for galaxy work, these colours have a rather large uncertainty, but nevertheless provide interesting information.
In the magnitude range image profiles were used to separate galaxies from stars as described by Maddox et al. (1990a). For galaxy profiles do not greatly differ from stellar profiles and the classification becomes unreliable. So, for we divide the radio sources into stellar-like objects, expected to be mostly high redshift QSO (535 objects) and radio galaxies (1494 objects), expected to lie within . The radio-to-optical ratios and colours of the stellar identifications are consistent with them being mostly high redshift QSOs.
2.3 The Spectroscopic Sample
In order to obtain redshift measurements and spectral features for those radio sources with an optical counterpart (hereafter called photometric sample) as described in Section 2.2, we looked for objects in the 2dF catalogue with positions which differed by less than 2 arcsec from positions of sources in the photometric sample. The choice of this value for the matching radius is based on the 2 arcsec diameter of each 2dF fibre. Indeed we found all the matched objects to have positional offsets of maximum 1 arcsec, with a rms of arcsec. Fig. 1 shows the distribution of the residuals , between the positions of sources in the photometric and 2dF catalogues. The bottom panel represents the - distribution, while the middle and top panels show the number of matches respectively as a function of and offsets. As already discussed, all the offsets lie within , with arcsec rms. The shift of the median offset of the distribution from the zero values, more prominent along the axis, is due to adjustments in the astrometry for galaxies in the 2dF survey relative to those included in the earlier version of the APM catalogue from which the photometric sample was drawn.

Out of 971 input sources from the photometric catalogue with and mJy, we were then able to obtain redshifts for 557 objects, 53 per cent of the original sample. Fig. 2 shows the projected distribution of radio sources in the photometric sample with ; filled circles identify those objects for which redshift estimates and spectral classifications were available. We remark here that the reason for such an apparent incompleteness in the redshift determination is mainly due to incomplete sky coverage, as there are areas which have not yet been observed by the 2dFGRS. Less that 40 objects from the input sample with could in fact have been missed due to the completeness level of the redshift survey ( per cent; Colless et al. 2001).
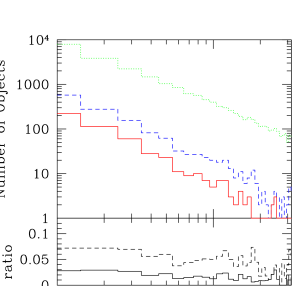
To test for both radio-flux and magnitude biases in the determination of the photometric and spectroscopic samples, we show the number of radio sources respectively per flux and magnitude unit in Figs 3 and 4. In Fig. 3, the dotted line has been obtained from the original FIRST catalogue for all those sources enclosed in the equatorial region defined in Section 2, while the dashed line illustrates the case for the photometric sample () and the solid line represents the spectroscopic sample. In Fig. 4, the dashed and solid lines are for the photometric and spectroscopic samples respectively. In each Figure the lower panel shows the ratio of number counts in each sample. The ratio of spectroscopic to photometric sources remains constant with magnitude up to , but there is a weak trend for there to be more identifications at faint radio fluxes. It is not entirely clear what causes this trend; one possibility could be the fact that fainter optical objects are in general associated with brighter radio sources (e.g. high-z ellipticals – see later in Section 3 and 4). Whatever the reason, we can confidently exclude the presence of any strong bias in the radio-flux or magnitude distribution, first of all for the optical counterparts of radio sources (as already discussed in Magliocchetti & Maddox 2002) and also for the subset for which we have their redshifts. As a final remark, note that Fig. 4 shows a tendency for the number of sources both in the photometric and spectroscopic samples to flatten for magnitudes . As will be discussed in Section 4, this behaviour is due to the absence of optically faint star-forming galaxies in the FIRST survey.
Before carrying on with our analysis, it is worthwhile mentioning an important issue which needs to be taken into account when dealing with objects coming from the FIRST survey related to flux measurements. The high resolution of the survey in fact implies that some of the flux coming from extended sources could be either resolved out or split into two or more components, leading to a systematic underestimate of the real flux densities of such sources (Condon et al. 1998). This effect has been partially corrected for by using the method developed by Magliocchetti et al. (1998) to combine multicomponent sources. However, despite this correction, it turns out that fluxes as derived from the FIRST survey were on average still lower than those measured by the NVSS survey (which, having a lower resolution, should not be affected by this effect) by a factor of about 1 mJy in the case of sources brighter than 3 mJy, and about 30 per cent of the measured flux for sources with 3 mJy (Jackson et al. 2002). We therefore corrected the estimated flux densities by making use of the above quantities and, while for consistency reasons throughout the paper we will keep using the flux densities as measured by the FIRST survey, in the calculation of high-precision quantities such as the radio luminosity function (see Section 4), we will rely on these corrected values. It is nevertheless worth stressing that such corrections do not affect any of the results presented in this paper (including the luminosity functions) by more than a negligible factor, generally much lower than other uncertainties associated with the various measurements.

3 optical and spectral properties of the sample
All the 557 radio sources identified in the 2dF catalogue are presented in Tables 1 and 2 at the end of the Paper. For each object the Tables indicate:
(1) Source number
(2) Right Ascension (J2000)
and Declination (J2000). Note that
these correspond to the
FIRST radio coordinates, except in the case of objects with double or triple
sub-structures, where the coordinates are of the centroid of the source and
are obtained by following the procedure illustrated by Magliocchetti et
al. (1998) to combine multi-component objects.
(3) Offset (expressed in arcsecs) of the optical counterpart in the APM
catalogue.
(4) Radio-flux density (in mJy units) at 1.4 GHz.
(5) Apparent and, when present, (6) R magnitudes of the optical
counterpart.
(7) Redshift.
(8) Spectral Classification. It is worth remarking here that, as Madgwick et al.
(2001) have recently shown, the fibre spectral classification inconsistency claimed
by Kochanek, Pahre & Falco (2001) is not a problem for 2dFGRS. We refer
the reader to Madgwick et al. (2001) for further discussion on this point.
(9) Emission lines detected ordered from the most to the least prominent. Note
that the [N] line appears in the Tables only if its intensity
was comparable with the H one.
(10) Notes on morphological appearance.
The point (10) has been obtained by visual inspection of the radio (R, from the FIRST atlas) and optical (O, from the Digitized Sky Survey) images of each source. Blank spaces correspond to point-like structures as observed both in the radio and optical bands. Radio images have been classified as Extended whenever it was possible to detect any extended structure, Double if the source presented the two characteristic lobes, Core+lobes if also the central component of the radio source was present and Jets/Core+Jets if the structures pointing towards the lobes were visible. In a few cases, the ‘?’ indicates uncertainty to distinguish between genuine double/triple structures and the presence of side-lobes.
From the optical point of view, galaxies have been classified as Spiral whenever the presence of spiral arms was visible or Disk+bulge if the image clearly resolved the galaxy into the two components, Irregular if they presented distorted morphologies, Merging if there were signatures of either merging or accretion of a smaller unit, and Interaction whenever two or more galaxies were interacting with each other. Again, the ‘?’ indicates dubious classifications.


Classes for the optical counterparts of radio sources (column 10 of Tables 1 and 2) have been assigned on the basis of their 2dF spectra. Spectra have been compared with known templates (see e.g. Kennicut 1992; McQuade et al. 1995) which allowed galaxies to be divided into 6 broad categories:
-
(1)
Early-type galaxies, where spectra were dominated by continua much stronger than the intensity of any emission line. These objects can be furtherly divided into two sub-classes:
(i) galaxies with absorption lines only.
(ii) galaxies with absorption lines + weak [O] and H emission lines denoting little star-formation activity. -
(2)
E+AGN-type galaxies, showing spectra typical of early-types plus the presence of (narrow) emission lines such as [O], [O], [N] and [S], which are strong if compared to any Balmer line in emission and indicate the presence of large, partially ionized transition regions as is the case in active galaxies.
-
(3)
Late-type galaxies, where spectra show strong emission (mainly Balmer) lines characteristic of star-formation activity, together with a detectable continuum.
-
(4)
Starburst (SB) galaxies, with optical spectra characterized by an almost negligible continuum with very strong emission lines indicating the presence of intense star-formation activity.
-
(5)
Seyfert 1 galaxies, with spectra showing strong, broad emission lines.
-
(6)
Seyfert 2 galaxies, where the continuum is missing and spectra only show strong narrow emission lines due to the presence of an active galactic nucleus.


Lastly, we also found 3 galactic stars, probably due to random positional coincidences with extragalactic radio sources.
Distinctions amongst different classes of sources and in particular amongst E+AGN, Seyfert 2 and Late-type galaxies have relied on the diagnostic emission line ratios of Veilleux & Osterbrock (1987), Waltjer (1990) and Rola Terlevich & Terlevich (1997) (where this last approach, based on the relative intensity of H, has been adopted whenever the H line would fall off the spectrum, i.e. for ). Note that a definite classification was not possible for all the cases. This simply reflects the fact that it is in general quite common to find ‘composite’ galaxies containing both an AGN and ongoing star formation (see e.g. Hill et al. 2001).
The photometric properties of the different classes which constitute the spectroscopic sample are illustrated by Figs 5 and 6. In all the plots, symbols are as follows: empty circles for early-type galaxies, filled ones for E+AGN, filled triangles for late-type galaxies, filled squares for starbursts, empty squares for Seyfert 2 and crosses for Seyfert 1 objects. Note that we did not include here the small number of uncertain classification sources.
Fig. 5 respectively shows magnitudes versus radio flux at 1.4 GHz (top panels) and redshift (bottom panels) for the different classes of objects in the spectroscopic sample; left-hand panels are for early and E+AGN galaxies, middle ones for late-type and starburst galaxies, while the right-hand panels represent the populations of Seyfert 1 and Seyfert 2 galaxies. The dashed lines (in the top panels) indicate the loci of constant radio-to-optical ratios , where S is expressed in mJy and . Note that z and trends for the different classes of sources are not presented here, as they simply reproduce the same features already shown in Fig. 5. Figs 6 instead represents colours for the different populations as a function of radio flux (top panels) and redshift (bottom panels). Symbols are as in Fig. 5.
As one can notice from Figs 5 and 6, different classes of objects
occupy different regions on the various , -z, etc. planes;
this is due to intrinsic characteristics of the various populations
which we summarize here:
(1) Early-type galaxies.
This class comprises 289 objects and makes up 52 per cent of the whole
spectroscopic sample. On average,
sources belonging to this population have relatively high
values for the radio to optical ratio () and are
preferentially found at redshifts .
The majority of these sources show rather red colours
(), with a tendency to be redder at larger look-back
times. Their radio fluxes lie in the range , even though objects are found up to mJy, and
optically they appear as relatively faint (about 60 per cent of the
sources has ). The z relation in this case
(represented by the dashed line in the bottom-left panel of Fig. 5)
is well described by the relation
| (1) |
( is the luminosity distance, and is the absolute magnitude
in the -band). A fit to the data performed with as
free parameter gives, for an , universe,
with little scatter about this value ( mag). This result is in very good agreement with
previous estimates (see e.g. Rixon, Benn & Wall 1991; Gruppioni et
al. 1999; Georgakakis et al. 1999; Magliocchetti et al. 2000),
showing that passive radio galaxies are reliable standard candles.
(2) E+AGN galaxies.
There are 61 objects in this class, corresponding to 11 per cent of
the spectroscopic sample. These sources are directly connected to the
class of early-type galaxies, even though they show characteristics
that are intermediate between pure AGN-fuelled sources and
star-forming galaxies. Optically they appear as rather faint and
closely follow the standard-candle relationship found for early-type
galaxies ( mag).
However their radio-to-optical ratios are in general as low
as those obtained for late-type galaxies. Their radio fluxes are in
general quite low ( mJy) and their colours are
uniformly distributed between about 0 and 2.
(3) Late-type galaxies and starbursts.
This class comprises 177 objects (including 10 SB), which is
per cent of the spectroscopic sample. The radio-to-optical ratios
for these sources have values between 60 and 103, in general
smaller than that found for early-type galaxies. Their radio fluxes
are rarely brighter than mJy and optically they have
bright apparent magnitudes (very few objects are found with ). These sources have quite blue colours, , and are mostly local – the majority of them being found within
. Furthermore,
do not follow the z relation
found for early-type galaxies, illustrated by the dashed line in the
middle panel at the bottom of Fig. 5. For these objects one in fact finds
mag.
(4) Seyfert galaxies.
The sample contains 18 Seyfert 2 and 4 Seyfert 1 galaxies, making up
and per cent of the sample respectively. Their
radio-to-optical ratios are quite high, and in the case of all but one
Seyfert 1 galaxy, one finds . Their colours range
between as in the case for E+AGN galaxies,
and they seem to follow the z relationship found for early-type
galaxies (bottom-left panel of Fig. 5). Seyfert 2 galaxies in
general have low-to-intermediate radio fluxes, while Seyfert 1’s show
higher values for . Note that one Seyfert 1 galaxy (number 331 437
of the spectroscopic sample) is found at , well beyond the
typical limit of the 2dFGRS, .
The above findings for the relative contribution of the different classes of sources to the local radio population are in good general agreement with the results of Sadler et al. (2002) for a sample of NVSS/2dFGRS galaxies. However, Sadler et al. (2002) find approximately 40 per cent are starforming galaxies, the increased fraction almost certainly being due to the lower-resolution NVSS survey which will detect (or catalogue) low surface brightness sources at the lowest flux densities.
Some information on the above classes of sources can also be derived from the few optical images showing resolved structures. For instance, it is interesting to note that the majority of the interacting/merging systems seem to be associated with early-type spectra, typical of pure AGN-fuelled sources, suggesting that merging, under appropriate conditions, can trigger AGN activity even at low redshifts. Also, as expected, irregulars and spirals preferentially show spectra typical of late-type galaxies; signatures of interaction and/or merging are seen for members of this latter population as well as for E+AGN galaxies. Interaction/merging is also observed for one of the four Seyfert 1 galaxies and two Seyfert 2’s. Furthermore we find one Seyfert 2 to be associated to the classical two-lobed radio image.
Note that in a few cases, early-type/E+AGN galaxies are found to correspond to spiral morphologies. This is simply due to our classification criteria which is based solely on the spectra; typical spectra of Sab spiral galaxies can be very similar to early-type galaxies with [O] and H emission lines. Finally, radio images show that there is a clear trend for extended/sub-structured sources to be associated with absorption systems (i.e. early-type galaxies).
4 radio properties of the sample

More information on the nature of the sources in the spectroscopic sample can be inferred by investigating radio properties such as the distribution of their radio powers and the radio luminosity function (hereafter denoted as LF).
From investigation of the radio-flux distribution as a function of redshift for the different populations as inferred from Fig. 5 (top and bottom panels), we note that in general Seyfert 1 and early-type galaxies show higher radio fluxes compared to the other classes of sources. There is also a tendency for late-type and SB galaxies to be only present in the local universe, as already mentioned. No other distinction amongst the different populations is evident in the data.
Radio powers have been calculated according to the relation , and are expressed in units. In the above formula, is the angular diameter distance and is the spectral index of the radio emission (). As we did not have measured values for this latter quantity, we assumed for Seyfert 1 galaxies, for early-type galaxies (with or without emission lines due to AGN activity), for Seyfert 2’s and both for late-type galaxies and starbursts (see e.g. Oort et al. 1987). Note however that, since the redshift range is relatively small, the results do not depend on the precise values of the spectral index. Fig. 7 shows the distribution of radio luminosities for the different classes of sources. In the top panel, the shaded histogram corresponds to the distribution of Seyfert 1 galaxies, while in the second panel from top it represents the population of SB galaxies (not very clearly seen due to the small number of sources). As one can see from the Figure, early-type galaxies show in general higher radio powers (, extending up to ) than late-type ones, whose majority presents . E+AGN sources are instead characterized by luminosities with values closer to those found for early-type galaxies (). The bulk of the Seyfert 2 distribution is obtained for , while Seyfert 1 galaxies all have . We note that the apparent cut in the luminosity distribution at is simply due to the 1 mJy limit adopted for sources in the original radio sample ( mJy corresponds to for , redshift of the nearest object in the spectroscopic sample).
It is worth remarking here that all the objects included in the spectroscopic sample (apart from the one Seyfert 1 found at ), have . In the case of “classical” radio sources (i.e. if one excludes late-type galaxies and starbursts from the analysis, since the radio signal stems from non-AGN activity) this implies the overwhelming majority of early and E+AGN galaxies to belong to the class of FR I sources (Fanaroff & Riley 1974). In fact, although the distinction between FR I and FR II sources seems to be more complicated than just based on their radio power – as in general optically brighter FR I also tend to appear as more luminous in the radio band (see e.g. Ledlow & Owen 1996) – we note that for only members of FR I are found, independent of their magnitude.
Also, from a morphological point of view, we find that very few objects in the sample (about 5 percent) show composite structures such as lobes or jets. The angular resolution of the FIRST survey is about 5 arcsec which, for the cosmology adopted in this Paper, corresponds to a physical scale of kpc at and kpc at (the maximum redshift found for galaxies in the 2dFGRS). Thus for all the sources showing point-like images in the radio, one can exclude the presence of very extended structures such as those typical of FR II sources.
The local radio LF for objects in the spectroscopic sample has then been derived by grouping the sources in bins of width , according to the expression
| (2) |
where is the number of objects with luminosities between and and is the maximum comoving volume within which an object could have been detected above the radio-flux and magnitude limit of the survey (Rowan-Robinson 1968). As already stated in Section 2, for the radio-flux limit we set mJy, value at which the incompleteness of the original radio catalogue has been well assessed to be , while – derived for 2dFGRS galaxies – is the chosen magnitude limit. Note that this value could be transformed into a rough redshift estimate for completeness of the spectroscopic sample, , under the assumption of radio galaxies as standard candles with (see equation 1 and Fig. 5).
For each source we then estimated the maximum redshift at which it could have been included in the sample, , where and are the redshifts at which the source would disappear from the sample respectively due to radio and optical limiting flux densities. For the optical K-corrections we adopted, under the assumption of spectra of the form , for early-type galaxies, for late-type galaxies and for Seyferts (both type 1 and 2; see Rowan-Robinson 1993).
In principle, in order to derive the local LF, one should de-evolve the luminosity of each source at according to expressions such as (where in this case we assumed pure luminosity evolution), where is is the look-back time in units of the Hubble time and is the time-scale of the evolution in the same units. However, given the limited redshift range spanned by the sources in the spectroscopic sample, we assumed no evolution (i.e. ) for all the classes of objects and therefore set .


The values for the LF obtained as in equation (2) have then been corrected respectively by means of the factor to take into account the 80 per cent completeness of the FIRST survey for sources between 1 and 2 mJy, for sources between 2 and 3 mJy and simply 556/971 for sources brighter than 3 mJy (see Becker et al., 1995), where the ratio 556/971 indicates the fraction of objects with observed by the 2dFGRS in the considered area (see Section 2.3), and reported in Table 1 (first column).
Fig. 8 shows the results for the whole spectroscopic sample, with error bars showing the Poisson errors. The dashed line indicates the prediction from Rowan-Robinson et al. (1993) who consider a luminosity function of the form:
| (3) |
where
| (4) |
(illustrated in Fig. 8 by the dashed-dotted line) is the LF for steep spectrum FR I+FR II sources as given by Dunlop & Peacock (1990) under the assumption of pure luminosity evolution. The evolving ‘break’ luminosity is given by (in units) which, since we have assumed no evolution, reduces to the value corresponding to , and
| (5) |
with , 111This value has
been obtained after correcting the typing error in Rowan-Robinson et
al. (1993; Rowan-Robinson, private communication).,
, , is the luminosity function for the
population of spirals/starbursting galaxies as derived for IRAS
sources by Saunders et al. (1990). Note that we also considered a
of the form given by Dunlop & Peacock (1990), even
though we do not show its trend in Fig. 8 given the
unrealistic overprediction of the number of sources for .
We note that none of the models can accurately describe the data. The Dunlop & Peacock (1990) predictions for radio galaxies underestimate the number density of objects for , while the Rowan-Robinson et al. (1993) model, although able to reproduce the departure of the observed LF from the power-law behaviour for , overpredicts the number density of sources with faint luminosities.
| Complete sample | Early-type | E/E+AGN | Late-type | ||||||
|---|---|---|---|---|---|---|---|---|---|
| log10P | log | NAll | log | NEarly | log | NE/E+AGN | log | NLate | |
| 20.6 | 8 | 2 | 5 | 3 | |||||
| 21.0 | 29 | 4 | 7 | 22 | |||||
| 21.4 | 57 | 11 | 17 | 39 | |||||
| 21.8 | 131 | 49 | 65 | 66 | |||||
| 22.2 | 132 | 81 | 98 | 28 | |||||
| 22.6 | 102 | 74 | 84 | 12 | |||||
| 23.0 | 53 | 38 | 44 | 6 | |||||
| 23.4 | 21 | 19 | 21 | ||||||
| 23.8 | 11 | 6 | 7 | 2 | |||||
| 24.2 | 4 | 4 | 4 |
With the aim of investigating this result in more detail, we have then divided radio sources according to their spectral classification, and evaluated the local LF for each population taken individually. As in the case for the whole sample, values for the different classes of objects are illustrated in Table 1. Fig.9 shows the results for the early-type (lower panel), early and E+AGN (middle panel) and late-type+SB (top panel) galaxies. The dashed lines in the bottom and middle panels of the Fig. are given by equation (4) which only considers the local density of ‘classical’, AGN-fuelled, steep-spectrum radio sources. In this case the agreement with the data is very good down to powers , especially if one includes all the objects which show spectra typical of early-type galaxies, regardless the presence of AGN emission lines.
Late-type/SB galaxies do not show the same power-law trend for the LF as the ‘classical’ radio sources (top panel of Fig. 9). Their LF shows a break at about , beyond which the contribution of this class of objects becomes rapidly negligible. For luminosities fainter than however we note that their spatial density is comparable to that of early/E+AGN-type galaxies. It follows that, for , late-type galaxies and starbursts make for about half of the whole spectroscopic sample.
Note that the sharp break in luminosity explains why late-type radio-emitting sources are only found in the nearby universe, as already noticed in Section 3. In fact, the majority of these objects are not bright enough to show radio fluxes mJy beyond redshifts and therefore were not observed by the FIRST survey. This feature in the LF also provides an explanation for the flattening – obtained for – of the curves describing the number of sources (both in the case of the photometric and spectroscopic samples) per magnitude interval presented in Fig. 4. As already shown by their radio-to-optical ratios, late-type/SB galaxies are in fact faint in radio and, being actively forming stars, bright in the optical bJ-band. The absence of this class of sources for as shown by their LF, implies that they fall out of the spectroscopic (and photometric) sample for only because of their faint radio fluxes and not due to optical magnitudes fainter than the chosen threshold. These objects would obviously appear as optically faint at higher redshifts, but they never reach this stage since they first disappear from the flux-limited radio survey. It therefore follows that, for , only members of the population of early-type and E+AGN galaxies are included in both the photometric and spectroscopic samples, which explains the flattening of Fig. 4.
Finally, note that the last data point at the bright end of the LF for late-type and SB galaxies rises up towards higher spatial densities than predicted. Closer investigation reveals that the two objects responsible for this measurement, even though classified as late-type galaxies on the basis of their line-emission ratios, show spectra where the relative importance of the [O]-[O] lines seems to point out to an ‘intermediate’ case where both AGN and star-formation activity are present within the same galaxy. This could then lead to a radio signal dominated by non-thermal emission, bringing these sources in the class of E+AGN galaxies.
When it comes to a comparison between observed and predicted LF for the population of late-type galaxies and starbursts, one has that predictions from Dunlop & Peacock (1990) (not shown for the reasons explained earlier in this Section) only agree with the data point, grossly overestimating the contribution of this kind of sources at fainter luminosities. A better job is provided by the Rowan-Robinson et al. (1993) model, which can correctly reproduce both the broken power-law behaviour and the break luminosity. However, the slope of the faint-end portion of the predicted LF is too steep and, as previously noticed, this results in an overprediction of the number density of sources at these luminosities.
By using equation (5), we find that the best fit is obtained for , , and (long/short-dashed lines in Fig. 9), not far from the Rowan-Robinson et al. (1993) model, showing that late-type/SB galaxies have to be identified with those spirals and starbursts which dominate the counts at 60 m. The above functional form can also, together with the LF given by Dunlop & Peacock (1990) for the population of ellipticals and represented by equation (4), correctly reproduce the total LF for radio sources in the 2dFGRS as illustrated by the long/short-dashed line in Fig. 8. The agreement however breaks down for , due to the low space density of early- and E+AGN-type galaxies at such faint luminosities.
5 Redshift distribution


Finally, we move on to the analysis of the redshift distribution of sources in the spectroscopic sample. Fig. 10 shows the results for different classes of objects and different flux cuts. In the top-left panel we show the mJy case, in the top-right panel the mJy case, while the bottom-left panel only includes those objects with mJy and the bottom-right panel sources with mJy.
The most striking feature in the various distributions is the drastic reduction of late-type galaxies for radio fluxes between 1 and 3 mJy. The tendency for these sources to be only present at mJy level and fainter was already reported by e.g. Windhorst et al. (1985), Danese et al. (1987), Benn et al. (1993), even though their relative contribution to the total radio population was still an issue under debate. As already noted, one also sees that the distribution of late-type galaxies is very local, peaking at about and quickly fading off beyond redshifts .
Early-type galaxies are instead more distant, only starting to be the dominant population for . They also show a distribution which does not alter its shape for increasing limiting fluxes. E+AGN sources once again constitute an intermediate case between late- and early-type galaxies, and their number is drastically reduced only for fluxes mJy.
As expected, Seyfert 2 galaxies all present low radio fluxes and are evenly distributed between and . Of the three Seyfert 1 included in the spectroscopic sample within , only one has mJy.
The combination of these trends for the different classes of objects gives rise to the total redshift distribution of mJy radio sources within , although we note that the sample looses completeness beyond . This distribution is presented in Fig. 11; as in Fig. 10, the flux limit in the panels increases clockwise from the top-left panel between and mJy. The ‘bump’ shown by all the histograms is principally due to late-type galaxies (with some contamination from E+AGN), while the maximum at which is only present in the mJy plot, is due to superposition of late-type and early-type galaxies in that redshift range. For mJy we see a rather sharp bimodal distribution, with a first maximum – principally due to very local star-forming galaxies which rapidly looses importance as one goes to higher flux cuts – and by a smooth increase in the number of sources with redshift between and , – mainly classical AGN-fuelled galaxies. Above the optical apparent magnitude limit means the sample looses the fainter galaxies.
Fig. 11 shows that the contribution of actively star-forming galaxies (spirals and irregulars) to the local radio population is less important than previously thought (see e.g. Dunlop & Peacock 1990 where the distributions in redshift derived from their seven models for sources with mJy show remarkable ‘spikes’ for as shown by Magliocchetti et al. 2000). Our findings however agree with the results from Jackson & Wall 1999 who claim per cent of the sources at 1 mJy to be starburst/starforming galaxies. As the analysis performed in Sections 3 and 4 indicates, these sources are then most likely to be identified with the radio counterparts of the dusty/starforming IRAS galaxies.
Unfortunately, the question of whether starforming objects are strongly evolving with redshift (as for instance claimed by Rowan-Robinson et al. 1993) or not (see e.g. Dunlop & Peacock 1990) has to be left unanswered since the limited redshift range of the spectroscopic sample does not allow any evolutionary analysis. We note however that the fact that late-type galaxies in the spectroscopic sample are in general found quite locally, seems to argue against positive luminosity evolution, which would make these sources brighter at higher redshifts and therefore observable by a mJy-limited radio survey such as FIRST beyond .
6 Conclusions
In this work we have used data from the 2dF Galaxy Redshift Survey to derive the properties of local mJy radio sources. The radio sample was drawn from the FIRST catalogue and all the objects lie within the area and , where the FIRST and APM surveys overlap. 971 radio sources were found to have optical counterparts brighter than in the APM Galaxy catalogue; the 2dFGRS has then provided spectra and redshift measurements for 557 of them (the spectroscopic sample), up to . We note that this apparent incompleteness is merely due to incomplete sky coverage of the spectroscopic survey, since neither radio nor magnitude biases have been found in the determination of both the optical and spectroscopic counterparts of FIRST radio sources.
Sources in the spectroscopic sample have been divided into three broad classes on the basis of their spectral appearance:
-
(1)
“Classical” radio galaxies (i.e. sources with a spectrum typical of absorption systems plus the eventual presence of emission lines due to AGN activity); 350 objects corresponding to 63 per cent of the sample, appearing for and showing relative high radio-to-optical ratios, red colours and radio powers . These objects – likely to be classical FRI sources – also present absolute magnitudes distributed within a narrow interval around , result which highlights their ‘standard-candle’ nature.
-
(2)
Late-type galaxies and starbursts; 177 objects, corresponding to about 32 per cent of the spectroscopic sample, mainly present in the very nearby universe (), showing blue colours, faint radio luminosities () and low radio-to-optical ratios ().
-
(3)
Seyfert galaxies; 18 Seyfert 2 and 4 Seyfert 1 (one at ) are included in the spectroscopic sample.
When available, radio and optical images have also allowed morphological studies of the sources in the sample. As an interesting result, we find that the majority of the radio sources observed by the 2dFGRS as merging/interacting systems, present spectra typical of early-type galaxies suggesting that, under appropriate conditions, galaxy-galaxy interaction can trigger AGN activity even at low redshifts.
Analysis of the local radio luminosity function for the spectroscopic sample shows that, for , classical radio galaxies are well described by models such as the one introduced by Dunlop & Peacock (1990) for pure luminosity evolution, although we note that no estimate on the evolutionary degree of this population was possible due to the limited redshift range spanned by the 2dFGRS.
Late-type galaxies instead exhibit a broken power-law trend for their luminosity function. Such a break and the rapid decrease of the number density of sources for explains the quick disappearance of this class of objects beyond as shown by their redshift distribution. The observed LF in this case is in agreement with the one derived by Saunders et al. (1990) for IRAS galaxies. This supports the assumption of Rowan-Robinson et al. (1993) that late-type radio galaxies should be identified with the population of dusty spirals and starbursts observed at 60 m.
References
- [Becker et al. 1995] Becker R.H., White R.L., Helfand D.J., 1995, ApJ, 450, 559
- [Benn et al. 1993] Benn C.R., Rowan-Robinson M., McMahon R.G., Broadhurst T.J., Lawrence A., 1993; MNRAS, 263, 98
- [Bland 1978] Blandford R., Rees M.J., 1978, MNRAS, 169, 395
- [Bock et al. 1999] Bock D. C-J., Large M.I., Sadler, E.M., 1999, AJ, 117, 1578
- [Colless 2001] Colless M. et al. (2dFGRS team), 2001, MNRAS, 328, 1039
- [Condon 1984] Condon J.J., 1984, ApJ, 287, 461
- [Condon et al. 1998] Condon J.J., Cotton W.D., Greisen E.W., Yin Q.F., Perley R.A., Taylor G.B., Broderick J.J., 1998, AJ, 115, 1693
- [Danese 1987] Danese L., De Zotti G., Franceschini A., Toffolatti L., 1987; ApJ, 318, L15
- [Dunlop 1990] Dunlop J.S., Peacock J.A., 1990, MNRAS, 247, 19
- [FR 1974] Fanaroff B.L., Riley J.M., 1974, MNRAS, 167, L31
- [Folkes et al. 1999] Folkes S.R., Ronen S., Price I., Lahav O., Colless M., Maddox S.J., Glazebrook K., Bland-Hawthorn J, Cannon R., Cole S., Collins C., Couch W., Driver S., Dalton G., Efstathiou G., Ellis R., Frenk C., Kaiser N., Lewis L., Lumsden S., Peacock J., Peterson B., Sutherland W., Taylor K., 1999, MNRAS, 308, 459.
- [Georgakakis et al. 1999] Georgakakis A., Mobasher B., Cram L., Hopkins A., Lidman C, Rowan-Robinson M., 1999; MNRAS, 306, 708
- [Glaz et al. 1998] Glazebrook K., Offer A.R., Deeley K., 1998, ApJ, 492, 98
- [Gruppioni et al. 1998] Gruppioni C., Mignoli M., Zamorani G., 1999; MNRAS, 304, 199
- [Hill 2001] Hill T.L., Heisler C.A., Norris R.P., Reynolds J.E., Hunstead R.W., 2001, ApJ, 548, 127
- [wa et al. 1999] Jackson C.A., Wall J.V., 1999, MNRAS, 304, 160
- [Jackson et al. 2001] Jackson, C.A., 2002, in preparation
- [Kennicut 1992] Kennicut R.C., 1992, ApJ, 388, 310
- [Kochanek 2001] Kochanek C.S., Pahre M.A., Falco E.E., 2001, ApJ, submitted, astro-ph/0011458
- [Led 1996] Ledlow M.J., Owen F.N., 1996, AJ, 112, 9
- [Maddox et al. 1990a] Maddox S.J., Efstathiou G., Sutherland W.J., Loveday J., 1990a, MNRAS, 243, 692
- [Maddox et al. 1990b] Maddox S.J., Efstathiou G., Sutherland W.J., 1990b, MNRAS, 246, 433
- [Maddox et al. 1996] Maddox S.J., Efstathiou G., Sutherland W.J., 1996, MNRAS, 283, 1227
- [Maddox et al. 1998] Maddox S.J., 1998, in ‘Large-Scale Structure: Tracks and Traces’, proc. 12th Postdam Cosmogony Workshop, World Scientific, 91, astro-ph/9711015
- [Madwick et al. 2001] Madgwick D. et al. (2dFGRS team), 2001, MNRAS, submitted, astro-ph/0107197
- [Magliocchetti et al. 1998] Magliocchetti M., Maddox S.J., Lahav O., Wall J.V., 1998, MNRAS, 300, 257
- [Maglioa 2001] Magliocchetti M., Maddox S., Wall J.V., Benn C.R., Cotter G., 2000, MNRAS, 318, 1047
- [Maglio 2001] Magliocchetti M., Maddox S.J., 2002, MNRAS, 330, 241
- [Maraschi 1994] Maraschi L., Rovetti F., 1994, ApJ, 436, 79
- [Masci et al. 2001] Masci F.J., Condon J.J., Barlow T.A., Lonsdale C.J., Xu C., Shupe D.L., Pevunova O., Fang F., Cutri R., 2001, PASP, 113,10
- [Mc 1995] McQuade K., Calzetti D., Kinney A.L., 1995, ApJS, 97, 331
- [Orr 1982] Orr M.J.L., Browne I.W.A., 1982, MNRAS, 200, 1067
- [Ort 1987] Oort M.J.A., Steemers W.J.G., Windhorst R.A., 1987, A&AS, 73, 103
- [Padovani 1992] Padovani P., Urry, C.M., 1992, ApJ, 387, 449
- [Rixon et al. 1997] Rixon G.T., Wall J.V., Benn C.R., 1991; MNRAS, 251, 243
- [Rola 1997] Rola C., Terlevich E., Terlevich R., 1997, MNRAS, 289, 419
- [Rowan1 et al. 1968] Rowan-Robinson M., 1968, MNRAS, 138, 445
- [Rowan et al. 1993] Rowan-Robinson M., Benn C. R., Lawrence A., McMahon R.G., Broadhurst T.J., 1993, MNRAS, 23, 123
- [Sadler et al. 1999] Sadler E.M., McIntyre V.J., Jackson, C. A., Cannon R.D., 1999, PASA, 16, 247
- [Sadler et al. 2002] Sadler E.M. et al. (2dFGRS team), 2002, MNRAS, 329, 227
- [Sau et al. 1990] Saunders W., Rowan-Robinson M., Lawrence A., Efstathiou G., Kaiser N., Ellis R.S., Frenck C.S., 1990, MNRAS, 242, 318
- [Veill 1987] Veilleux S., Osterbrock D.E., 1987, ApJ, 63, 295
- [wall et al. 1980] Wall J.V., Pearson T.J., Longair M.S., 1980, MNRAS, 193, 686
- [wa et al. 1997] Wall J.V., Jackson C.A., 1997, MNRAS, 290, L17
- [Wolt 1990] Woltjer L., 1990, in SAAS-FEE Advanced Course on Active Galatic Nuclei, Swiss Society for Astro-Physics Astronomy, eds. Blandford R., Netzer H., Woltjer L.
- [Windhorst et al.1985] Windhorst R.A., Miley G.K., Owen F.N., Kron R.G., Koo R.C., 1985; ApJ, 289, 494