First weak lensing results from the Red-Sequence Cluster Survey
Abstract
The Red-Sequence Cluster Survey (RCS) is a 100 deg2 galaxy cluster survey designed to provide a large sample of optically selected clusters of galaxies with redshifts . The survey data are also useful for a variety of lensing studies. Several strong lensing clusters have been discovered so far, and follow up observations are underway. In these proceedings we present some of the first results of a weak lensing analysis based on 24 deg2 of data. We have detected the lensing signal induced by large scale structure (cosmic shear) at high significance, and find (for a CDM cosmology with ). Another application of these data is the study of the average properties of dark matter halos surrounding galaxies. We study the lensing signal from intermediate redshift galaxies with using a parameterised mass model for the galaxy mass distribution. The analysis yields a mass weighted velocity dispersion of km/s. In addition we have constrained for the first time the extent of dark matter halos, and find a robust upper limit for the truncation parameter kpc (99.7% confidence). A preliminary analysis also excludes a simple “prediction” of lensing according to Modified Newtonian Dynamics (MOND) at high confidence.
1 Introduction
In these proceedings we present some of the first weak lensing results based on the band imaging data from the Red-Sequence Cluster Survey (RCS)aaahttp://www.astro.utoronto.ca/gladders/RCS (e.g., Gladders & Yee 2000). The Red-Sequence Cluster Survey is the largest area, moderately deep imaging survey ever undertaken on 4m class telescopes. The survey comprises 100 square degrees of imaging in 2 filters (22 widely separated patches imaged in and ). Ten patches have been observed using the CFHT 12k mosaic camera, and the remaining 12 southern patches have been observed using CTIO. The depth of the survey (2 magnitudes past at ) is sufficient to find a large number of galaxy clusters to .
The survey allows a variety of studies, such as constraining cosmological parameters from the measurement of the evolution of the number density of galaxy clusters as a function of mass and redshift, and studies of the evolution of cluster galaxies, blue fraction, etc. at redshifts for which very limited data are available at present.
The data are also useful for a range of lensing studies. Strong lensing by clusters of galaxies allows a detailed study of their core mass distribution. In addition, given the shallowness of the survey, the arcs are sufficiently bright to be followed up spectroscopically (e.g., Gladders, Yee, & Ellingson 2001). Thanks to the magnification of the arcs, this allows unprecedented studies of the properties of high redshift galaxies. Furthermore, in combination with detailed modeling of the cluster mass distribution, the geometry of the images can be used to constrain .
Here we concentrate on some of the weak lensing applications, for which we use the band survey data. For the purpose of weak lensing, we have to date analysed 16.4 deg2 of CFHT and 7.6 deg2 of CTIO data. The data will be used to study the mass distribution of the galaxy clusters discovered in the survey. A first study of galaxy biasing as a function of scale is presented in Hoekstra, Yee, & Gladders (2001a). In these proceedings we present some early results of the measurement of the lensing signal by large scale structure (cosmic shear) and a study of the dark matter properties of (field) galaxies. The data analysed so far do not cover complete patches, and therefore we limit the analysis to the individual pointings.
A detailed description of the data and weak lensing analysis will be provided in Hoekstra et al. (2001b; 2001c). The results presented in Hoekstra et al. (2001b) indicate that the object analysis, and the necessary corrections for observational distortions work well, which allows us to obtain accurate measurements of the weak lensing signal.

2 Measurement of Cosmic Shear
The weak distortions of the images of distant galaxies by intervening matter provide an important tool to study the projected mass distribution in the universe and constrain cosmological parameters (e.g., van Waerbeke et al. 2001).
The advantage of our survey, compared to other studies, is that our data have been acquired using two different telescopes, but have been analysed uniformly. The results from the two telescopes are in good agreement, suggesting that the corrections for the various observational distortions have worked well.
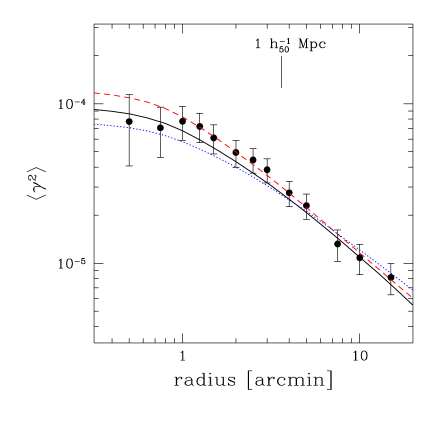
The left panel in Figure 1 shows the measurement of the top-hat smoothed variance for the RCS data analysed so far (16.4 deg2 from CFHT and 7.6 deg2 from CTIO). The signal-to-noise ratio of our measurements is very good, reaching at a radius of 2.5 arcminutes.
We use the photometric redshift distribution inferred from the Hubble Deep Field North and South to compare the observed lensing signal to CDM predictions. This redshift distribution works well, as was demonstrated by Hoekstra, Franx & Kuijken (2000) for the cluster of galaxies MS 1054-03. The right panel in Figure 1 shows the inferred likelihood contours for a CDM cosmology, with . For an flat model we obtain , in excellent agreement with the measurements of van Waerbeke et al. (2001).


3 Galaxy-galaxy lensing
Weak lensing is also an important tool to study the dark matter halos of field (spiral) galaxies (e.g., Brainerd, Blandford, & Smail 1996; Fischer et al. 2000). Rotation curves of spiral galaxies have provided important evidence for the existence of dark matter halos, but are confined to the inner regions, as are strong lensing studies. The weak lensing signal, however, can be measured out to large projected distances, and it provides a powerful probe of the gravitational potential at large radii. In particular constraints can be placed on the extent of the dark matter halos.
The lensing signal induced by an individual galaxy is too low to be detected, and one has to study the ensemble averaged signal around a large number of lenses.
For the analysis presented here, we use the 16.4 deg2 of analysed CFHT data, and select a sample of lenses and sources on the basis of their apparent magnitude. We use galaxies with as lenses, and galaxies with as sources which are used to measure the lensing signal. This selection yields a sample of 36226 lenses and sources.
The redshift distribution of the lenses is known spectroscopically from the CNOC2 field galaxy redshift survey (e.g., Yee et al. 2000), and for the source redshift distribution we again use the photmetric redshift distribution from the HDF North and South. The adopted redshift distributions give a median redshift for the lens galaxies, and for the source galaxies.
The ensemble averaged tangential distortion around galaxies with is presented in the left panel of Figure 2. The solid line corresponds to the best fit SIS model, for which we find an Einstein radius arsec.
A better way to study the lensing signal is to compare the predicted shear (both components) from a parameterised mass model to the data. We use the truncated halo model from Schneider & Rix (1997). The results are presented in the right panel of Figure 2. With the adopted redshift distribution we obtain km/s. It turns out that the quoted value is close to that of an galaxy, and our results are in fair agreement with other estimates.
In addition, for the first time, the average extent of the dark matter halo has been measured. Under the assumption that all halos have the same truncation parameter, we find a 99.7% confidence upper limit of kpc. More realistic scaling relations for give lower values for the physical scale of (Hoekstra, Yee, & Gladders 2001c), and therefore the result presented here can be interpreted as a robust upper limit.
We note that the results indicate a steepening of the tangential shear profile at large radii (which we interpret as a truncation of the halo), and alternative theories of gravity, such as MOND need to reproduce this. A plausible description of lensing by MOND was put forward by Mortlock & Turner (2001), which suggests that the shear in MOND drops . A preliminary analysis excludes this prediction at high confidence.
References
References
- [1] Brainerd, T.G, Blandford, R.D., & Smail, I. 1996, ApJ, 466, 623
- [2] Fischer, P., et al. 2000, ApJ, 120, 1198
- [3] Gladders, M.D., Yee, H.K.C. 2000, to appear in “The New Era of Wide-Field Astronomy” (astro-ph/0011073)
- [4] Gladders, M.D., Yee, H.K.C., Ellingson, E. 2001, AJ, to be submitted
- [5] Hoekstra, H., Franx, M., & Kuijken, K. 2000, ApJ, 532, 88
- [6] Hoekstra, H., Yee, H.K.C., & Gladders, M.D. 2001a, ApJL, submitted
- [7] Hoekstra et al. 2001b, to be submitted
- [8] Hoekstra, H., Yee, H.K.C., & Gladders, M.D. 2001c, in preparation
- [9] Mortlock, D.J., & Turner, E.L. 2001, MNRAS, accepted (astro-ph/0106099)
- [10] Schneider, P., & Rix, H.-W. 1997, ApJ, 474, 25
- [11] van Waerbeke, L., et al. 2001, A& A, accepted (astro-ph/0101511)
- [12] Yee, H.K.C. et al. 2000, ApJS, 129, 475