Parasitic Light in NGST instruments:
the accuracy of photometric redshifts and the
effect of filter leaks in the visible and near IR camera.
Abstract
A detailed analysis of NGST multiband photometry applied to the reference case of the study of high-redshift galaxies has been carried out with simulations based on galaxy SEDs derived from the currently available empirical and model templates and on plausible standard filter-sets.
In order to correctly identify star forming galaxies in the redshift range and early-type galaxies above and avoid confusion with other SEDs it is mandatory to have photometric information in optical bands, besides a standard IR filter-set like . In particular by adding the and filters a good discrimination is obtained above for star forming galaxies and for early-types. The case for an extension of the NGST wavelength domain to the optical range is therefore strongly supported by this analysis.
The effects of leaks in the filter blocking have also been investigated. In spite of rather pessimistic assumptions (a constant leak at a level of of the peak transmission over the whole spectral range or a leak of Gaussian shape placed at 1.5 times the effective wavelength of the filter with an amplitude of of the peak transmission and a width of 5% of the central wavelength) the effects are not dramatic: the accuracy of the determination of photometric redshifts with a standard filter set does not significantly deteriorate for a sample limited to . In the range a rather high accuracy with a typical error is achieved.
With the filter blocking achieved by the present standard technology, extended and continuous spectral coverage appears to be the driving factor to maximize the scientific output.
1 Introduction
| Optimal | Bare Bones | |
|---|---|---|
| range | ||
| Sampling | ||
| FOV | ||
The NGST Design Reference Mission (DRM) is a representative science program elaborated in sufficient detail to aid in the development of functional requirements for the NGST mission. One of the main results of the DRM has been the identification of a large fraction of subprograms (8 out of 12) requiring observations at optical wavelengths. Such an extension poses significant technical challenges. In particular it requires an efficient blocking of photons at undesired wavelengths over a range covering more than three octaves. In the following we examine the consequences of leaks in the transmission of filters for a typical programme of determination of photometric redshifts of high-redshift galaxies.
2 Baseline of the Instrument
Table 1 shows the main characteristics of the
Visible-NIR camera as conceived by the Visible and NIR camera
Subcommittee of the “Ad Hoc Science Working Group” (ASWG).
Two options are envisaged: an optimal and a bare bones
version. More details can be found at the URL
http://www.stecf.org/ngst/instruments.html.
| Name | FWHM | Vega | |
|---|---|---|---|
| (Å) | (Å) | correction | |
| F606 | 6031 | 2050 | 0.096 |
| F814 | 8011 | 1400 | 0.417 |
| z-Gunn | 9125 | 1200 | 0.527 |
| F110 | 11288 | 5239 | 0.698 |
| F160 | 16096 | 3750 | 1.313 |
| Ks | 21640 | 2750 | 1.841 |
| L | 37789 | 5800 | 2.917 |
| M | 47657 | 6400 | 3.380 |
3 Band-passes of the filters
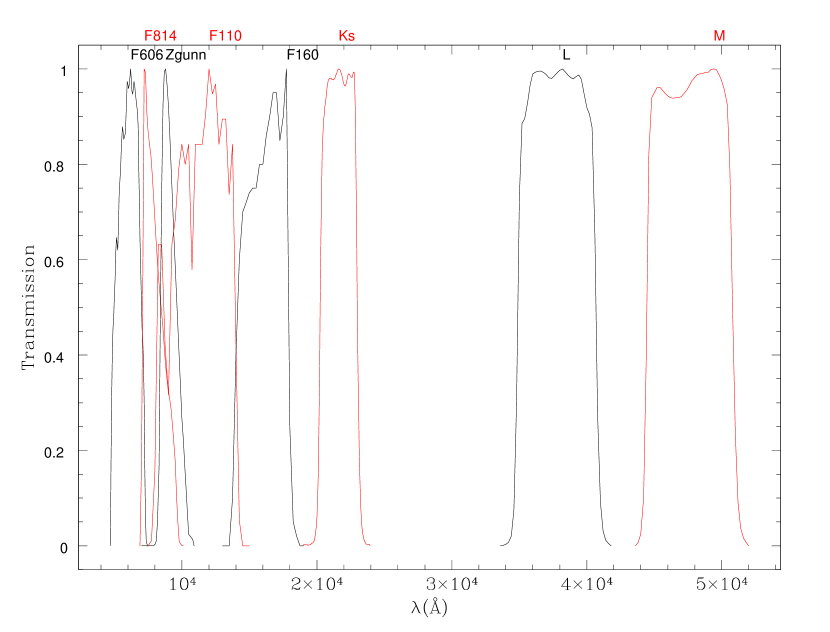
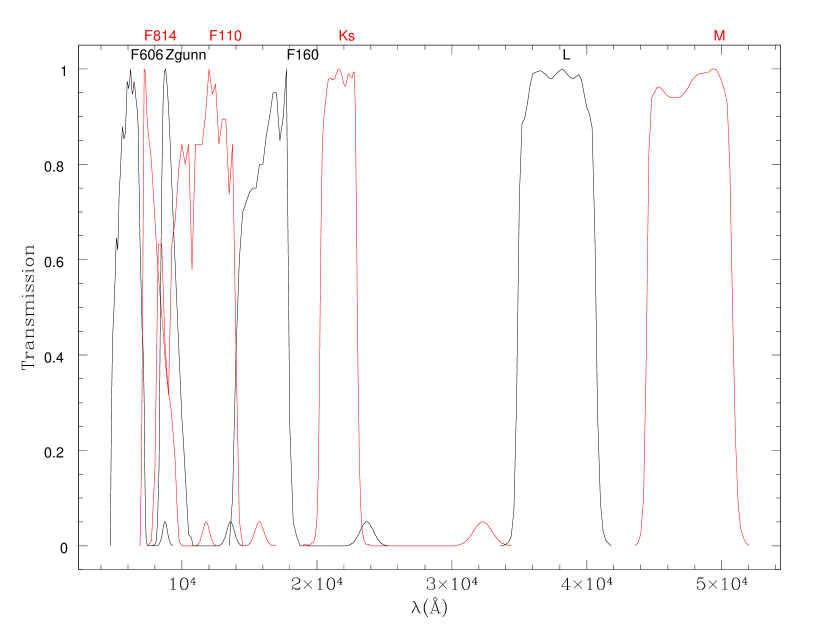
We have assumed as reference bandpasses for the filters of the optical-NIR camera the standard set commonly used on HST with WFPC2 () or NICMOS () and from the ground (Fig. 1). Details about the filter properties are given in Table 2
The actual choice of the filters to be used in space with NGST may be different but the arguments developed in the following do not depend critically on this detail.
4 Typical SEDs of the sources and the locus of galaxies in multicolor space
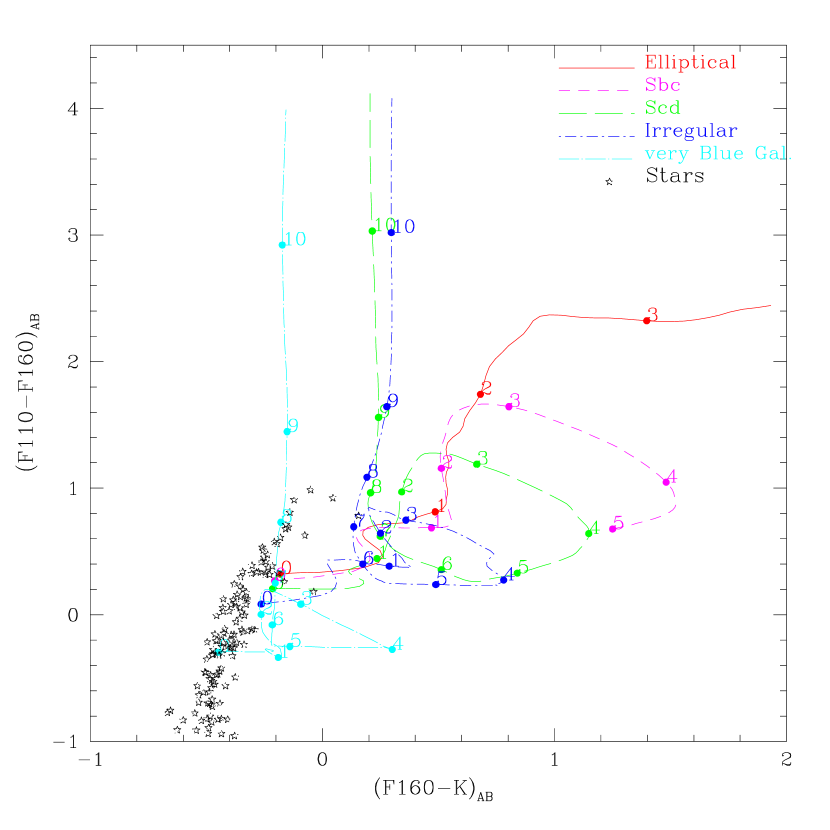
To simulate a range of galaxy SEDs we have adopted the templates of Coleman et al. (1980) for a typical elliptical, Sbc, Scd and irregular galaxy plus a GISSEL (Bruzual and Charlot, 2001) template for a very blue galaxy (with a constant star formation rate and an age of 0.1 Gyr). The SEDs are shown in Fig. 2 and in the following will be referred to as extended CWW templates.

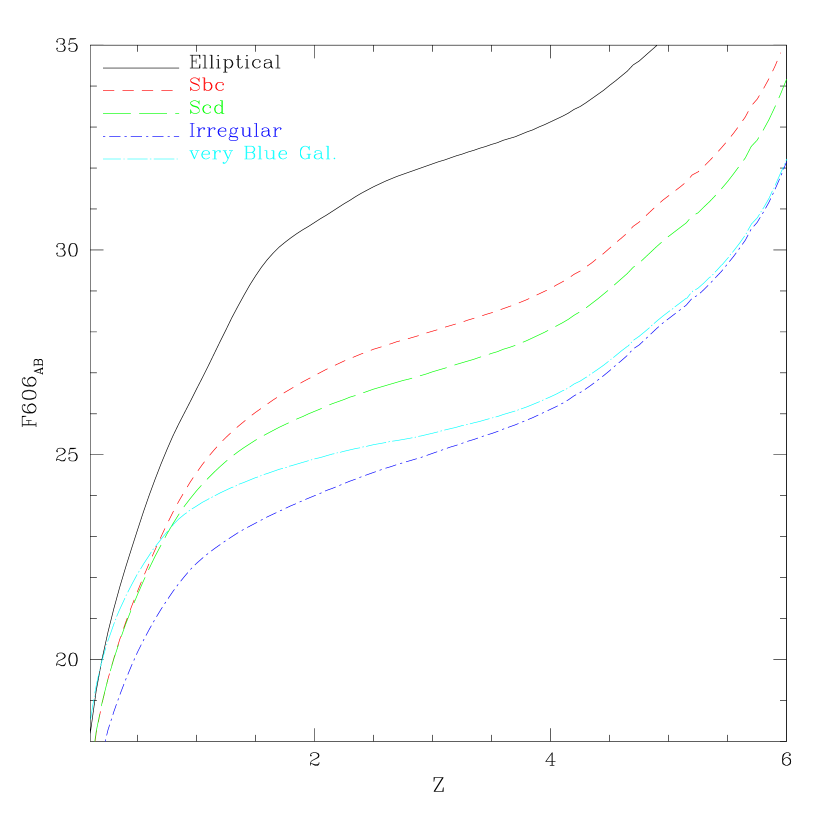
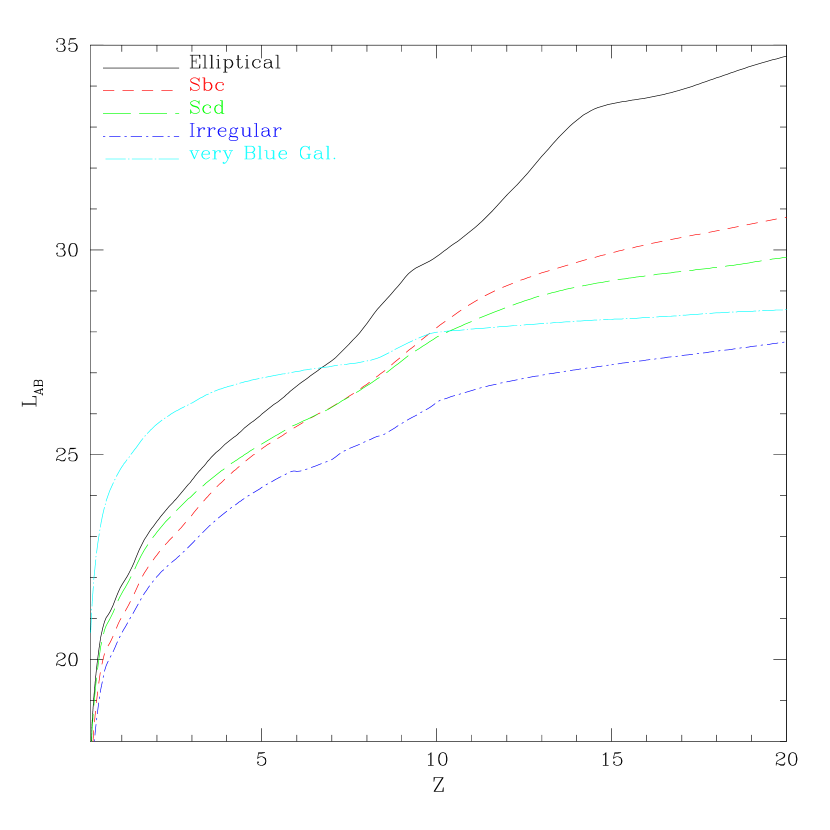
Fig. 3 shows the evolution of the apparent magnitude of typical galaxies of in the and bands and gives a rough idea of the magnitudes of interest. It can be appreciated how an elliptical fades away relatively quickly in the band, while other star-forming galaxies remain - as observed - significantly brighter.
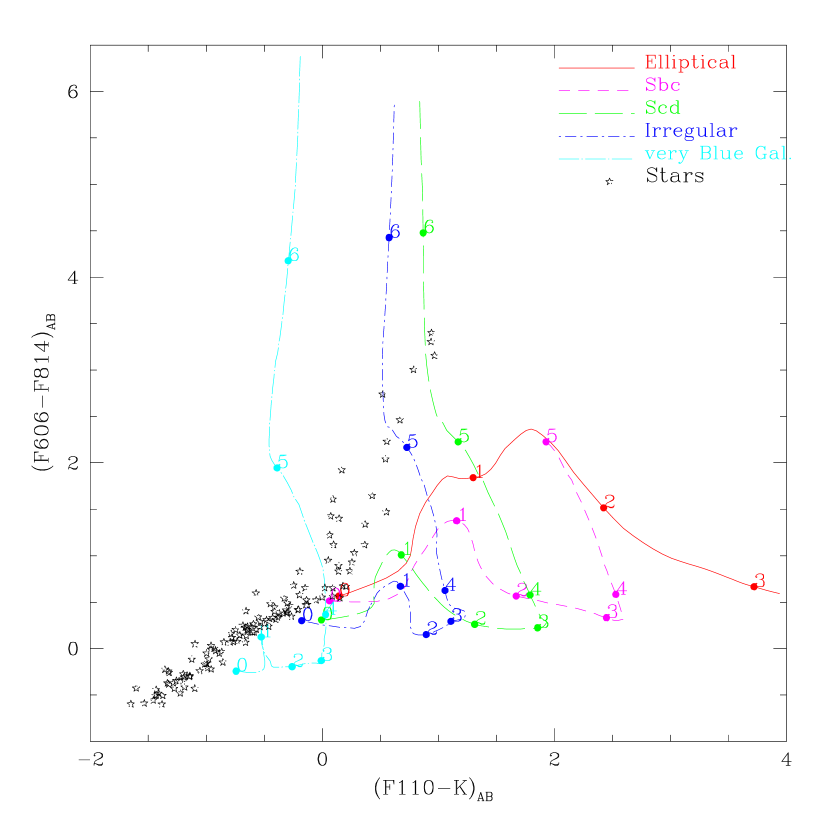
The upper panel of Fig. 4 shows the evolution of the colors of the galaxies described in the previous section in a vs. plane. The color tracks are limited to for an elliptical SED and to for Sbc galaxies. With this combination of bandpasses it is straightforward to identify star-forming galaxies with and ellipticals at . The lower panel shows the same in a vs. plane and demonstrates how, without optical bands, it becomes difficult to isolate star-forming galaxies at .
5 Photometric redshifts and the effects of “(red) leaks”
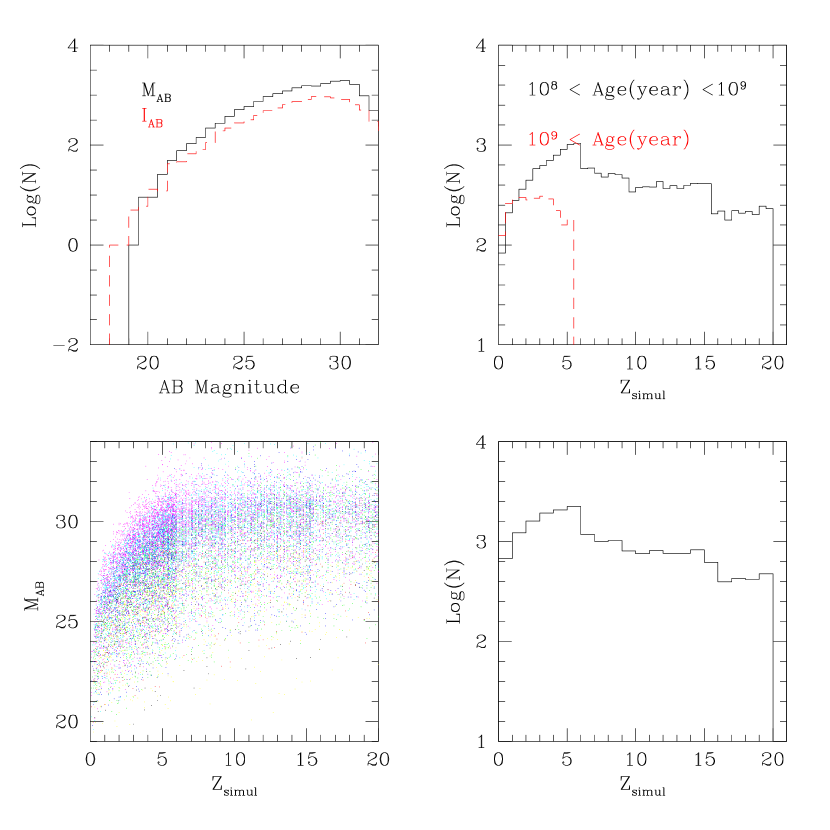
In order to quantify the different performance of different sets of filters and the effects of “red-leaks” in a filter configuration extending from the visible to the infrared we have carried out simulations of the assignment of photometric redshifts to a sample of faint galaxies. To this end, we have tried to generate a simulated photometric catalog covering a very large range of galaxy spectral properties and to estimate photometric redshifts from an economic and independent a set of templates as possible. Galaxies were simulated in a redshift interval according to GISSEL library. This spectral synthesis model is controlled by a number of free parameters. The star formation rate for a galaxy at a given age is governed by the assumed star formation time-scale . Several values of and galaxy ages are necessary to reproduce the different observed spectral types. For the shape of the initial mass function (IMF) we have assumed a Salpeter law, which turns out not to be a critical choice. In addition to the GISSEL parameterization, we have added the internal reddening of each galaxy by applying the observed attenuation law for local starburst galaxies by Calzetti et al. (1997), with the normalization varying between 0 and 0.2 mag. We have also included the Lyman absorption produced by the intergalactic medium as a function of redshift. More details on this type of simulations can be found in Arnouts et al. (1999). Fig. 5 shows the galaxy counts as a function of the apparent magnitude, the age and redshift distribution, the plane characterizing the simulation.
Magnitudes and colors have been derived
from the simulated SEDs by
convolution with the filter passbands described in Sect.3.
Measurement errors have been added, according to the NGST mission simulator
(http://www.ngst.stsci.edu/nms/main/),
assuming an exposure time
of s.
From this set of “simulated observed colors” photometric redshifts have been derived using a standard procedure of optimization, comparing the observed fluxes with errors to the extended CWW set of templates described in Sect. 4.
The has been computed as:
| (1) |
where is the flux observed in a given filter , is its uncertainty, is the flux of the template in the same filter and the sum is over the various filters. The template fluxes have been normalized to the observed ones with the factor minimizing the value :
| (2) |
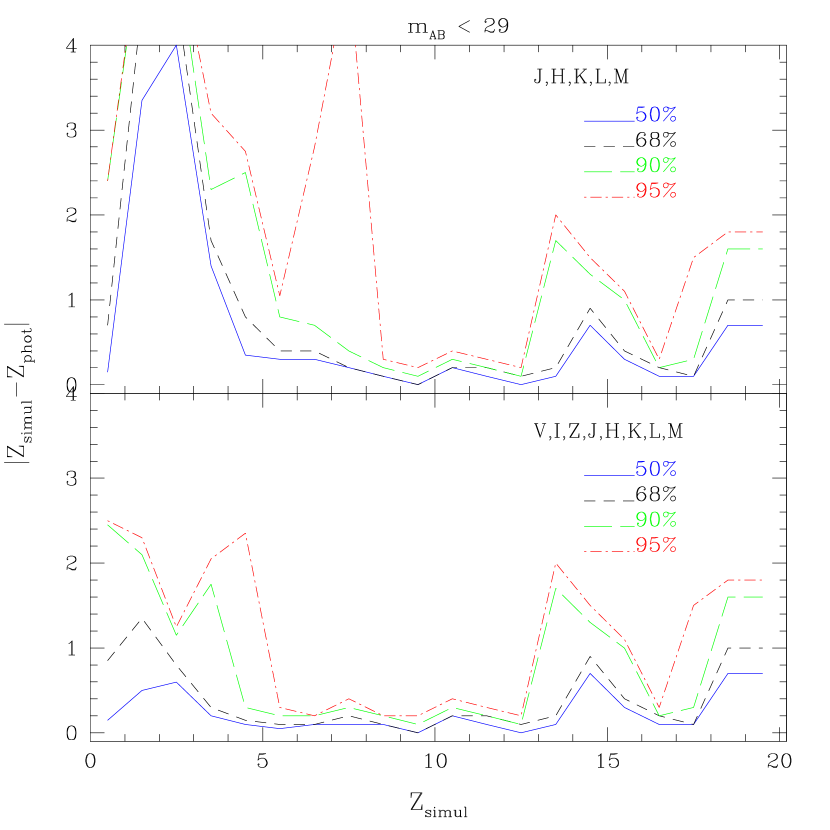
Fig. 6 shows the comparison between photometric redshift estimates obtained with a filter set and a filter set limited to the infrared bands. As suggested in the previous section in order to correctly identify star forming galaxies in the redshift range and avoid confusion with other SEDs it appears mandatory to have, besides the IR filters, photometric information in the optical bands. In the following we will adopt the set as standard.
In order to explore the effects of filter leaks the following approach was adopted:
-
1.
two types of leaks have been foreseen: a constant leak at a level of of the peak transmission over the whole spectral range and a leak of Gaussian shape placed at 1.5 times the effective wavelength of the filter with an amplitude of of the peak transmission and a width of 5% of the central wavelength. The effect of Gaussian leaks on the filter transmission is shown in Fig. 9
-
2.
The leaks have been included in the system spectral response and new magnitudes and colors have been produced with the GISSEL models.
-
3.
The new colors have been used to produce photometric redshifts with the extended CWW templates. No knowledge of the leaks was used in this step, i.e. the system responses assumed in the z-phot estimation are those of Fig. 1, without leaks.
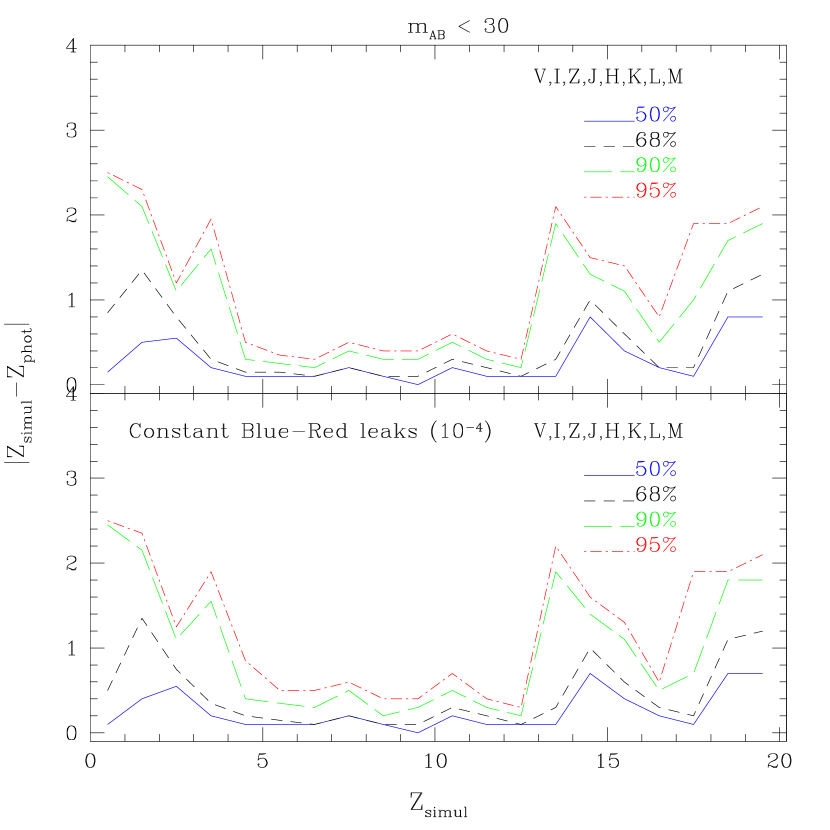
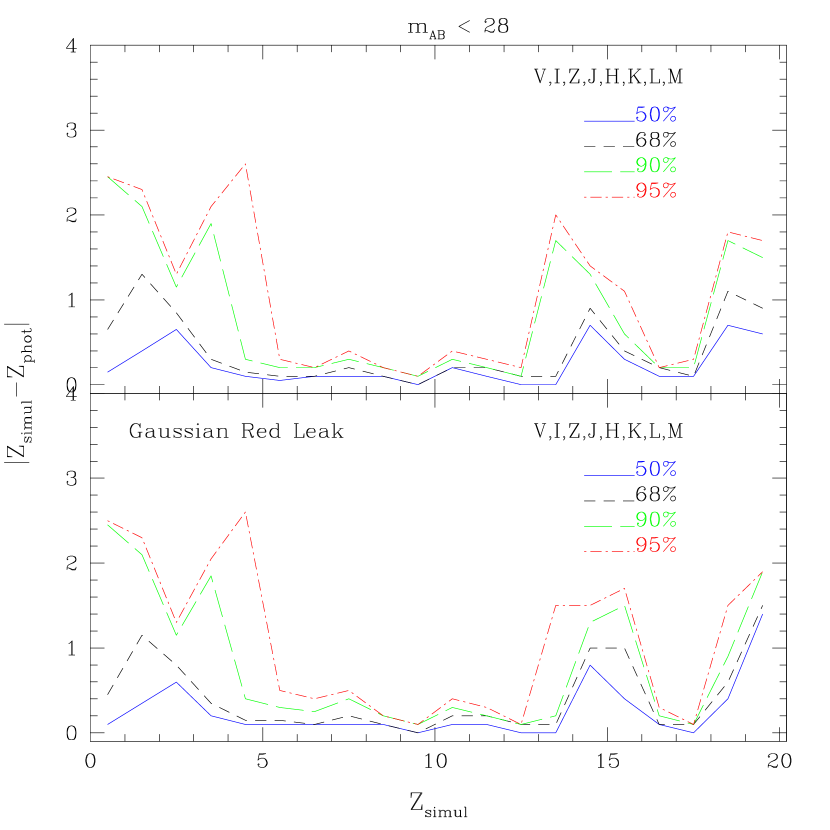
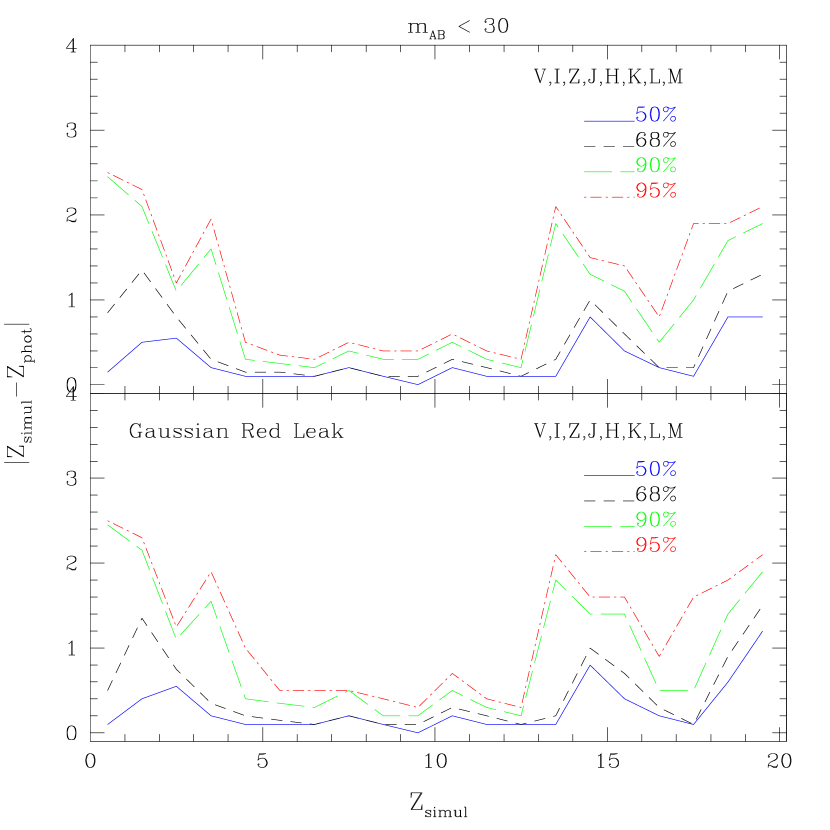
The typical errors deriving from photometric uncertainties and unaccounted leaks are illustrated in Fig. 7-8 and 10-11. The dot-dashed, long-dashed, short-dashed and continuous lines correspond to the 95, 90, 68 and 50 percentile of the absolute deviation , respectively. It can be seen that errors are in all cases relatively large at . This is an obvious effect due to the lack of bandpasses bluer than , and the consequent difficulty to identify the Lyman break at relatively low redshift and distinguish it, for example, from the 4000 Å break at lower redshift.
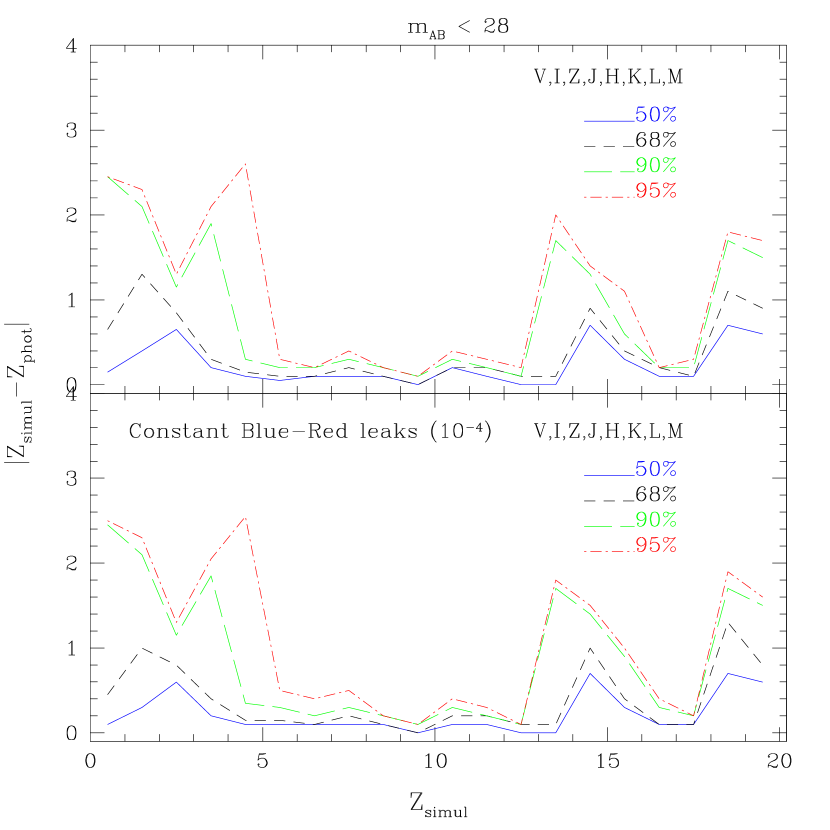
The effect of the leaks, despite the rather pessimistic assumptions, is in general a moderate increase of the error level. For example for and the 68 percentile corresponds to with the standard photometric errors, while it increases at with the unaccounted constant leak at a level of of the peak transmission over the whole spectral range. No qualitative change of the accuracy is observed when the leaks are introduced. No relevant difference is also found between the continuous and the Gaussian leak cases. Again for and the 68 percentile corresponds to when the leak of Gaussian shape is added. In the range a rather good accuracy is achieved with a typical error in all cases down to . The situation deteriorates slightly around , but the result is due mainly to the insufficient sampling of the SEDs between the and the filters, in particular to the “hole” at 2.9 m.
The importance of the leaks, relative to the uncertainty due to photometric errors, decreases with decreasing flux. At and for the no-leak, constant-leak and Gaussian leak case, respectively.
6 Conclusions
A detailed analysis of NGST multiband photometry applied to the reference case of the study of high-redshift galaxies has been carried out with simulations based on galaxy SEDs derived from the currently available empirical and model templates and on plausible standard filter-sets.
In order to correctly identify star forming galaxies in the redshift range and early-type galaxies above and avoid confusion with other SEDs it is mandatory to have photometric information in optical bands, besides a standard IR set like . In particular by adding the and filters a good discrimination is obtained above for star forming galaxies and for early-types. The case for an extension of the NGST wavelength domain to the optical range is therefore strongly supported by this analysis.
The effects of leaks in the filter blocking have also been investigated. In spite of rather pessimistic assumptions (a constant leak at a level of of the peak transmission over the whole spectral range or a leak of Gaussian shape placed at 1.5 times the effective wavelength of the filter with an amplitude of of the peak transmission and a width of 5% of the central wavelength) the effects are not dramatic: the accuracy of the determination of photometric redshifts with a standard filter set is not significantly deteriorated for a sample limited to . In the range a rather good accuracy a typical error is achieved.
As standard specifications for leaks are and as any larger leaks could be measured once the filters are produced, it does not look as though leaks constitute a serious problem, at least for the particular application described here. The interpretation of fields containing highly reddened sources may, however, be more seriously compromised. Extended and continuous spectral coverage appears to be the driving factor to maximize the scientific output of the NGST camera.
7 Acknowledgments
References
- Arnouts et al. (1999) Arnouts S., Cristiani S., Moscardini L., Matarrese S., Lucchin F., Fontana A., Giallongo E., 1999, MNRAS, 310, 540
- Bruzual and Charlot (2001) Bruzual, G., Charlot, S., 2001 (GISSEL) in preparation
- Calzetti (1997) Calzetti D., 1997, in Waller W.H. et al. eds., The Ultraviolet Universe at Low and High Redshift: Probing the Progress of Galaxy Evolution, AIP Conf. Proc. 408. AIP, Woodbury, 403
- Coleman et al. (1980) Coleman, G.D., Wu, C.C., Weedman, D.W. 1980, ApJS, 43, 393 (CWW)