Abstract
X-ray observations have played a key role in the study of substructure and merging in galaxy clusters. I review the evidence for cluster substructure and mergers obtained from X-ray observations with satellites that operated before Chandra and XMM. Different techniques to study cluster mergers via X-ray imaging and spectral data are discussed with an emphasis on the quantitative analysis of cluster morphologies. I discuss the implications of measurements of cluster morphologies for cosmology and the origin of radio halos.
keywords:
X-rays: galaxies: clustersX-Ray Observations of Cluster Mergers To appear in Merging Processes in Clusters of Galaxies, edited by L. Feretti, I. M. Gioia, and G. Giovannini (Dordrecht: Kluwer), in press (2001)
Cluster Morphologies and Their Implications
1 Introduction
“Substructure” in a galaxy cluster is defined as multiple peaks in the cluster surface density on scales larger than the constituent galaxies; the “cluster surface density” refers either to the galaxies, the X-ray emission from hot gas, or the dark matter. Today we take it for granted that many galaxy clusters exhibit substructure and thus are in early stages of formation. This, of course, was not always the case. In the 1980s there were several searches for cluster substructure in the optical, but their results were controversial, primarily because of the difficulty in assessing the importance of projection effects and the statistical significance of substructure (see reviews by West 1990, 1995).
X-ray studies of clusters are less susceptible to contamination from foreground and background objects than optical studies. The X-ray luminosity is a strong function of the temperature, or mass, which means that, e.g., foreground groups contribute proportionally less to the X-ray emission than they do to the galaxy surface density. X-ray studies of clusters also have the advantage that the signal is limited only by the effective area of the detector and exposure time of an observation whereas optical studies are limited by the finite number of cluster galaxies.
The reality of substructure in clusters was firmly established with ROSAT observations in the early 1990s. The watershed example is that of A2256 which had long been thought to be a prototypical relaxed cluster when examined from the perspective of its galaxy isopleths. However, in a controversial optical study of A2256, Fabricant, Kent, and Kurtz (1989) proposed the existence of an infalling subcluster from analysis of the galaxy velocities even though they detected no such evidence from the galaxy positions alone.
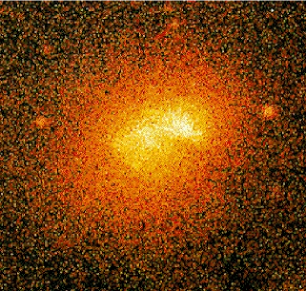
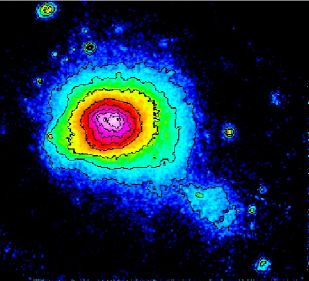
The existence of a subcluster in A2256 was confirmed by the stunning ROSAT PSPC image (Briel et al. 1991) that showed a subcluster111This X-ray substructure in A2256 could have been discovered ten years before ROSAT since the Einstein image reveals the presence of the subcluster albeit at a lower level of significance (Buote 1992; Davis & Mushotzky 1993). offset from the main cluster by a few hundred kpc (Figure 1, left). ROSAT also clearly demonstrated significant subclustering in the Coma cluster (Briel, Henry, & Böhringer 1992) which had been presumed to be the quintessential relaxed cluster (Figure 1, right). Hence, ROSAT images confirmed and clearly established the existence of substructure in clusters, and thus showed that such clusters are really still forming.


SINGLE PRIMARY WITH
SMALL SECONDARY


DOUBLE COMPLEX
The fundamental question raised by these early ROSAT observations is how widespread is merging in clusters? Are clusters generally young or old? Or is there an equal distribution of cluster ages in a given cluster sample? To address this issue one needs to have measurements of the subclustering properties of a large cluster sample and, of equal importance, a precise definition of the “age” of a cluster. The first systematic X-ray study of cluster merging was by Jones & Forman (1992). From visual inspection of Einstein cluster images, Jones & Forman separated the clusters into 6 morphological classes (see Figure 2). These classes range from relaxed single-component systems to systems with a large degree of substructure. From the relative populations of these classes they deduced that of clusters have substructure, which is actually a lower limit because of the limited resolution of the Einstein IPC. This study established that merging and substructure are very common in clusters. Consequently, the need arose for a more precise assignment of the age of a cluster; e.g., how much older or younger are clusters in the Jones & Forman classes? Hence, Jones & Forman (1992) ushered in the era of quantitative X-ray cluster morphology.
2 Quantitative Analysis of Individual Substructures
Quantitative studies of cluster X-ray morphologies have traveled down two distinctly different paths. The first path is that of the detailed structural analysis of clusters to determine the number of substructures, their fluxes, spatial properties, etc.. A popular approach is to examine the residuals obtained from subtracting a smooth model representing a relaxed cluster from the X-ray cluster image (e.g., Davis & Mushotzky 1993; White et al. 1994; Davis 1994; Prestwich et al. 1995; Neumann & Böhringer 1997, 1999; Böhringer et al. 2000). Usually this smooth model is obtained by fitting a set of perfect elliptical isophotes or an elliptical model to the cluster surface brightness; i.e., the X-ray emission of a relaxed cluster is assumed to be elliptical in shape.
In hydrostatic equilibrium the surfaces of constant X-ray emissivity are identical in shape to the surfaces of constant gravitational potential regardless of the temperature profile of the gas (Buote & Canizares 1994, 1998). And since the isopotential surfaces generated by an elliptical matter distribution (which is assumed to be the most general stable, relaxed, non-rotating, self-gravitating configuration) are not perfect ellipses (e.g., Binney & Tremaine 1987), neither are the X-ray isophotes. Consequently, the residuals obtained from subtracting elliptical models from the X-ray surface brightness of clusters need to be carefully considered. This procedure is most appropriately applied as a simple, approximate indicator of substructure.
A more general and powerful method to identify and quantify substructures is to perform a wavelet decomposition of the X-ray image. The wavelet analysis is a powerful multi-scale technique to detect sources embedded in the bright diffuse background cluster emission which has been successfully applied to many clusters (e.g., Slezak et al. 1994; Vikhlinin, Forman, & Jones 1994; Grebenev et al. 1995; Biviano et al. 1996; Pislar et al. 1997; Lima-Neto et al. 1997; Pierre & Starck 1998; Lemonon et al. 1997; Dantas et al. 1997; Vrtlik et al. 1997; Lazzati & Chincarini 1998; Lazzati et al. 1998; Arnaud et al. 2000). Wavelet analysis locates substructures on different scales and allows separate spatial analysis (e.g., flux, extent etc.) of each detected structure. The statistical significance of the substructures can be assessed rigorously via Monte Carlo simulations.
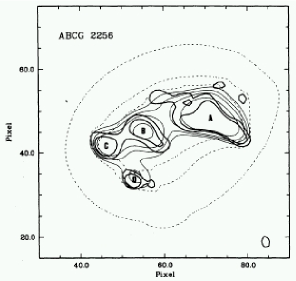
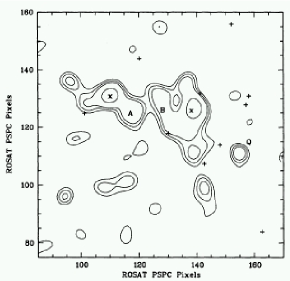
Applications of wavelets to the ROSAT images of A2256 and Coma (Figure 1 are shown in Figure 3. In the case of A2256 Slezak et al. (1994) establish that the core is more than a simple bimodal system since the bottom-left region consists of at three subclusters The wavelet analysis of Coma by Biviano et al. (1996) shows that the core consists of two subclusters surrounding each of the large galaxies NGC 4874 and NGC 4889. Apparently both Coma and A2256 are far from relaxed systems.
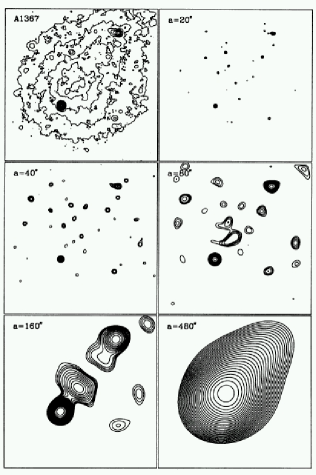
Wavelets are particularly useful for less-massive systems like A1367 where the emission from several galaxies or groups needs to be separated from the diffuse cluster background. In Figure 4 is shown the wavelet analysis by Grebenev et al. (1995) who analyzed both the ROSAT PSPC and HRI images and detected 16 extended sources embedded in the diffuse ICM of A1367. Not only does the wavelet analysis allow the fluxes and extents of each of these sources to be quantified, but the larger scale wavelets (see Figure 4) show that the cluster is bimodal with subclusters centered about what are likely to be galaxy groups.
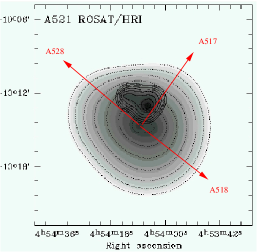
The power of the wavelet technique is also demonstrated by the analysis of the ROSAT HRI image of A521 by Arnaud et al. (2000). From visual inspection of the HRI image of A521 one notices asymmetric isophotes such that the emission peak appears to be offset from the centers of the fainter isophotes (see left panel in Figure 5). Application of the wavelet technique to this image reveals two distinct structures (see right panel of Figure 5). The main cluster appears to be oriented along a line connecting two adjacent clusters. Nearly perpendicular to this line is the line connecting the subcluster to the main cluster. This other line appears to lie nearly parallel to the line pointing to another adjacent cluster. Consequently, Arnaud et al. conjecture that A521 lies at the intersection of two large-scale filaments.
3 Quantitative Classification of Global Morphology
The other path taken by studies of quantitative X-ray cluster morphology is to build on the work of Jones & Forman (1992) and to devise a quantitative scheme for classifying the morphologies of X-ray images of galaxy clusters. As with any classification system in astronomy the principal motivation for classifying cluster morphologies is to elucidate fundamental physical properties, in particular those associated with cluster formation and evolution.
The presence of substructure in clusters implies they are still forming and evolving dynamically, and thus a logical candidate for a fundamental parameter is the current dynamical state. The dynamical state of a cluster is related to the amount of time required for the cluster to virialize; i.e., a time of order a crossing time. But for a cluster of a given total mass one can imagine many different morphological configurations – and formation histories – that would lead to similar relaxation timescales. Hence, to classify clusters having different formation histories but similar dynamical states we also require one or more fundamental parameters to specify the type of merger (e.g., bimodal, many small subclusters) as indicated qualitatively by the classes of Jones & Forman (1992).
3.1 Methods
Perhaps the most common approach used to quantify the morphologies of a large number of X-ray cluster images has been with a measure of the X-ray ellipticity (e.g., McMillan et al. 1989; Davis 1995; Mohr et al. 1995; Gomez et al. 1997; Gomez, Hughes, & Birkinshaw 2001; Kolokotronis et al. 2001). This method is not a particularly good indicator of the dynamical state since both relaxed and disturbed clusters can have significant ellipticity. And even disturbed clusters can have small ellipticity if the substructure is distributed symmetrically about the cluster center. Moreover, even if both the ellipticity and associated position angles are considered they only provide a crude measurement of cluster morphology and have never been shown to provide an interesting distinction between the variety of morphologies exemplified by the Jones & Forman classes.
A better method is the center-shift introduced by Mohr, Fabricant, & Geller (1993). This popular method has been applied in various forms to X-ray cluster images in several studies (e.g., Mohr et al. 1995; Gomez et al. 1997, 2000; Rizza et al. 1998; Kolokotronis et al. 2001). The basic idea is to divide up a cluster image into a series of circular annuli having different radii but with centers located initially at a guess for the cluster center. The center-shift is then given by a weighted average of the centroid computed for each of these annuli.
Since the center-shift is sensitive only to asymmetries in the X-ray images (in particular non-ellipsoidal configurations) it is a much more reliable than the ellipticity as an indicator for when a cluster is relaxed. However, it is not transparent how the center shift translates into a physical measure of the dynamical state. And since the center-shift is most sensitive to mergers of equal-mass subclusters, it cannot by itself distinguish the full range of structures exhibited by the Jones & Forman morphological classes.
If the only objective were to distinguish the full range of cluster morphologies then the logical procedure would be to decompose cluster images into a set of orthogonal basis functions of which wavelets (see §2) are the probably best example. The wavelet coefficients would then define the parameter space of cluster morphologies. Unfortunately, there is no obvious connection (of which I am aware) between wavelet coefficients and a physical measure of the dynamical state.
One method that is both closely related to the cluster dynamical state and provides a quantitative description of the full range of Jones & Forman morphological classes is the “power ratio” method (Buote & Tsai 1995, 1996; Buote 1998). The power ratios are constructed from the moments of the two-dimensional gravitational potential. Specifically, one evaluates the square of the moments over a circle of radius, , where the origin is located at the center of mass or the at the largest mass peak. The ratio of term, , to the monopole term is called a “power ratio”,
| (1) |
where is the th multipole of the two-dimensional gravitational potential due to matter interior to the circle of radius, , and represents the azimuthal average around the circle. In detail we have,
| (2) |
for ,
| (3) |
for . The moments and are given by,
where .
These ratios are directly related to the 2D gravitational potential if one has a map of the 2D surface mass density such as provided by weak gravitational lensing studies. For X-ray studies is replaced with the X-ray surface brightness, , and therefore the power ratios in X-ray studies are really derived from a pseudo potential. These ratios are most sensitive to structures on the same scale as the aperture radius, .
When the aperture is located at the peak of the X-ray emission the dipole power ratio, , provides structural information similar to the center shift discussed above (see also Dutta 1995). For an aperture located at the centroid of the surface brightness the dipole moment vanishes. In this case the quadrupole power ratio, , is sensitive to the degree of flattening and is related to the ellipticity. But unlike ellipticity is also sensitive to the radial profile of the X-ray emission.
The primary physical motivation behind the power ratios is that they are related to potential fluctuations. And since it is thought that large potential fluctuations drive violent relaxation in clusters, the power ratios are closely related to the dynamical state of a cluster (Buote 1998). The other motivation is that the multipoles are a complete orthogonal set of basis functions for the (pseudo) potential and thus are well suited to classify the wide range of observed cluster morphologies.
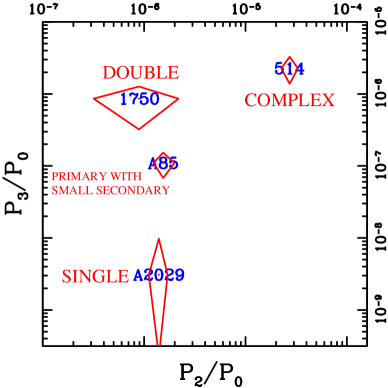
To get a feel for the power ratios let us see how they behave on the ROSAT PSPC images of clusters in the different Jones & Forman morphological classes shown in Figure 2. The four clusters inhabit the extreme Jones & Forman classes. A2029 is a smooth, single component system apparently in a relaxed state. A85 has a regular dominant component but with a small structure Mpc to the S. A1750 is a double cluster consisting of two roughly equal-sized components separated by Mpc. A514 is a highly irregular aggregation of structures.
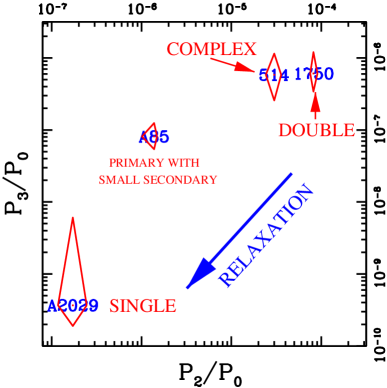
In Figure 6 I show the power ratios, and , of these clusters computed for a 1 Mpc aperture222In Buote & Tsai (1995, 1996) km s-1 Mpc-1 and was assumed. where the aperture is located at the centroid of the X-ray emission (i.e., analog of the center of mass). It can be seen that the single-component cluster is well separated from the primary with small secondary. And each of these classes is clearly distinguished from the disturbed complex and double clusters. In effect the power ratios have defined a morphological evolutionary track where the young, unrelaxed clusters are born at the top right of the figure. As they relax and erase their substructure they pass through a phase similar to A85 until they are old and evolved systems like A2029.
Although we have succeeded in obtaining a successful broad classification according to dynamical states, we have not distinguished clearly between the different classes of highly disturbed clusters (i.e., complex and double). Since there is nothing special about the 1 Mpc aperture it is sensible to explore the effects of using different apertures. The result of computing the power ratios in a 0.5 Mpc aperture are displayed in Figure 7
By focusing initially on it can be seen that three of the clusters appear to be relaxed systems (i.e., small ). This is because the 0.5 Mpc aperture only encloses 1 component of the double cluster and only the primary component of A85. The single component cluster A2029 appears relaxed on both the 0.5 and 1 Mpc scales. However, A514 is complex on many scales and it is easily distinguished from the other reference clusters as a disturbed system in the 0.5 Mpc aperture. Of course, one only needs to appeal to to verify that both the double and complex clusters are actually in a younger dynamical state than the others. Hence, the power ratios represent a quantitative implementation of the Jones & Forman classification scheme, particularly on the 0.5 Mpc scale.
3.2 Merger Frequency of ROSAT Clusters
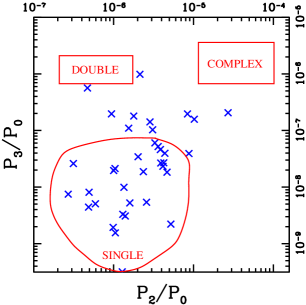
The result of computing power ratios for the brightest ROSAT clusters is displayed in Figure 8. It is immediately apparent that there is a marked deficiency of highly disturbed clusters (complex and double). These brightest clusters therefore lack young members and are instead dominated by mostly evolved clusters with only small-scale ( kpc) substructure. Since such highly evolved clusters are usually associated with cooling flows it should be expected that cooling flows dominate the brightest clusters as has been suggested before on different grounds (e.g., Arnaud 1988; Forman & Jones 1990; Edge et al. 1992; Peres et al. 1998).
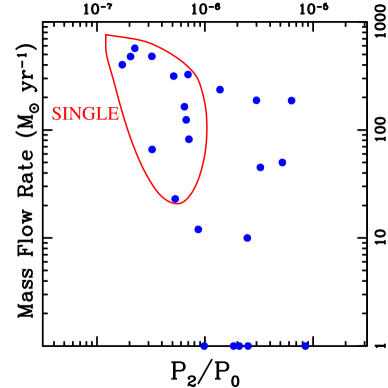
In Figure 9 the quantitative connection between cooling flows and cluster morphology is shown by the anti-correlation of the mass deposition rate () and . This represents the first quantitative description of the anti-correlation of substructure with the strength of a cooling flow. Note the large scatter for systems that have significant substructure (i.e., large ). Analysis of this correlation and its large scatter should shed light on how cooling flows are disrupted by merges and are subsequently re-established.
4 High-Redshift Clusters
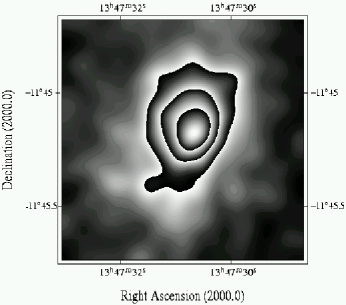
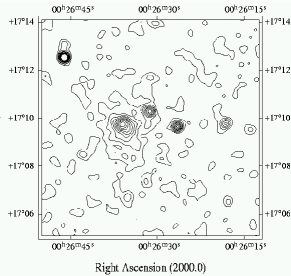
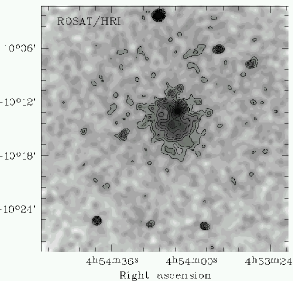
Unfortunately, because of the limited resolution and collecting area of ROSAT it has been difficult to study the morphologies of distant clusters. Two of the best examples () imaged with the ROSAT HRI are displayed in Figure 10. The cluster RXJ1347.5-1145 appears to be a relaxed, cooling flow (Schindler et al. 1997) while the cluster Cl0024+17 may have substantial substructure as quantified by a center shift (Böhringer et al. 2000). These tantalizing glimpses demonstrate the need for a systematic study at high resolution with Chandra.
5 Morphology and Cosmology
Fossil imprints of the process of formation are retained in the cluster substructure. In the standard hierarchical paradigm of structure formation the mass spectrum of subclusters is related to the power spectrum of mass density fluctuations which is a key distinguishing property of cosmological models (e.g., Peacock 1999). As clusters evolve dynamically the mass spectrum of subclusters changes. In a standard Friedmann-Robertson-Walker universe with and , the linear growth of density fluctuations becomes strongly suppressed when the curvature term in the Friedmann equation exceeds the matter term. The redshift delineating this transition from an Einstein - de Sitter phase to one of free expansion is then ; i.e. when the matter density . Hence, if , then objects formed a long time in the past relative to universes where , and thus clusters in low-density universes should be, on average, more relaxed than clusters in universes with .
5.1 Semi-Analytical Models
Richstone, Loeb, & Turner (1992) presented the first theoretical model relating to the observed frequency of substructure in clusters. In their semi-analytical calculations they avoided the issue of the power spectrum by concentrating on clusters having the same total mass. The collapse time of a spherical density perturbation (taken to be twice the turn around time) was defined to be the dividing point between clusters that do and do not possess substructure. By further assuming that any substructure is erased on a crossing time (taken to be ), Richstone et al. computed the quantity , the fraction of present-day clusters which formed within the last time interval, , as a function of and . They found (see Figure 11). When compared to the estimates of for the frequency of substructure in nearby clusters (Jones & Forman 1992) Richstone et al. concluded that .
Follow up theoretical studies by Kauffmann & White (1993), Lacey & Cole (1993), and Nakamura, Hattori, & Mineshige (1995) emphasized that the time for substructure to be erased is variable and can be especially long for substructures with compact cores. The relationship between the collapse time of a spherical density perturbation and subclustering, though qualitatively reasonable, is ambiguous. Consequently, it is difficult to compare directly the frequency of observed substructure to predictions of semi-analytic models based on Richstone et al.’s idea.
Thus, a fundamental limitation of these studies is that they only predict the ambiguous “frequency of substructure” rather than a well-defined quantitative measure of cluster morphology such as the power ratios. Since Richstone et al.’s idea is really a statement about the dynamical states of clusters, in Buote (1998) I used a related (but more detailed) semi-analytical approach to study the behavior of cluster power ratios in different cosmologies. Violent relaxation (Lynden-Bell 1967) is the key process driving the elimination of large potential fluctuations. It operates on a timescale of crossing times and proceeds independently of the masses of the constituents. Consequently, I argued that a plausible definition of the dynamical state of a cluster is,
| (4) |
where is the average mass and is the mass accreted over a relaxation time, typically assumed to be a crossing time; is called the “fractional accreted mass”. This equation states that over the duration of a crossing time the fractional increase in the rms spherically averaged potential is approximately equal to the fractional increase in the mass added in quadrature to the ratios of the increases of the rms spherically averaged higher order potential multipoles to the monopole.
The key premise is that the amount of accreted mass over the previous relaxation timescale determines the amount of substructure (or non-ellipsoidal distortions) which is similar to the premise of Richstone et al. that substructure is related to the collapse and crossing times. This premise requires that be strongly correlated with the other low-order terms, which are approximately, , defined at the epoch of interest. These terms are just the 3D versions of the power ratios (see equation 1).


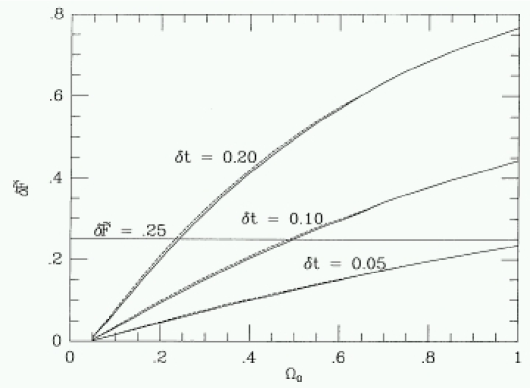
The dependence of on and the power spectrum is shown in Figure 12. We see the expected increase in fractional accreted mass with increasing where , but the normalization does depend sensitively on the assumed relaxation timescale similarly to the previous related studies by Richstone et al. and others. Also shown is the dependence on , the spectral index of models with , which is considerably steeper, . Since the observable low-order power ratios should behave as (see section 2.2 of Buote 1998), the power-ratio distribution for a large sample of clusters should be an interesting probe of and the power spectrum.
5.2 N-Body Simulations
N-body simulations of CDM clusters confirm that the mean value of for small in a cluster sample increases with (Buote & Xu 1997; Thomas et al. 1998). But Buote & Xu (1997) also perform simulations with for different and find that the mean value of is barely affected by . On the other hand they find that does affect significantly the variance of . ( does not seem to affect the variance.) These conclusions have to be viewed with some caution because these dark-matter-only simulations analyze the projected square of the mass density in an attempt to mimic X-ray observations. Further work with large high-resolution N-body simulations is required to establish precisely the relationships between , , , and (and ).
Other N-body simulations with and without gas show that center-of-mass shifts are also sensitive to (Jing et al. 1995; Crone, Evrard, & Richstone 1996). Generally both semi-analytic models and dark-matter-only N-body simulations agree that center shifts and power ratios can distinguish between CDM models with different values of . The same holds for gas-dynamical N-body simulations (Evrard et al. 1993; Mohr et al. 1995)


However, when the N-body simulations (with or without gas) are compared to X-ray observations of clusters conflicting results are obtained (Figure 13). Mohr et al. (1995) compare center shifts of clusters formed in hydrodynamical simulations to Einstein clusters and conclude that whereas Buote & Xu (1997) compare power ratios of the projected square of the dark matter density to ROSAT clusters and conclude . Furthermore, the clusters formed in the hydrodynamical simulations by Valdarnini, Ghizzardi, & Bonometto (1999) give power ratios different from those obtained by Buote & Xu (1997).
All of these simulations have deficiencies. The most important deficiency in the hydrodynamical simulations is the poor force resolution for the gas: softening lengths of kpc for Valdarnini et al. (1999) and over 100 kpc for Mohr et al. (1995) . The simulations of Mohr et al. also contained only six clusters which is too small for statistical studies. Finally, the simulations of Buote & Xu (1997) approximated the gas distribution using the dark matter.
Clearly until appropriate simulations are applied to this problem we will not have a reliable constraint on or from cluster morphologies. What is needed are high-resolution ( kpc) three-dimensional gas-dynamical simulations of a large number () of clusters. The existing observational samples of Einstein data (Mohr et al. 1995) and ROSAT data (Buote & Tsai 1996) also need to be expanded and re-analyzed with new high-resolution, high S/N Chandra and XMM data. These requirements are not excessive for a problem that deserves serious attention.
6 Morphology and Radio Halos
It has been noticed for some time that X-ray observations provide circumstantial evidence for a connection between cluster merging and radio halos (see Feretti 2000 and references therein) because, in particular, radio halos are only found in clusters possessing X-ray substructure and weak (or non-existent) cooling flows. However, it has been argued (e.g., Giovannini & Feretti 2000; Liang et al. 2000; Feretti 2000) that merging cannot be solely responsible for the formation of radio halos because at least 50% of clusters show evidence for X-ray substructure (Jones & Forman 1999) whereas only possess radio halos. (Note X-ray and optical substructures are well-correlated – Kolokotronis et al. 2001.)
Unfortunately, it is difficult to interpret the importance of merging using the observed frequency of substructure as it does not itself quantify the deviation of an individual cluster from a virialized state. And the shocks that could be responsible for particle acceleration will be proportionally stronger in clusters (of the same mass) with the largest departures from a virialized state. To measure the dynamical states of clusters from X-ray images it is necessary to quantify the cluster morphologies using statistics such as the center-shift and the power ratios.


In Buote (2001) I used power ratios to provide the first quantitative comparison of the dynamical states of clusters possessing radio halos. A correlation between the 1.4 GHz power () of the radio halo (or relic) and the magnitude of the dipole power ratio () was discovered such that approximately (see Figure 14). The correlation not only confirms previous circumstantial evidence relating the presence of radio halos to mergers but, more importantly, establishes for the first time a quantitative relationship between the “strength” of radio halos and relics () and the “strength” of mergers (); i.e., the strongest radio halos appear only in those clusters currently experiencing the largest departures from a virialized state. Moreover, in the plane both radio halos and relics may be described consistently which provides new evidence that both halos and relics are formed via mergers. The correlation supports the idea that shocks in the X-ray gas generated by mergers of subclusters accelerate (or re-accelerate) the relativistic particles responsible for the radio emission.
From additional consideration of a small number of highly disturbed clusters without radio halos detected at 1.4 GHz, and recalling that radio halos are more common in clusters with high X-ray luminosity (Giovannini, Tordi, & Feretti 1999), I argued that radio halos form preferentially in massive ( erg s-1) clusters experiencing violent mergers () that have seriously disrupted the cluster core. The association of radio halos with massive, large-, core-disrupted clusters is able to account for both the vital role of mergers in accelerating the relativistic particles responsible for the radio emission as well as the rare occurrence of radio halos in cluster samples.
On average is expected to increase with increasing redshift owing to the higher incidence of merging (Buote 1998) which would lead to a higher incidence of radio halos. However, on average cluster masses are lower at earlier times implying a lower incidence of radio halos. Each of these factors is dependent on the assumed cosmology, and future theoretical work is therefore required to establish whether the abundance of radio halos (1) increases or decreases with redshift, and (2) provides an interesting test of cosmological models.
7 Temperature Substructure
The morphologies of X-ray images of clusters suggest that clusters span a wide range of dynamical states and merger configurations. During such violent mergers the gas should be shock-heated at various locations between an infalling subcluster and the center of the primary cluster. In contrast to the azimuthally symmetric temperature profile expected of a relaxed system, two-dimensional temperature variations both represent a necessary confirmation of the merger picture obtained from images and also provide a complementary view of the cluster dynamical state and merger history.
7.1 X-Ray Temperature Maps
In the era before Chandra and XMM it was exceedingly difficult to obtain accurate two-dimensional X-ray temperature maps of clusters. The ROSAT PSPC had sufficient spatial and spectral resolution but its bandpass cut off sharply just beyond 2 keV. Since massive clusters have temperatures above keV the temperatures could not be constrained with any precision for all but a small number of the brightest clusters. For these clusters the S/N was so high that the data from the spectra below 2 keV managed to place interesting constraints on the temperature.
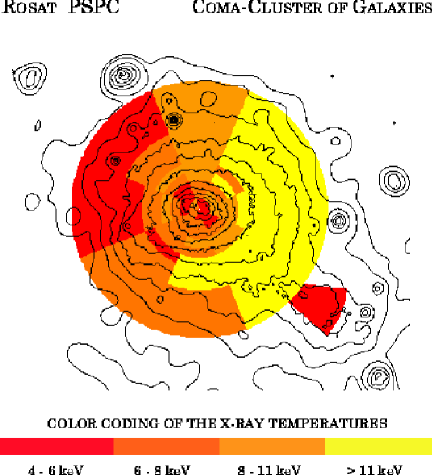
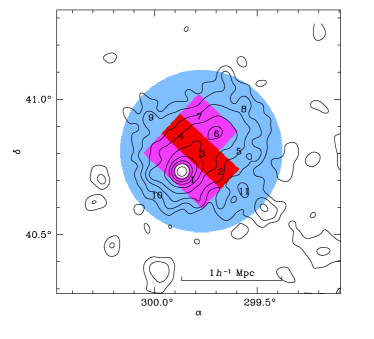
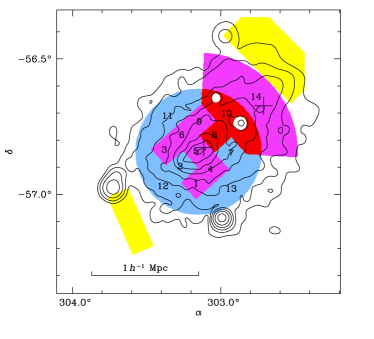
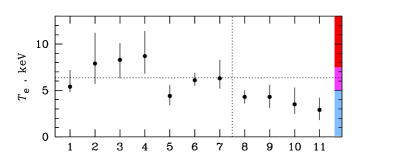
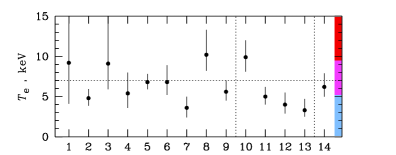
For example, the ROSAT temperature map of Coma (Briel & Henry 1997) displayed in Figure 15 shows significant temperature variations. The region of hotter gas in between the main cluster and the NGC 4839 subcluster is consistent with shock heating during the passage of the subcluster through the main cluster (e.g., Burns et al. 1994; Ishizaka & Mineshige 1996). However, further simulations are required to establish whether the subcluster is currently falling in or has already passed through the main cluster. As noted by Briel & Henry (1997) if the subcluster already passed though the main body then then it is unclear why the subcluster still has retained its halo of hot gas. Other ROSAT temperature maps of mergers display similar evidence for shock-heating (e.g., Briel & Henry 1994; Henry & Briel 1995, 1996; Ettori et al. 2000).
The qualitative features in the temperature maps derived from ROSAT were also found with data from the ASCA satellite. The higher energy resolution and larger bandpass (up to 10 keV) of ASCA provided a distinct advantage over ROSAT studies, but the poor spatial resolution FWHM) and highly energy dependent point spread function (PSF) seriously hampered two-dimensional spatial-spectral analysis. To obtain physical results with ASCA data the PSF needs to be incorporated into the analysis.
When incorporating the PSF into modeling of the ASCA data of mergers two-dimensional temperature variations similar to those obtained by ROSAT are found. For example, in Figure 16 the results of the analysis of Cygnus-A and A3667 by Markevitch, Sarazin, & Vikhlinin (1999) are shown. Although some of the detailed results for a particular cluster differ between studies using different deconvolution procedures, the basic idea that non-azimuthal temperature variations exist in mergers seems to be supported by most ASCA and BeppoSAX studies (e.g., Markevitch et al. 1998, 1999; Churazov et al. 1999; Donnelly et al. 1999; Molendi et al. 1999; Shibata et al. 1999; de Grandi & Molendi 1999; Henriksen, Donnelly, & Davis 2000; Iwasawa et al. 2000).
Since there are some differences in the radial temperature profiles obtained from ASCSA data depending on the PSF deconvolution procedure used (see White 1999 and Irwin & Bregman 2000 and references therein) the detailed temperature features obtained with ASCA do need to be confirmed with Chandra and XMM. (As do those with BeppoSAX because of its low spatial resolution.) Nevertheless, the overall trend of non-azimuthal temperature structures and the shock-heating of the intra-cluster medium are supported by the available ROSAT, ASCA, and BeppoSAX data.
7.2 Quantitative Classification of Temperature Morphology
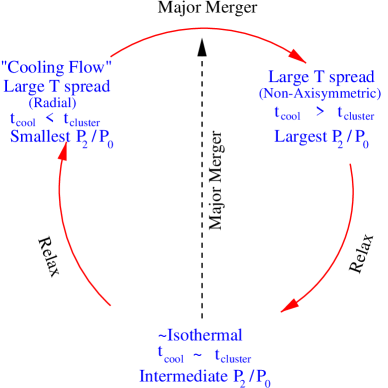
To obtain a more complete picture of the current dynamical states and the merger histories of clusters the global morphological classification of cluster images discussed in (§3) should also incorporate the morphologies of X-ray temperature maps. In Figure 17 I show an idealized picture of how the temperature morphology of a cluster might evolve during a merger. At early times there is a large spread of temperatures distributed spatially in a non-azimuthally symmetric fashion. At this time the cluster is far from a virialized state. It possesses obvious substructure and a disturbed spatial morphology quantified by, e.g., a large value for the power ratio. The disturbed morphology implies there is no cooling flow at this early time (see Figure 9), and the cooling time () is longer than the cluster age () (e.g., Fabian 1994)
As the system relaxes image substructure and the spatial fluctuations in the temperature are gradually erased until the system is approximately isothermal and on the verge of establishing a cooling flow. At this time and there is only a small amount of substructure (i.e., intermediate values – see §3). If the cluster now experiences a major merger it will begin again at the top of Figure 17 with a lot of temperature variations and image substructure. If instead the system relaxes further without being disturbed then a cooling flow will develop () and the image substructure should be mostly erased (smallest values of ). Although the azimuthal temperature variations will also be erased, a radial temperature gradient will be established where the temperature rises from the center out to an approximately isothermal plateau.
Such radial temperature gradients are characteristic of cooling flows (e.g., White 1999 and references therein). Whether the temperature profile is caused by cooling gas or a two-phase medium (e.g., Ikebe et al. 1997; Xu et al. 1998) is not important for the arguments presented here. All that is required is that relaxed systems (particularly those with cD galaxies) tend to have characteristic radial temperature structure.
Therefore, for the merger scenario displayed by Figure 17 the amount of image substructure () falls continuously as the cluster relaxes, but the overall spread in temperatures falls and then rises again at late times. One possible way to quantify the temperature morphology is with the multiphase strength (Buote, Canizares, & Fabian 1999) which essentially measures the width of the differential emission measure, ,
| (5) |
where is the maximum value of and is the emission-measure weighted value of . This statistic ignores the spatial information and is therefore intended as a relatively crude measure of the temperature variations in a cluster appropriate when the data do not allow precise temperature estimates in small spatial regions. In such cases where the integrated cluster spectrum is modeled with a simple cooling flow spectral model plus an isothermal component then equation 5 is modified to , where is the relative fraction of the cooling flow to the total emission measure (see section 5.2 of Buote et al. 1999). A variation on this prescription using the breaks in cooling flow mass deposition profiles has been used to determine the “ages” of some bright cooling flow clusters with ROSAT (Allen et al. 2000).
Joint consideration of and should provide a more precise indicator of the current cluster dynamical state and merger configuration than alone. For high precision temperature maps adding a first or second radial moment to equation (5) may be sufficient to capture the spatial dependences accounted for in the scenario represented in Figure 17.
Finally, the scenario described by Figure 17 will be complicated if there are important dynamical contributions from non-thermal processes such as AGN feedback (e.g., Owen et al. 2001). Empirical studies of the spatial and spectral morphologies of a large number of clusters using the improved instruments on Chandra and XMM will help to elucidate the importance of these and other process associated with cluster formation and evolution.
8 Conclusions
X-ray images of clusters obtained by Einstein and ROSAT have established that substructure and merging are common in nearby galaxy clusters. This evidence is reinforced by the X-ray temperature maps of a smaller number of bright clusters analyzed by ROSAT, ASCA, and BeppoSAX. The study of substructure and morphology has evolved beyond detection and visual classification to that of quantitative morphological statistics that probe the dynamical states and and the power spectrum of density fluctuations.
Unfortunately, the present status of cosmological studies of cluster morphologies is ambiguous. Although theoretical studies agree that cluster morphologies are sensitive to the cosmology (particularly to and ), the nature of the agreement and the relationship to observations have been often in conflict. It is difficult to interpret these disagreements because all of the N-body simulations applied to this problem have been inadequate. Large volume, high-resolution gas dynamical N-body simulations are required to obtain definitive answers. A larger observational sample of cluster morphologies with higher S/N data is also needed.
A quantitative connection between cluster mergers and the formation of radio halos has now been established. The strength of a merger indicated by the dipole power ratio () is approximately proportional to the power of the radio halo. Radio halos form preferentially in mergers of massive clusters with large values of where the merger has proceeded fully into the core of the cluster. Larger samples are needed to understand the relative importance of the mass and on the strength of the radio halo and to clarify the connection between the formation of radio halos and relics.
Acknowledgements.
I am grateful to the editors for the invitation to provide this review. I thank J. Tsai and G. Xu for previous collaboration on studies of cluster morphologies. I also thank the IAU, AAS, and a Chandra Fellowship for travel assistance to the IAU meeting in Manchester in August, 2001 where I presented the material that formed the basis for this review.1
References
- [1] Allen, S. W., Fabian, A. C., Johnstone, R. M., Arnaud, K. A., & Nulsen, P. E. J. 2001, MNRAS, 322, 589
- [2] Arnaud, K. A., 1988, in Cooling Flows in Clusters of Galaxies, ed. A. C. Fabian, (Kluwer: Dordrecht), 31
- [3] Arnaud, M., Maurogordato, S., Slezak, E., & Rho, J. 2000, A&A, 355, 461
- [4] Binney, J., & Tremaine, S. 1987, Galactic Dynamics (Princeton: Princeton Univ. Press)
- [5] Biviano, A., Durret, F., Gerbal, D., Le Fèvre, Lobo, C., Mazure, A., & Slezak, E. 1996, A&A, 311, 95
- [6] Böhringer, H., Soucail, G., Meiller, Y., Ikebe, Y. & Schuecker P. 2000, A&A, 353, 124
- [7] Briel, U. G., et al. 1991, A&A, 246, L10
- [8] Briel, U. G., & Henry, J. P. 1994, Nature, 372, 439
- [9] Briel, U. G., & Henry, J. P. 1997, in A New Vision of an Old Cluster: Untangling Coma Berenices, eds. F. Durret et al. (astro-ph/9711237)
- [10] Briel, U. G., Henry, J. P., & Böhringer, H. 1992, A&A, 259, L31
- [11] Buote, D. A. 1992, M.S. Thesis, Massachusetts Institute of Technology
- [12] Buote, D. A. 1998, MNRAS, 293, 381
- [13] Buote, D. A. 2001, ApJ Letters, v553, in press (astro-ph/0104211)
- [14] Buote, D. A., & Canizares, C. R., 1994, ApJ, 427, 86
- [15] Buote D. A., & Canizares C. R., 1998, in D. Zaritsky ed., Galactic Halos: A UC Santa Cruz Workshop, ASP Conf. Series vol 136, 289 (astro-ph/9710001)
- [16] Buote, D. A., & Tsai, J. C. 1995, ApJ, 452, 522
- [17] Buote, D. A., & Tsai, J. C. 1996, ApJ, 458, 27
- [18] Buote, D. A., & Xu, G. 1997, MNRAS, 284, 439
- [Buote et al(1999)] Buote, D. A., Canizares, C. R., & Fabian, A. C. 1999, MNRAS, 310, 483
- [19] Burns, J. O., Roettiger, K., Ledlow, M., Klypin, A. 1994, ApJ, 427, 87
- [20] Churazov, E., Gilfanov, M., Forman, W., & Jones, C. 1999, ApJ, 520, 105
- [21] Crone, M. M., Evrard, A. E., & Richstone, D. O. 1996, ApJ, 467, 489
- [22] Dantas, C. C., de Carvalho, R. R., Capelato, H. V., Mazure, A. 1997, 485, 447
- [23] de Grandi, S., Molendi, S. 1999, ApJ, 527, L25
- [24] Davis, D. S. 1994, Ph.D. Thesis, University of Maryland
- [25] Davis, D. S., & Mushotzky, R. F. 1993, AJ, 105, 409
- [26] Donnelly, R. H., Markevitch, M., Forman, W., Jones, C., Churazov, E., Gilfanov, M. 1999, ApJ, 513, 690
- [27] Dutta, S. N. 1995, MNRAS, 276, 1109
- [28] Edge, A. C., Stewart, G. C., & Fabian, A. C. 1992, MNRAS, 258, 177
- [29] Ettori, S., Bardelli, S., De Grandi, S., Molendi, S., Zamorani, G., & Zucca, E. 2000, MNRAS, 318, 239
- [30] Evrard, A. E., Mohr, J. J., Fabricant, D. G., & Geller, M. J. 1993, ApJ, 419, L9
- [Fabian(1994)] Fabian A. C., 1994, AR&AA, 32, 277
- [31] Fabricant, D. G., Kent., S. M., & Kurtz, M. J. 1989, ApJ, 336, 77
- [32] Feretti, L. 2000, The Universe at Low Radio Frequencies, IAU 199, Pune (India), in press (astro-ph/0006379)
- [33] Forman, W., & Jones, C. 1990, in Clusters of Galaxies (STScI Symp. 4), ed. W. R. Oegerle, M. J. Fitchett, and L. Danly, (Cambridge: Cambridge University Press), 257
- [Giovannini & Feretti(2000)] Giovannini, G., & Feretti, L. 2000, New Astronomy, 5, 355
- [Giovannini et al.(1999)] Giovannini, G., Tordi, M., & Feretti, L. 1999, New Astronomy, 4, 141
- [34] Gomez, P. L., Pinkney, J., Burns, J. O., Wang, Q., Owen, F. N., & Voges, W. 1997, ApJ, 474, 580
- [35] Gomez, P. L., Hughes, J. P., & Birkinshaw, M. 2000, ApJ, 540, 726
- [36] Grebenev, S. A., Forman, W., Jones, C., & Murray, S. 1995, ApJ, 445, 607
- [Henriksen et al.(2000)] Henriksen, M. J., Donnelly, R. H., & Davis, D. S. 2000, ApJ, 529, 692
- [37] Henry J. P., & Briel U. G., 1995, ApJ, 443, L9
- [38] Henry, J. P., & Briel U. G. 1996, ApJ, 472, 137
- [Ikebe et al(1997)] Ikebe Y., et al., 1997, ApJ, 481, 660
- [39] Irwin, J. A., & Bregman, J. N. 2000, ApJ, 538, 543
- [40] Ishisaka, C., & Mineshige, S., 1996, PASJ, 48, L37
- [41] Iwasawa, K., Ettori, S., Fabian, A. C., Edge, A. C., & Ebeling H. 2000, MNRAS, 313, 515
- [42] Jing Y. P., Mo H. J., Börner G., & Fang L. Z. 1995, MNRAS, 276, 417
- [43] Jones, C., & Forman W. 1992, in Clusters and Superclusters of Galaxies (NATO ASI Vol. 366), ed. A. C. Fabian, (Dordrecht/Boston/London: Kluwer), 49
- [44] Jones, C., & Forman, W. 1999, ApJ, 511, 65
- [45] Kauffmann G., & White S. D. M. 1993, MNRAS, 261, 921
- [46] Kolokotronis, V., Basilakos, S., Plionis, M., Georgantopoulos, I. 2001, MNRAS, 320, 49
- [47] Lacey C., & Cole S. 1993, MNRAS, 262, 627
- [48] Lazzati, D., & Chincarini, G. 1998, A&A, 339, 52
- [49] Lazzati, D., Campana, S., Rosati, P., Chincarini, G., & Giacconi, R. 1998, A&A, 331, 41
- [Liang et al.(2000)] Liang, H., Hunstead, R. W., Birkinshaw, M., & Andreani, P. 2000, ApJ, 544, 686
- [50] Lima Neto, G. B., Pislar, V., Durret, F., Gerbal, D., & Slezak, E. 1997, A&A, 327, 81
- [51] Lemonon, L., Pierre, M., Hunstead, R., Reid, A., Mellier, Y., & Böhringer, H. 1997, A&A, 326, 34
- [52] Lynden-Bell D., 1967, MNRAS, 136, 101v
- [Markevitch et al.(1999)] Markevitch, M., Sarazin, C. L., & Vikhlinin, A. 1999, ApJ, 521, 526
- [Markevitch et al.(1998)] Markevitch, M., Forman, W., Sarazin, C. L., & Vikhlinin, A. 1998, ApJ, 503, 77
- [53] McMillan, S. L. W., Kowalski, M. P., & Ulmer, M. P. 1989, ApJS, 70, 723
- [54] Mohr, J. J., Fabricant, D. G., & Geller, M. J. 1993, ApJ, 413, 492
- [55] Mohr, J. J., Evrard, A. E., Fabricant, D. G., & Geller, M. J. 1995, ApJ, 447, 8
- [56] Molendi, S., de Grandi, S., Fusco-Femiano, R., Colafrancesco, S., Fiore, F., Nesci, R., & Tamburelli, F. 1999, ApJ, 525, L73
- [57] Nakamura F. E., Hattori M., & Mineshige S. 1995, A&A, 302, 649
- [58] Neumann, D., & Böhringer, H. 1997, MNRAS, 289, 123
- [59] Neumann, D., & Böhringer, H. 1999, ApJ, 512, 630
- [Owen et al(2000)] Owen, F. N., Eilek, J. A., & Kassim, N. E. 2000, ApJ, 543, 611
- [60] Peacock, J. A. 1999, Cosmological Physics (Cambridge: Cambridge Univ. Press)
- [61] Peres C. B., Fabian A. C., Edge A. C., Allen S. W., Johnstone R. M., & White D. A. 1998, MNRAS, 298, 416
- [62] Pierre, M., & Starck, J.-L. 1998, A&A, 330, 801
- [63] Pislar, V., Durret, F., Gerbal, D., Lima Neto, G. B., & Slezak, E. 1997, A&A, 322, 53
- [64] Prestwich, A. H., Guimond, S. J., Luginbul, C. B., & Joy M. 1995, ApJ, 438, L71
- [65] Richstone, D. O., Loeb, A., & Turner, E. L. 1992, ApJ, 393, 477
- [66] Rizza, E., Burns, J. O., Ledlow, M. J., Owen, F. N., Voges, W., Bliton, M. 1998, MNRAS, 301, 328
- [67] Schindler, S., et al. 1997, A&A, 317, 646
- [68] Shibata, R., Honda, H., Ishida, M., Ohashi, T., & Yamashita, K. 1999, ApJ, 524, 603
- [69] Slezak, E., Durret, F., & Gerbal, D. 1994, AJ, 108, 1996
- [70] Thomas, P. A., et al. 1998, MNRAS, 296, 1061
- [71] Valdarnini, R., Ghizzardi, S., & Bonometto, S. 1999, New. Ast., 4, 71
- [72] Tsai J. C., & Buote D. A. 1996, MNRAS, 282, 77
- [73] Vikhlinin, A., Forman, W., & Jones, C. 1994, ApJ, 435, 162
- [74] Vrtilek, J. M., David, L. P., Vikhlinin, A., Forman, W., & Jones, C. 1997, A&AS, 191, 5304
- [75] West, M. J. 1990, in Clusters of Galaxies (STScI Symp. 4), ed. W. R. Oegerle, M. J. Fitchett, & L. Danly (Cambridge: Cambridge Univ. Press), 65
- [76] West, M. J. 1995, in Clusters of Galaxies (Proceedings of the 29th Recontres de Moriond), ed. F. Durret, A. Mazure, & J. Trân Thanh Vân (Gif sur Yvette: Frontier Editions), 23
- [White(2000)] White, D. A., 2000, MNRAS, 312, 663
- [77] White, D. A., Fabian, A. C., Allen, S. W., Edge, A. C., Crawford, C. S., Johnstone, R. M., Stewart, G. C., & Voges, W. 1994, MNRAS, 269, 589
- [Xu et al(1998)] Xu H., Makishima K., Fukazawa Y., Ikebe Y., Kikuchi K., Ohashi T., & Tamura T. 1998, ApJ, 500, 738