Investigating the central engine and excitation mechanisms of ULIRGs: near infrared spectroscopy
Abstract
We present NIR observations of a sample of mainly interacting ULIRGs, comprising H and K band spectra. Our main aims are to investigate the power source of these extremely luminous objects and the various excitation mechanisms of the strong molecular hydrogen emission often seen in such objects. Broadened emission lines were only detected in one object, IRAS 23498, consistent with previous results for this galaxy. The [SiVI] emission line was detected in IRAS 17179 and IRAS 20210, both classified as Sy2s. Two of the sample were unclassified, IRAS 00150 and IRAS 23420, which exhibit neither [SiVI] emission or broadened HI emission. However this does not rule out the presence of an obscured AGN. Analysis of the molecular hydrogen emission showed that the major excitation mechanism for most objects was thermal. Modelling of the more luminous objects indicate for IRAS 20210 10 per cent, and for both IRAS 23365 and IRAS 23420, 30 per cent of their 1–0S(1) line emission has a non-thermal origin.
keywords:
galaxies: active – galaxies: interactions – galaxies: nuclei – galaxies: Seyfert – galaxies: starburst – infrared: galaxies.1 Introduction
The existence of ultra-luminous infrared galaxies (ULIRGs) was highlighted by the Infrared Astronomical Satellite (IRAS). The class is arbitrarily defined by Sanders and Mirabel [Sanders and Mirabel 1996] as galaxies having L L⊙, where L L(8 – 1000 m) using Ho = 75 km s-1 Mpc-1 and qo = 0. Note that, unless otherwise specified, we have adopted Ho = 50 km s-1 Mpc-1 and qo = 0 throughout. In order to produce energy output of this magnitude, ULIRGs require a substantial energy source. The two main candidates are a burst of strong star formation in a central starburst or an active galactic nucleus (AGN) with accretion onto a central black hole. ULIRGs are generally very gas and dust rich e.g. Rigopoulou et al.[Rigopoulou et al. 1996]. Unfortunately this gas and dust obscures the centre of the galaxies in which they reside, hampering identification of the central source. Direct evidence for the presence of AGN is found for some ULIRGs in the form of Seyfert-like emission line ratios, high excitation lines and sometimes broad permitted-line widths [Veilleux et al. 1995]. It has been proposed that the fraction of ULIRGs containing AGN rises with infrared luminosity (e.g. Sanders et al. [Sanders et al. 1988]). Often evidence for the presence of strong star formation is found (e.g. Genzel et al. [Genzel et al. 1998]). However in many cases the identity of the central source is still uncertain.
A large number of ULIRGs have now been identified. Many have been well studied via optical imaging [Leech et al. 1994, Clements et al. 1996a, Auriere et al. 1996, Murphy et al. 1996, Surace et al. 2000] and spectroscopy [Lutz et al. 1999, Kim et al. 1998, Veilleux et al. 1999a]. However, data of longer wavelengths, such as the near infrared (NIR), have the potential to probe deeper into the dust which enshrouds these galaxies, since the extinction is much less i.e. A 10 AK. Relative to the optical, less NIR data exists for ULIRGs. Goldader et al. [Goldader et al. 1995] have obtained K band spectra for a sample of 13 ULIRGs and 24 luminous infrared galaxies (LIRGs). Comparison of the properties of the two sets of galaxies highlights a suppression in the dereddened luminosity of the Br emission, relative to the far-infrared luminosity for the ULIRGs, as compared to the LIRGs. Murphy et al. [Murphy et al. 1996] have studied a sample consisting of 46 galaxies from the IRAS 2 Jy survey. They have imaged these galaxies in the optical and the NIR, and find a high percentage to be interacting (95 per cent). They have also obtained NIR spectral data for 33 of these objects for which results has recently been published [Murphy et al. 1999, Murphy et al. 2000]. Finally, Veilleux et al. [Veilleux et al. 1997, Veilleux et al. 1999b] have conducted a campaign aimed at uncovering hidden broad line regions in ULIRGs. They have observed in total 64 ULIRGs, taken from the IRAS 1 Jy sample [Kim 1995, Kim et al. 1998, Kim & Sanders 1998]. Broad Pa is detected for the first time in four sources and possibly more, some uncertainty is due to the potential contamination from the presence of a nearby H2 line.
We have selected a subset of galaxies mainly from the sample of Leech et al. [Leech et al. 1994]. These display a cross-section of interaction characteristics i.e. ranging from some that are obviously interacting to those with no companion within a significant distance. Two other ULIRGs were added which show evidence of interaction in their morphology. Our final sample shows a bias towards interacting galaxies.
H and K band spectra have been obtained for this sample. Using this data we have investigated the central sources of the ULIRGs, looking for possible broadened emission lines and/or high excitation lines indicative of the presence of an AGN. We also study the excitation mechanisms of the lines present. This will allow us to determine which processes are dominant in particular objects, for example excitation due to young stars, supernova remnants (SNR), a central black hole or shocks due to interaction. Additionally we investigate further relationships which have been established previously, such as the under-luminous Br line issue mentioned previously. In addition we have J, H and K band imaging for our sample which is discussed separately in Davies et al. [Davies et al. 2000b].
This paper is organised as follows. First, the sample is discussed in § 2. The spectral data are then presented and the observations and data reduction are discussed in § 3. The final results are presented and discussed in § 4. The summary of our results appears in § 5, and a brief synopsis for each galaxy is included in Appendix A.
2 The sample
The galaxies in our sample were selected based on their extreme infrared luminosities (, using Ho = 50 km s-1 Mpc-1 and qo = 0). We note that when using the Sanders and Mirabel [Sanders and Mirabel 1996] definition of this classification, which uses the higher value of Ho, two of our sample, IRAS 20210 and IRAS 23420, have values for falling slightly below L⊙. The redshift range of the sample, z = 0.06 – 0.21, was chosen to be well suited to ground-based NIR observations. For all the objects Pa is shifted into the K band, except IRAS 23498 which was only observed in the H band in which Pa falls. The [FeII] line at 1.644 m and a number of H2 lines also fall into the K band window.
Five of the seven objects in our sample are a small subset of a large sample observed in the optical by Leech et al. [Leech et al. 1994]. Their original sample was complied from four flux limited (at = 0.6) sub-samples of the QDOT redshift survey of IRAS galaxies [Lawrence et al. 1999]. These consist of (1) all known ULIRGs from the North Galactic Wedge (NGW) survey of Lawerence et al. [Lawrence et al. 1986], (2) all known ULIRGs from the QDOT survey in a specified RA and DEC range, (3) other randomly selected ULIRGs from the QDOT survey and (4) a number of high luminosity () galaxies from the same survey.
IRAS 20210 and IRAS 23365 were not part of the Leech sample but were taken from the literature as additional, bright examples of nearby interacting ULIRGs falling within the observing constraints. We note that this sample is not complete in any sense.
Table 1 lists the basic properties of the galaxies presented in this paper. Galaxy names are given in column (1), positions in columns (2) and (3), interaction class in column (4), redshift, z, taken from the NASA/IPAC Extragalactic Database in column (5), infrared luminosity in column (6) and galaxy classification taken from the literature, if known, in column (7). References for classifications are given in Appendix A.
| IRAS Name | RA (J2000) | DEC (J2000) | Interacting? | z | Comments | |
|---|---|---|---|---|---|---|
| (1) | (2) | (3) | (4) | (5) | (6) | (7) |
| 00150+4937 | 00h17m44.8s | +49d54m15s | Yes | 0.148 | 12.64 | |
| 16487+5447 | 16h49m47.2s | +54d42m32s | Yes | 0.104 | 12.48 | LINER1,2 |
| 17179+5444 | 17h18m54.2s | +54d41m47s | No | 0.147 | 12.57 | Sy22 |
| 20210+1121 | 20h23m25.9s | +11d31m31s | Yes | 0.056 | 12.19 | Sy23,4 |
| 23365+3604 | 23h39m01.3s | +36d21m10s | Disturbed | 0.065 | 12.45 | LINER5 |
| 23420+2227 | 23h44m32.3s | +22d44m29s | No | 0.087 | 12.09 | |
| 23498+2423 | 23h52m25.0s | +24d40m09s | Yes | 0.212 | 12.82 | Sy22 |
References: (1) Kim et al. [Kim et al. 1998] (2) Veilleux et al. [Veilleux et al. 1999a] (3) Vader et al. [Vader et al. 1993] (4) Perez et al. [Perez et al. 1990] (5) Veilleux et al. [Veilleux et al. 1995].
3 Observations and Data reduction
The spectral observations were performed using the United Kingdom Infrared Telescope (UKIRT) on the nights of 7th and 8th August 1999. The long slit grating spectrometer, CGS4, was used with H and K band filters. The orientation of the slit during observations was chosen to be along the major axis of the galaxy or across both nuclei if a second nucleus was known to be present. Integration times were usually of the order of 20 – 40 minutes, per object, in both bands. Sky frames were obtained by nodding along the slit, thus allowing continuous observation of the galaxies. To properly sample the CGS4 spectrum in the configuration usually used for these measurements, four individual spectra were obtained, with the spectrum shifted by half a pixel over 2 pixels. This has the additional benefit of allowing the removal of the effects of bad pixels in a single row. These frames were combined to produce an overall spectrum. Spectra were generally extracted using 5 pixels along the slit; outside of these few pixels relatively little (1 per cent) or no signal was detected. The resulting spectra were fully sampled at a resolving power of 800 (375 km s-1) at 2 m, with a slit width and pixel size of 0.61 arcsec projected on the sky.
Basic data reduction was performed using IRAF and consisted of the following steps;
-
1.
Subtraction of bias frames and division by flat frames removing the bias level present in the array and pixel-to-pixel variations.
-
2.
Subtraction of sky frames from object frames. This removed sky lines and created, effectively, two spectra on one image, one being positive, the other negative.
-
3.
Transformation of the images using a matrix produced from arc images to remove distortion effects often found in long slit images.
-
4.
Addition of positive and negative spectra, producing a final spectrum.
-
5.
Division by the spectrum of a type F (or earlier) star, observed at a similar air mass, correcting the spectra for instrumental and atmospheric responses. Multiplication by a black body at the effective temperature of the standard provided the intrinsic spectral shape of the galaxy. Observations of flux standards reduced in the same fashion were used to obtain the final flux calibration of the galaxy.
Early type stars were chosen since they do not show metal features seen in later type stars which would have masked features in the galaxy spectra or produce false emission features after division. The stars used do exhibit some atomic hydrogen features (e.g. Br in the K band) which were removed using Lorentzian fits.
4 Results and Discussion
Table 2 presents details of the observations made for each object, listing the specific bands, slit position angles and on source exposure times used. The final reduced H and K band spectra at observed wavelengths are shown merged in Figure 1. Figure 3 shows the merged spectrum, produced using DIPSO, for IRAS 20210 at rest wavelength with the prominent lines labelled. The spectra have been scaled to the strongest line present, Pa. The only exception to this is IRAS 23498 which was not observed in the K band. A plot of the atmospheric transmission has been included with the plots to indicate areas where noise may dominate the spectrum, effectively obscuring lines present in the affected waveband. These data, produced using the program IRTRANS4, were obtained from the UKIRT worldwide web pages. Emission from a second nucleus was detected for IRAS 00150 and IRAS 20210, these spectra have been included together with that of the primary nucleus. In both cases the second nucleus has much lower flux level. Note that, due to the slit position angles used, the secondary nucleus seen for IRAS 16487 in the K’ band [Clements et al. 1996a], and IRAS 23498 in the optical [Leech et al. 1994] did not fall within the slit.
| Galaxy | Band | PA | Exp. time | ||
|---|---|---|---|---|---|
| (minutes) | |||||
| (IRAS) | H | K | (east of north) | H | K |
| 00150 | yes | yes | 172 | 24 | 40 |
| 16487 | yes† | yes | 135 | 24 | 40 |
| 17179 | yes | yes | 57 | 40 | 56 |
| 20210 | yes | yes | 166 | 24 | 40 |
| 23365 | yes | yes | 0 | 40 | 40 |
| 23420 | yes | yes† | 42 | 40 | 48 |
| 23498 | yes | no | 108 | 24 | – |
Variable weather conditions during this observation makes flux calibration uncertain, see main text for more details.


A useful check on the validity of the flux calibration was possible since the H and K bands were reduced independently for each object. The agreement between the bands is generally good, and lies within 20 per cent. Variability in weather conditions made flux calibration uncertain on the two occasions indicated in Table 2. In these cases the band for which the calibration was uncertain was scaled to match the other band, for the same galaxy, for which we are confident of the flux calibration.
Table 3 lists the line fluxes and equivalent widths measured using the separate H and K band spectra. In order to accurately measure line fluxes a continuum was fitted to each spectrum and subtracted. Points free of known spectral features were used. However, in cases where significant variability in atmospheric conditions made removal of atmospheric effects uncertain, such as for IRAS 23365 in the H band, fitting of a continuum was somewhat subjective. In order to assess the magnitude of this effect, several low order fits were tried, subsequent line fluxes varied by less than 10 per cent. Due to the overlap in wavelength between the H and K bands some lines appear in both spectra e.g. Pa is visible in both bands for IRAS 20210, IRAS 23365 and IRAS 23420. When this is the case the final values for flux and equivalent width quoted are averages, except in the cases mentioned above where flux calibration is uncertain due to variable weather conditions, when the more reliable measurement was adopted.
| Galaxy | [FeII] | Br9 | H2 | Pa | H2 | Br | H2 | [SiVI] | H2 | HeI | H2 | Br | H2 | H2 |
|---|---|---|---|---|---|---|---|---|---|---|---|---|---|---|
| (IRAS) | 1.644 | 1.818 | 1.836 | 1.876 | 1.892 | 1.945 | 1.958 | 1.963 | 2.034 | 2.059 | 2.122 | 2.166 | 2.223 | 2.248 |
| (1) | (2) | (3) | (4) | (5) | (6) | (7) | (8) | (9) | (10) | (11) | (12) | (13) | (14) | (15) |
| 00150a | … | … | … | 0.671 | … | 0.016 | … | … | 0.011x | … | … | 0.017 | ||
| … | … | … | 92.6 | … | 8.4 | … | … | 6.7 | … | … | 13.8 | |||
| 00150b | … | … | … | 0.108 | … | … | … | … | … | … | … | … | ||
| … | … | … | 50.1 | … | … | … | … | … | … | … | … | |||
| 16487† | 0.256 | … | 0.074 | 0.938 | 0.037 | 0.067 | 0.160 | … | 0.058 | 0.040 | 0.182 | 0.06 | ||
| 0.4 | … | 17.0 | 216.6 | 9.1 | 17.7 | 42.6 | … | 17.3 | 12.6 | 62.0 | 20.7 | |||
| 17179 | 0.050 | … | 0.060 | 0.773 | … | … | 0.146 | 0.110 | 0.022x | 0.018x | 0.092 | 0.056 | ||
| 19.8 | … | 6.9 | 90.9 | … | … | 18.9 | 14.3 | 2.9x | 2.4x | 13.0 | 7.9 | |||
| 20210a | 1.237 | 0.144 | 0.382 | 9.371 | 0.317 | 0.631 | 1.241 | 0.860 | 0.317 | 0.404 | 0.943 | 0.686 | 0.236 | 0.121 |
| 54.7 | 7.1 | 18.3 | 46.2 | 15.9 | 32.4 | 63.4 | 42.8 | 16.6 | 21.3 | 50.2 | 36.9 | 12.9 | 6.8 | |
| 20210b | … | … | … | … | … | … | … | … | … | … | … | … | … | … |
| … | … | … | … | … | … | … | … | … | … | … | … | … | … | |
| 23365 | 0.163 | … | … | 2.266 | 0.096 | 0.068 | 0.186 | … | 0.073 | 0.068 | 0.173 | 0.157 | 0.051 | … |
| 7.4 | … | … | 115.8 | 6.9 | 3.8 | 10.8 | … | 4.5 | 4.3 | 11.3 | 10.5 | 3.6 | … | |
| 23420‡ | 0.126 | … | 0.069 | 0.844 | 0.057 | 0.036 | 0.115 | … | 0.045 | 0.035 | 0.111 | 0.079 | … | … |
| 12.6 | 3.3 | 7.5 | 81.8 | 4.9 | 3.3 | 10.5 | … | 4.4 | 3.5 | 12.1 | 9.2 | … | … | |
| 23498 | 0.100x | |||||||||||||
| 6.1x |
†Variable weather conditions during the exposure of IRAS 16487 in the H band make flux calibration uncertain.
‡Variable weather conditions during the exposure of IRAS 23420 in the K band make flux calibration uncertain.
(x) Indicates line detected only at 2 limit, not above 3 as is the standard.
Columns: (1) Name of object. (2) – (15) list the fluxes and equivalent widths for the major lines observed where the top value is observed line flux, F (10-14 erg s-1 cm-2) and bottom value is observed equivalent width, EW (Å). A value in italics indicates the lines falls in a waveband where atmospheric transmission falls below 80%, … indicates a non-detection and a blank column indicates the line is at a wavelength redshifted out of the observed band.
In the majority of the spectra a blue ’shoulder’ is evident on the Pa line (m). The origin of this will be discussed further in § 4.3. All fluxes and equivalent widths quoted in Table 3 for Pa include this ’shoulder’. Of note is a line blend consisting of contributions from Br (m), H2 1–0S(3) (m) and [SiVI] (m), prominent in the K band for all objects. To facilitate flux measurements these lines were deblended using the routine ’splot’ from IRAF and also using DIPSO.
Note that Pa was observed in the H band for IRAS 23498. Although not given in Table 3 this line is discussed further in § 4.3.
4.1 General features of the spectra
As can be seen the K band spectra are much richer in lines than the H band for the redshifts of the galaxies observed. In the K band most of the galaxies observed show several hydrogen recombination lines, most notably Pa and Br. A number of H2 excitation lines are seen, especially numerous for the brighter galaxies i.e. IRAS 20210. Other lines visible are HeI at 2.059m and [FeII] at 1.644m. [SiVI] at 1.963m is observed for IRAS 17179 and IRAS 20210.
Several CO bandheads longward of 2.3m can be seen in two of the galaxies observed at this wavelength: IRAS 20210 and IRAS 23365. These are not obvious in Figure 1 due to the scaling used. See § 4.8 for further discussion.
The H band shows few features for the majority of galaxies observed, with the exception of IRAS 23498 which shows a clearly broadened Pa line with FWHM 5000 km s-1. This is discussed further in § 4.3.
4.2 Extinction
Values of internal reddening were calculated using the NIR recombination lines, measured here, and optical lines taken from the literature, available for four of the seven galaxies in this sample. Table 4 lists the NIR - optical line combinations used and extinction values found for each. The method used follows that of Veilleux and Osterbrock [Veilleux and Osterbrock 1987], using the reddening curve for the optical and NIR parametrised by Cardelli et al. [Cardelli et al. 1989]. The intrinsic H/H ratio was taken to be 2.85 for starburst galaxies (assuming Case B recombination) and 3.1 for AGN (having enhanced H due to collisional excitation [Veilleux and Osterbrock 1987]). Galactic extinction for each galaxy is shown in Table 4. These values are small and can be assumed to be negligible, even for IRAS 20210, which is closest to the galactic plane with a galactic latitude of -14o and AV of 0.50 mag. We would expect values for AV using only optical lines to be less than those derived from IR lines, since optical lines probe to a smaller optical depth than those in the NIR [Puxley 1991].
| AV (mags) | |||||||
| Galaxy | Galactic | Ref‡ | |||||
| (IRAS) | |||||||
| 16487 | 1.49 | 3.01 | 1.33 | 3.78 | 1.24 | 0.06(0.01) | (1) |
| 17179 | 3.72 | 4.81 | 3.81 | 5.36 | 3.88 | 0.09(0.01) | (1) |
| 20210 | 2.54 | 3.19 | 2.26 | 3.53 | 2.08 | 0.50(0.06) | (2) |
| 23365 | 2.79 | 4.99 | 3.66 | 6.14 | 4.09 | 0.34(0.04) | (3) |
†Taken from Schlegel et al.[Schlegel et al. 1998]
‡Source from literature used for optical line ratio.
References: (1) Veilleux et al. [Veilleux et al. 1999a], (2) Young et al. [Young et al. 1996], (3) Veilleux et al. [Veilleux et al. 1999b].
Potential problems with the use of this method exist. It is strictly only valid if the dust in these galaxies, known to be an important component in ULIRGs, acts as a discrete absorbing screen in front of the emitting gas. If mixed with the gas, dust scattering may have an important effect, preferentially enhancing H emission. Absorption features from the underlying stellar continuum may have affected emission lines for some objects. Observing effects such as wavelength dependent slit losses, seeing, guiding effects and centring errors may affect the NIR line fluxes, especially important here since most of the objects are extended. Values for H and H fluxes come from observations using a wider slit than used here i.e. Veilleux et al. [Veilleux et al. 1999a] used a 2.0 arcsec slit, our observations were made with a 1.22 arcsec slit width. This could lead to underestimates of NIR line fluxes and hence AV, in cases where the emission line region is extended over many arcsecs. Finally, differences in the dust coverage could affect these values, potential ’clumpy’ dust coverage may result in NIR lines coming from a region not seen in the optical. Even given all these uncertainties, it is expected that general trends in line ratios will still be revealed.
4.3 HI recombination lines
4.3.1 Pa emission
Several Paschen and Brackett series recombination lines are evident in these spectra. The brightest line for each galaxy is Pa, at a rest wavelength of 1.876m. In every observation Pa is narrow, having deconvolved FWHM 300 – 500 km s-1, except for IRAS 20210 which shows FWHM 700 km s-1. Notably, in all but IRAS 00150, a blue asymmetric wing at Pa is seen to some degree. This phenomenon has been noted in ULIRGs previously e.g. Veilleux et al. [Veilleux et al. 1997] who find that many of their objects display blue asymmetric wings at Pa, including IRAS 17179 and IRAS 23498. This could be faint broad emission from high velocity gas (FWHM 2500 km s-1). However in most cases, with the possible exception of IRAS 17179 and IRAS 20210, other explanations are possible. One possibility is faint H2 emission from the 7–5O(3)1.8721m and 6–4O(5) 1.8665m transitions [Veilleux et al. 1997, Veilleux et al. 1999b]. Another possibility is the presence of a pair of HeI emission lines at 1.8686m and 1.8697m [Murphy et al. 1999]. At the spectral resolution of our data we cannot distinguish between the possibilities.
4.3.2 Broadened emission
The only broad emission observed is Pa with FWHM 5000 km s-1, seen in the spectrum of IRAS 23498. Previous observations of this Seyfert 2 consistently show broadened emission (FWHM 3000 km s-1) in the Pa line [Veilleux et al. 1997].
4.3.3 LBrγ vs LFIR correlation
A significant correlation between LBrγ and LFIR has been found for LIRGs, the less luminous counterparts of ULIRGs. ULIRGs however, do not follow the same relationship and appear to be underluminous in Br emission [Goldader et al. 1995]. We have added the data for our sample to the previously published data to see if they fall upon the same relationship.
For consistency we have calculated LFIR ( L(40–120m)) using the formula from Helou et al. [Helou et al. 1985]. Note that, following Goldader et al. [Goldader et al. 1995], we have taken Ho = 75 km s-1 Mpc-1 for this calculation. Where available, we have used E(B–V) from the literature, calculated using optical line ratios (see Table 4 for more details). Where E(B–V) was not available the data were not corrected for extinction.

Figure 4 shows LBrγ vs LFIR for both datasets, where the solid line is the best fit to the LIRGs made by Goldader et al.. They conclude that the ULIRGs from their sample fall below the correlation indicating that they are underluminous in Br. The two lower luminosity galaxies from our sample, classified in this work as ULIRGs, would actually be classified in the Goldader scheme as LIRGs, due to the different value of Ho used. Our higher luminosity objects do not seem to follow the trend of underluminosity in Br emission with respect to the correlation marked. In fact, our data points may follow the correlation if the large scatter seen for the LIRGs is taken into consideration.
The importance of aperture effects must also be considered. On average, the objects from the Goldader sample have been observed with a 3.0 arcsec wide aperture. The slit width used in our observations was 1.22 arcsec. This may result in our observations giving a lower line flux, and hence luminosity, by a factor of approximately 2, with respect to those of Goldader et al..
The depression of the Br luminosity in ULIRGs, when compared with LIRGs, is explained by Goldader and colleagues by a simple model where ULIRGs contain very compact nuclei which are optically thick at 2m. They reason that the Br is therefore highly obscured, resulting in a poor correlation between Br and FIR luminosity.
An alternative explanation would be to question the correlation found for LIRGs. When considered as a group, the relationship found can be seen to be very dependent on the two highest luminosity points. If these are disregarded, then the scatter of the remaining points would change the fitting of any trend dramatically. When the additional higher luminosity data points provided by the ULIRGs are added to the plot then a correlation with a lower gradient could be fitted to both sets of data. Indeed, there is such a large scatter in the data that it is possible that there is no correlation and instead simply two ’regions’, representing the range of properties found for each group. They find support for their conclusions in other work involving LIRGs, where similar relationships have been found [DePoy 1987, Veilleux et al. 1995]. The distinction between LIRGs and ULIRGs is arbitrary, and claims that they are fundamentally different would need to be supported by observations at other wavelengths.
4.3.4 Second nuclei
Four of the galaxies observed have multiple nuclei. Of these, two were observed with the slit orientation covering both nuclei. This was the case for IRAS 00150 and IRAS 20210. The spectra of the second nuclei are plotted with the primary nuclei, at the same scaling, in Figure 1. As can be seen, the spectra of the secondary nuclei seen are practically featureless. This is consistent with preliminary findings from another recent NIR survey of 33 ULIRGs (including IRAS 16487 and IRAS 23365) conducted by Murphy et al. [Murphy et al. 1999].
The only feature we see for the secondary nucleus of IRAS 00150 is weak Pa emission. The second nucleus of IRAS 20210 shows no emission lines, but does show CO absorption, indicative of an old stellar population. It is useful to make an estimate of the contribution of the secondary nucleus to the overall FIR luminosity of the system as detected by IRAS. For IRAS 00150, assuming the relationship between LBrγ and LFIR holds (§ 4.3.3) and using the ratio of Pa in the two nuclei, we estimate the minor nucleus contributes 20 per cent of the FIR emission. For IRAS 20210 we used the ratio of Br emission. An upper limit of FBrγ = 3.81 was found in the secondary nucleus, indicating a contribution of 6 per cent. Therefore, in both cases, the contribution of the secondary nucleus is minor. We note the the similarity of the spectra of the two nuclei seen for IRAS 00150, here the minor component could be a scaled version of the major. This is not the case for IRAS 20210, where the line to continuum ratio seen in the major component is not mirrored in the second nucleus.
4.4 Excitation of H2 lines
4.4.1 Thermal vs non-thermal emission
Emission from electric quadrupole transitions within the ground state of molecular hydrogen is often bright in infrared observations of starburst galaxies and AGN. There are two types of excitation mechanisms producing these lines: collisions due to shocks (thermal process) and radiative decay from an excited state produced by UV photons or X-rays, resulting in fluorescence (non-thermal process). In general both mechanisms, in varying proportions, contribute to the emission. Two galactic cases of particular interest are (1) supernova remnants (SNR) which exhibit purely thermal shock excited emission, and (2) planetary nebulae which exhibit pure fluorescent emission. In starburst galaxies OB stars produce UV photons, also SNR and winds from massive stars drive large scale outflows which produce shocks (e.g. Heckman et al. [Heckman, Armus, & Miley 1990]. Often the more dominant mechanism is uncertain. In AGN, the stronger H2 emitters, the emission is believed to be associated with the active nucleus which emits a strong UV – X-ray continuum and also drives outflows.
Enhanced H2 emission in mergers may arise from shocks produced by cloud-cloud collisions, as originally proposed by Harwit et al. [Harwit et al. 1987]. However the small filling factor of the dense molecular clouds presents problems for this model. A solution to this problem may be that proposed by Jog & Solomon [Jog & Solomon 1992], who describe a scenario in which HI clouds, associated with the interacting galaxies and with large filling factors, collide. This leads to the formation of hot, ionised, high pressure gas which causes a radiative shock compression of the denser H2 clouds.
Since the non-thermal mechanism is more efficient than the thermal in the population of = 2 and higher vibrational levels, in principle line ratios can be used to discriminate between these mechanisms.
A minimum of two H2 lines were detected for each galaxy, increasing to nine for the brightest galaxy observed, IRAS 20210. The potential for deconvolution of this emission into thermal and non-thermally excited components is small for the galaxies which show only a few H2 lines and so only generalised conclusions can be drawn. For the brighter galaxies: IRAS 20210, IRAS 23365 and IRAS 23420 we use the population and diagnostic diagrams discussed later in this section.
4.4.2 Line ratios: a direct comparison
First we draw some general conclusions concerning thermal vs non-thermal excitation for each galaxy by the direct comparison of observed line ratios with those from models. Table 5 lists the measured ratios compared with typical shock and low density fluorescent predictions taken from Black and van Dishoeck [Black & van Dishoeck 1987], plus a mixed model assuming equal contributions to 1–0S(1) flux from shock and UV components.
IRAS 00150, IRAS 16487 and IRAS 17179 have only two H2 line detections. This limits our analysis substantially, but we can conclude that the ratio is indicative of a shock origin over fluorescence. We note that in IRAS 00150 and IRAS 17179 the ratio is 10 per cent less than that expected for shock excitation. However this may be attributed to errors in the marginal detection of the lines above the noise in the spectra.
Line ratios for IRAS 20210 strongly indicate a purely shock origin for the emission with good agreement for all but one of the ratios considered. The one discrepancy is the 2-1S(1) line which was only detected above the 2 level.
The ratios measured for IRAS 23365 are fitted best by the predictions produced by the mixed model. This predicts similar fluxes for 1–0S(0) and 2–1S(1), indicating approximately equal contributions from shock and fluorescent excitation processes.
Finally, considering the ratios seen for IRAS 23420 the best model is unclear. The 1–0S(2) line ratio falls between predicted values for both the shock and mixed models. The low ratio value seen for 1–0S(0) however, the stronger of the two lines, favours the shock model over the mixed model.
| Line | Wavelength | Relative flux of IRAS galaxies† | Models‡ | |||||||
| m | 00150 | 16487 | 17179 | 20210 | 23365 | 23420 | Shock | UV | Mixed | |
| 1-0S(2) | 2.0338 | 0.25 | 0.32 | 0.24 | 0.34 | 0.42 | 0.41 | 0.37 | 0.50 | 0.44 |
| 2-1S(3) | 2.0735 | 0.07 | 0.08 | 0.35 | 0.22 | |||||
| 1-0S(1) | 2.1218 | 1.00 | 1.00 | 1.00 | 1.00 | 1.00 | 1.00 | 1.00 | 1.00 | 1.00 |
| 1-0S(0) | 2.2235 | 0.25 | 0.29 | 0.15 | 0.21 | 0.46 | 0.34 | |||
| 2-1S(1) | 2.2477 | 0.13 | 0.29 | 0.08 | 0.56 | 0.32 | ||||
†Normalised to the flux of 1-0S(1) emission line.
‡Respectively model S2 and model 14 taken from Black and van Dishoeck [Black & van Dishoeck 1987]. The mixed model assumes 50% of 1-0S(1) emission is thermal and 50% is non-thermal.
As is clear from the above, it is not possible to attribute the emission uniquely for half of the sample observed. Throughout, we are constrained by the lines observed which mostly come from the =1 levels. The population of these levels is dominated by thermal excitation which falls off rapidly in other bands. Hence to deconvolve this emission successfully, detection of lines from the =2 levels is necessary. This becomes evident when comparing the predicted ratios in Table 5. The best lines to use are those having very different ratios for shock and UV models. The 1–2S(1) line, which has been detected in every galaxy in this sample, does not fulfill this criteria, having only a 10 per cent difference between the models. 2–1S(3) and 2–1S(1) having 30 per cent and 50 per cent change in predicted values are better. Unfortunately they are the weaker lines and are often undetected.
4.4.3 Population and diagnostic diagrams
Various methods exist to discriminate further between thermal and non-thermal excitation mechanisms. We use two of these methods for the brighter objects in our sample (IRAS 20210, IRAS 23365 and IRAS 23420) in order to better constrain the excitation mechanisms. Level population diagrams are a useful tool, employing similar theory to the previous method, but utilising more emission lines. We also employ diagnostic diagrams with H2 line ratios, used by Mouri [Mouri 1994] to study different thermal excitation mechanisms using characteristic temperatures.
Level population diagrams for IRAS 20210, IRAS 23365 and IRAS 23420 are shown in Figure 5, derived using the local thermal equilibrium ortho/para ratio of 3. The level population is the column density, Nu, divided by the statistical weight, gu, and is calculated using the relationship:
using the measured flux, I, transition probability, Aul, and frequency, . The statistical weight, gu, is given by the product of the rotational and spin degeneracies. The values of level population are scaled to that of the =1, J=3 level.
Simplistically, if the points on such a diagram can be fitted by a straight line then the emission mechanism is purely thermal, otherwise there is additional emission due to non-thermal mechanisms. However data needs to be available for both =1 and 2 levels, as a straight line fit using only =1 lines can be obtained for a galaxy even when a significant amount of fluorescent emission is present, as noted by Tanaka et al. [Tanaka et al. 1989] for NGC 7027 and M1-78, which exhibit 10 per cent and 20 per cent non-thermal emission respectively.
Following the method used by Davies et al. [Davies et al. 2000], a combination of thermal and non-thermal models have been fitted. Free parameters were the relative fraction of non-thermal emission, , the temperature of the thermal emission, , and the absolute scaling. The thermal component was represented by a Boltzmann distribution at temperature T given by
where is the excitation energy of the upper level. The non-thermal model used was model 14 from Black and van Dishoeck [Black & van Dishoeck 1987]. The best fit was found using a chi-square minimalisation technique.
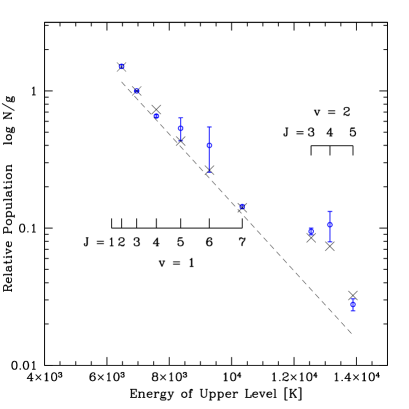
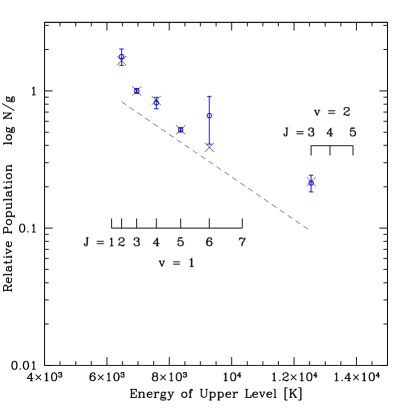
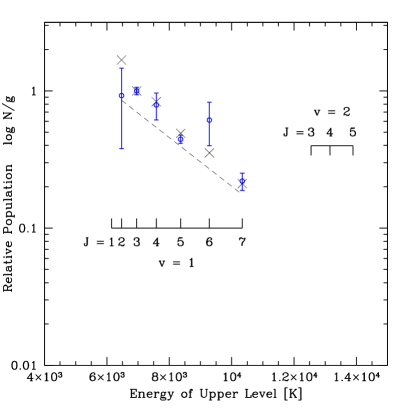
On scrutiny of Figure 5 it is immediately obvious that none of the galaxies exhibits purely thermal emission. The data for IRAS 20210, with 9 derived points, indicates a mostly thermal origin with a small fraction of fluorescence also present. Analysis indicates 10 per cent of the 1-0S(0) flux, 40 per cent of the total H2 flux, comes from non-thermal emission, with a temperature of 1870K. This model fits well for =1 lines but fits less well for the =2 lines. Additionally, when placed on the diagnostic diagrams of Mouri [Mouri 1994], IRAS 20210 is in the region occupied by the shock model and supernova remnants – objects known to show purely thermal emission.
The population diagram for IRAS 23365 is quite different, a single straight line fit is very unlikely. The lines seen for = 1, J = 6 and 7 and = 2, J = 3 are weak detections and in one case (J=7) only an upper limit, which was not included in the fit. We find for this object a higher proportion of non-thermal contribution, 30 per cent of the 1–0S(1) flux, 70 per cent of the total H2 flux, with a temperature of 2800K. This model fits well except for the 1–0S(4) line which falls at a wavelength which shows a drop in transmission for this object. When plotted on the diagnostic diagrams of Mouri [Mouri 1994], this galaxy falls in the region occupied by NGC 6240. NGC 6240 is a galaxy-merger starburst/LINER system with much disputed emission mechanisms. Values for the amount of non-thermal H2 emission exhibited by this object range from none [Sugai et al. 1997] to 70 per cent [Tanaka et al. 1991]. Mouri [Mouri 1994] favours shock heating for the thermal component of this galaxy. Based on the similar position of these galaxies in the diagnostic diagrams we suggest that a similar interpretation might apply to IRAS 23365.
Finally we consider the population diagram for IRAS 23420. Unfortunately we detect only lines from the = 1 level for this galaxy which makes the interpretation inconclusive. Some of these detections are also only weak, leading to uncertainties. Our model finds 30 per cent of the 1–0S(1) flux, 70 per cent of the total H2 flux, having a non-thermal origin, with a temperature of 2450K, agreeing with the conclusions drawn previously using the line ratios.
4.5 Correlation between H2 = 1-0S(1) and [OI]6300
Mouri et al. [Mouri et al. 1989] find a linear correlation between the H2 =1–0S(1)/Br and [OI]6300/H emission line ratios for a sample of galaxies containing an AGN or a starburst nucleus. Their data show both the H21-0S(1) (hereafter S(1)) and [OI] lines are enhanced in AGN. Using optical data, where available, from the literature we have added the galaxies we have observed to those in the Mouri sample, see Figure 6. Squares represent starburst nuclei, circles represent AGN and triangles represent LINERS. The circled points are the four galaxies from our sample: IRAS 16487, IRAS 17179, IRAS 20210 and IRAS 23365. Classifications for these galaxies, taken from the literature, are LINER, Sy2, Sy2 and LINER respectively. The positions of these galaxies on this plot are as expected; they lie amongst the AGN with enhanced S(1) and [OI] emission.
Mouri et al. [Mouri et al. 1989] have only one LINER included in their sample, NGC 6240 (mentioned earlier), which they note has a remarkable S(1) line width with FWHM 650 km s-1. When NGC 6240 is plotted it falls at the extreme upper right, away from the other galaxies. The authors interpreted this as a special case in which the emission is excited by shocks directly, due to the merger of two galaxies, in addition to the effects of a central engine and/or starburst activities. This theory has been supported by recent work on NGC 6240 by Ohyama et al. [Ohyama et al. 2000], who have found evidence for young superbubbles in the central region. They propose that the interaction of this expanding shell with the extragalactic molecular gas produces shock-excited intense H2 emission.
The LINER galaxies we have added however, IRAS 16487 and IRAS 23365, show smaller S(1) line widths (respectively FWHM 400 km s-1 and 250 km s-1), consistent with their position amongst the AGN.

4.6 [Fe II] emission
The most prominent [FeII] transition lines seen in the NIR are a6D9/2 – a4D7/2 at 1.257m and a4F9/2 – a4D7/2 at 1.644m. Due to the range of redshifts of the objects observed, the former line was not covered by our data. The wavelength of the line at 1.644m meant that it could potentially be observed in every galaxy. Unfortunately, due the range of redshifts observed, this line falls in the region where atmospheric absorption is high for some objects. This is the case for IRAS 00150, IRAS 17179 and IRAS 23420. Despite this the [FeII]1.644m line is detected in all the galaxies observed except IRAS 00150, where a slight increase in flux can be seen at the appropriate wavelength. Another, lower flux, [FeII] emission line at 1.9670m falls in the waveband observed. This line may be detected in IRAS 17179 and IRAS 20210. An increase in flux at the appropriate wavelength can be seen for IRAS 23365 and IRAS 23420, however there is no detection above the 2 limit. At this resolution, this line would be blended with [SiVI] emission. Such an apparently low incidence of the [FeII] 1.9670m line in this sample is perhaps slightly surprising when compared with a recent survey of ULIRGs where detections of this line are claimed for 81 per cent of objects observed [Murphy et al. 2000]. However the typical [FeII]/Pa ratio quoted is around 1 per cent for objects with weaker [FeII] emission, rendering the line too faint to be seen for the objects we observe. We note Murphy et al. [Murphy et al. 2000] do not detect [FeII] 1.9670m for IRAS 16487 or IRAS 23365.
The excitation mechanism of [FeII] emission is still under debate. Like [OI], [FeII] emission is excited by electron collisions in partially ionised regions (PIRs). Mouri et al. [Mouri et al. 2000] attribute extensive PIRs in starburst galaxies to shock heating from supernovae, whereas in Seyfert galaxies they propose these regions arise due to photoionisation by nuclear radiation. Alonso-Herrero et al. [Alonso-Herrero et al. 1997] demonstrate a similar idea, favouring a progression of the proportion of shock excitation present from HII regions to starburst galaxies, through to Seyferts and supernovae. This is demonstrated in the diagnostic diagram they employ where the line ratios of [FeII]1.644/Br vs [OI]6300/H produce a separation of the galaxy types, indicating the proposed progression.
When the objects observed here are added to the figure from Alonso-Herrero et al. [Alonso-Herrero et al. 1997] they fall amongst the other galaxies, in the area marked by the authors as the overlap between Seyferts and composite galaxies. From this we would infer a mixture of shock heating and photoionisation as the mechanism for the production of [FeII] in these galaxies, with the latter process appearing to dominate. Overall, based on these ratios the emission seems to be typically Seyfert-like, as expected for these galaxies.
4.7 [SiVI] emission
Detection of [SiVI] emission indicates the presence of high energy ionising photons. This high excitation line has an ionisation potential of 167 eV and cannot be formed by continuum emission from young stars. It is a feature only associated with active galaxies, suggesting that the mechanism for its production is photoionisation by an active nucleus [Marconi et al. 1994]. The [SiVI] line is detected for IRAS 17179 and the main nucleus of IRAS 20210, having FWHM 1200 km s-1 in both detections. This detection confirms the status of these two galaxies as Seyferts. [SiVI] is not detected in the spectra of the LINER type galaxies. The absence of this line in the spectra of the galaxies of undefined type: IRAS 00150 and IRAS 23420, does not support the presence of a Seyfert nucleus, however the presence of a highly obscured AGN cannot be ruled out using this criteria alone [Marconi et al. 1994].
4.8 CO absorption
CO absorption arises from the presence of older stars, red giants and supergiants. There are three main bandheads potentially visible: 12CO(2,0) at 2.294m, 12CO(3,1) at 2.323m and 13CO(2,1) at 2.345m. In our observations, due to the redshift range of the objects observed, detection of these absorption features was potentially only possible in two objects: IRAS 20210 and IRAS 23365. Both objects show absorption, possibly visible in both nuclei for IRAS 20210. Figure 7 shows an expanded view of the spectra of the objects in the relevant waveband, useful to show the CO absorption not obvious with the scaling in Figure 1. The equivalent width of the absorption in the main nucleus of IRAS 20210 is smaller than that of IRAS 23365. This is as expected, since emission from heated dust begins to become significant around this wavelength, rising into the mid-infrared. In IRAS 20210, a Sy2, the stronger emission due to hot dust effectively dilutes the measured CO absorption bands. In IRAS 23365 the hot dust continuum is less, allowing CO absorption to become more evident. In the second nucleus of IRAS 20210, labelled in Figure 7 as IRAS 20210b, the emission is characteristic of an older stellar population: showing CO absorption and a lack of recombination emission lines. Additional evidence for the presence of a stronger ’diluting’ hot dust continuum comes from the relatively redder spectrum of IRAS 20210 when compared with IRAS 23365.

5 Conclusions
We have presented NIR observations of a sample of mainly interacting ULIRGs, comprising of H and K band spectra. From the analysis of these data our main aims were to investigate the power source of these extremely luminous objects, the potential excitation mechanisms of the strong molecular hydrogen emission which is often seen in such objects, along with an investigation of the other characteristics such as extinction and multiple nuclei. Our results are summarised below.
Of the seven galaxies observed, five have previous classifications and the remaining two, IRAS 00150 and IRAS 23420, have no published optical data other than that used for redshift determination. Broadened HI recombination emission was detected in one object, IRAS 23498, with FWHM 5000 km s-1. This finding is consistent with previous results for this object which is classified as a Sy2. The high excitation line [SiVI] is detected in two galaxies in our sample, both are classified as Sy2s. We have investigated several proposed correlations, which as well as exhibiting a specific trend between line ratios, also help to distinguish AGN from starburst galaxies. In most cases the galaxies added to the existing data exhibited the expected trend. We question a correlation found by Goldader et al. [Goldader et al. 1995] between LBrγ vs LFIR for LIRGs. This is due to the small size of the sample on which the relationship is based. Data points added for the ULIRGs suggest either (1) the need for a different form of correlation, or (2) that no significant correlation is seen.
Regarding the classification of IRAS 00150 and IRAS 23420, neither spectrum exhibits [SiVI] emission. However this does not rule out the presence of highly obscured AGN. It would be useful to obtain good quality optical data for these objects, in order to classify them.
Another objective was to provide information on the excitation mechanism of the molecular hydrogen emission observed in the K band. Due to the variation in the number of lines observed, several diagnostic methods were used.
The overall finding for the galaxies in our sample, with the possible exception of IRAS 23365 and IRAS 23420, is the predominance of thermal excitation. Non-thermal emission is also present in some objects but in varying proportions. Comparison of only a few line ratios indicated very little, and possibly negligible, contribution from non-thermal emission in IRAS 00150, IRAS 16487 and IRAS 17179. More detailed analysis was possible for the other objects in the sample. IRAS 20210 shows only a small proportion, 10 per cent, of non-thermal contribution to the 1–0S(1) emission. In contrast, values of 30 per cent non-thermal emission were found for both IRAS 23365 and IRAS 23420. This corresponds to 70 per cent of the total H2 emission.
Since most of the galaxies observed are interacting, one might expect thermal excitation through shocks to be the dominant mechanism. The obvious exceptions to this are IRAS 23365 (which indeed shows a higher proportion of non-thermal emission), and also IRAS 17179 and IRAS 23420 which are classified as non interacting galaxies.We note that for IRAS 17179 only a few H2 emission lines were detected, so our conclusions are less certain. However, the increased fraction of non-thermal emission in IRAS 23420 is consistent with it being non-interacting.
Values for reddening were derived for galaxies with available optical data, using NIR emission lines in combination with the optical lines. The results depended on the combination of lines used, with values using only optical lines being consistently smaller than those found using a NIR line with an optical line. This is as predicted since the infrared lines can be detected from more highly reddened regions.
Of the four galaxies with optical data, IRAS 23365 showed the highest values of extinction with an average value of AV = 4.7 0.8 mag. In comparison the value found using optical lines only was AV = 2.8 mag. The former value is consistent with that derived by Davies et al. [Davies et al. 2000b], AV = 4.4 mag, found using a model of 500K dust contributing 50 per cent of the K band emission using the NIR imaging. The values of extinction found for the other galaxies were moderate, being in the range AV = 2.3 – 4.5 mag.
There is a bias in our sample towards interacting systems. For the two for which we have spectra for both nuclei, we find either very weak or no emission lines, indicative of an evolved population, in contrast to the brighter primary nucleus. This trend has also been found for other ULIRGs [Murphy et al. 1999, Murphy et al. 2000]. An estimate of the contribution of the secondary nucleus to the IR luminosity of the system was made and in both cases the contribution was found to be minor. Observations of the secondary nuclei of IRAS 16487 and IRAS 23498 would be interesting, to see if these characteristics are shared by secondary nuclei of interacting ULIRGs in general.
As mentioned above, all the hydrogen recombination lines detected were narrow, with the exception of IRAS 23498. An interesting feature that arises frequently in these objects is the blue shoulder of the Pa line. This feature could be explained by the presence of a blue velocity component. Another possibility is the presence of blended lines, as seen at our spectral resolution, higher resolution spectroscopy is required to make further progress.
6 Acknowledgements
AJB is supported by a PPARC studentship. The United Kingdom Infrared Telescope is operated by the Joint Astronomy Centre on behalf of the U.K. Particle Physics and Astronomy Research Council. This research has made use of the NASA/IPAC Extragalactic Database (NED) which is operated by the Jet Propulsion Laboratory, California Institute of Technology, under contract with the National Aeronautics and Space Administration. We would like to acknowledge an anonymous referee for helpful comments and suggestions.
References
- [Alonso-Herrero et al. 1997] Alonso-Herrero A., Rieke M. J., Rieke G. H., Ruiz M., 1997, ApJ 482, 747
- [Auriere et al. 1996] Auriere M., Hecquet J., Coupinot G., Arthaud R., Mirabel I. F., 1996, A&A, 312, 387
- [Baan et al. 1998] Baan W. A., Salzer J. J., Lewinter R. D., 1998, ApJ, 509, 633
- [Black & van Dishoeck 1987] Black J. H., van Dishoeck E. F., 1987, ApJ, 322, 412
- [Cardelli et al. 1989] Cardelli J. A., Clayton G. C., Mathis J. S., 1989, ApJ, 345, 245
- [Clements & Baker 1996b] Clements D. L., Baker A. C., 1996b, A&A, 314, 5
- [Clements et al. 1996a] Clements D.L., Sutherland W.J., McMahon R.G., Saunders W., 1996a, MNRAS, 279, 477
- [Davies et al. 2000] Davies R., Ward M., Sugai H., 2000, ApJ, 535, 735
- [Davies et al. 2000b] Davies et al, 2000b, in preparation
- [DePoy 1987] DePoy D. L., 1987, Ph.D. Thesis, Univ. of Hawaii
- [Genzel et al. 1998] Genzel, R., Lutz, D., Sturm, E., Egami, E., Kunze, D., Moorwood, A. F. M., Rigopoulou, D., Spoon, H. W. W., Sternberg, A., Tacconi-Garman, L. E., Tacconi, L., & Thatte, N. , 1998, ApJ, 498, 579
- [Goldader et al. 1995] Goldader J.D., Joseph R.D., Doyon R., Sanders D.B., 1995, ApJ, 444, 97
- [Harwit et al. 1987] Harwit, M., Houck, J. R., Soifer, B. T., & Palumbo, G. G. C. , 1987, ApJ, 315, 28
- [Heckman, Armus, & Miley 1990] Heckman, T. M., Armus, L., & Miley, G. K. , 1990, ApJS, 74, 833
- [Helou et al. 1985] Helou G., Soifer B. T., Rowan-Robinson M., 1985, ApJL, 298, L7
- [Jog & Solomon 1992] Jog, C. J. & Solomon, P. M. , 1992, ApJ, 387, 152
- [Kim 1995] Kim D. -C. , 1995, Ph.D. Thesis, Univ. of Hawaii
- [Kim & Sanders 1998] Kim D. -C. -. & Sanders D. B. 1998, ApJS, 119, 41
- [Kim et al. 1998] Kim D. -C. -., Veilleux S., Sanders D. B., 1998, ApJ, 508, 627
- [Lawrence et al. 1986] Lawrence, A., Walker, D., Rowan-Robinson, M., Leech, K. J., & Penston, M. V. , 1986, MNRAS, 219, 687
- [Lawrence et al. 1989] Lawrence A., Rowan-Robinson M., Leech K., Jones D. H. P., Wall J. V., 1989, MNRAS, 240, 329
- [Lawrence et al. 1999] Lawrence, A. et al. , 1999, MNRAS, 308, 897
- [Leech et al. 1994] Leech K.J., Rowan-Robinson M., Lawerence A., Hughes J.D., 1994, MNRAS, 267, 253
- [Leitherer et al. 1999] Leitherer C., Schaerer D., Goldader J. D., et al., 1999, ApJS, 123, 3
- [Lutz et al. 1999] Lutz D., Veilleux S., Genzel R., 1999, ApJL, 517, 13
- [Marconi et al. 1994] Marconi A., Moorwood A. F. M., Salvati M., Oliva E., 1994, A&A, 291, 18
- [Mouri et al. 1989] Mouri H., Taniguchi Y., Kawara K., Nishida M., 1989, ApJL, 346, L73
- [Mouri 1994] Mouri H., 1994, ApJ, 427, 777
- [Mouri et al. 2000] Mouri H., Kawara K., Taniguchi Y., 2000, ApJ, 528, 186
- [Murphy et al. 1996] Murphy T.W., Armus L., Matthews K., Soifer B.T., Mazzarella J.M., Shupe D.L., Strauss M.A., Neugebauer G., 1996, ApJ, 111, 1025
- [Murphy et al. 1999] Murphy T. W., Soifer B. T., Matthews K., Kiger J. R., Armus L., 1999, ApJL, 525, 85
- [Murphy et al. 2000] Murphy T. W., Soifer B. T., Matthews K., Armus L., Kiger J. R., in press (astro-ph/0010077)
- [Ohyama et al. 2000] Ohyama, Y. et al. , 2000, PASJ, 52, 563
- [Perez et al. 1990] Perez E., Manchado A.,Garcia-Lario P., Pottasch S. R., 1990, A&A, 227, 407
- [Puxley 1991] Puxley P. J., 1991, MNRAS, 249, 11
- [Rigopoulou et al. 1996] Rigopoulou D., Lawrence A., White G. J., Rowan-Robinson M., Church S. E., 1996, A&A, 305, 747
- [Sanders et al. 1989] Sanders D. B., Phinney E. S., Neugebauer G., Soifer B. T., Matthews K., 1989, ApJ, 347, 29
- [Sanders et al. 1988] Sanders D. B., Soifer B. T., Elias J. H., Madore B. F., Matthews K., Neugebauer G., Scoville N. Z., 1988, ApJ, 325, 74
- [Sanders and Mirabel 1996] Sanders D. B., Mirabel I. F., 1996, ARA&A, 34, 725
- [Schlegel et al. 1998] Schlegel D. J., Finkbeiner D. P., Davis M., 1998, ApJ, 500, 525
- [Sugai et al. 1997] Sugai H., Malkan M. A., Ward M. J., Davies R. I., McLean I. S., 1997, ApJ, 481, 186
- [Surace et al. 2000] Surace J. A., Sanders D. B., Evans A. S., 2000, ApJ, 529, 170
- [Tanaka et al. 1989] Tanaka M., Hasegawa T., Hayashi S. S., Brand P. W. J. L., Gatley I., 1989, ApJ, 336, 207
- [Tanaka et al. 1991] Tanaka M., Hasegawa T., Gatley I., 1991, ApJ, 374, 516
- [Taniguchi et al. 1999] Taniguchi, Y., Yoshino, A., Ohyama, Y., & Nishiura, S. , 1999, ApJ, 514, 660
- [Vader et al. 1993] Vader J. P., Frogel J. A., Terndrup D. M., Heisler C. A., 1993, AJ, 106, 1743
- [Veilleux and Osterbrock 1987] Veilleux S. & Osterbrock, D.E., 1987, ApJS, 63, 295
- [Veilleux et al. 1995] Veilleux S., Kim D.-C., Sanders D.B., Mazzarella J.M., Soifer B.T, 1995, ApJS, 98, 171
- [Veilleux et al. 1997] Veilleux S., Sanders D. B., Kim D.-C., 1997, ApJ, 484, 92
- [Veilleux et al. 1999a] Veilleux S., Kim D.-C., Sanders D.B., 1999a, ApJ, 522, 113
- [Veilleux et al. 1999b] Veilleux S., Sanders D.B., Kim D.-C., 1999b, ApJ, 522, 139
- [Young et al. 1996] Young S., Hough J. H., Efstathiou A., Wills B. J., Bailey J. A., Ward M. J., Axon D. J., 1996, MNRAS, 281, 1026
- [Zhenlong et al. 1991] Zhenlong Z., Xiaoyang X., Zugan D., Hongjun S., 1991, MNRAS, 252, 593
Appendix A Details for individual galaxies
A short synopsis is given here for each galaxy observed. It will include a mention of previous work and a brief summary of the emission lines seen.
A.1 IRAS 00150+4937
Little previous data exists for this double nuclei galaxy which means it is unclassified. It is amongst the faintest of the objects in the sample with small EW for the lines detected. It is the only object in the sample for which no blue wing of Pa was seen. Detection of only two H2 emission lines made the determination of excitation mechanism difficult. The ratios seen were indicative of shock excitation over fluorescence. The spectra for the secondary nucleus of this system showed very little, except weak Pa emission.
A.2 IRAS 16487+5447
This object was classified by Leech et al. [Leech et al. 1994] as isolated and undisturbed on the basis of photographic data. Further NIR imaging [Clements & Baker 1996b, Murphy et al. 1996] has shown this object is interacting, although we only present spectra of the primary nucleus. The optical classification of this object is LINER, while the ISO classification is starburst [Lutz et al. 1999]. The Pa line for this object shows a blue wing. Only two H2 emission lines were detected, from these we conclude pure shock excitation is the most likely excitation mechanism, consistent with the conclusions of Taniguchi et al. [Taniguchi et al. 1999].
A.3 IRAS 17179+5444
This Seyfert 2 [Veilleux et al. 1999a] was classified by Leech et al. [Leech et al. 1994] as being a interacting system. This work and Davies et al. [Davies et al. 2000b] show the secondary nucleus to be a foreground star. This galaxy is one of the weaker of the sample and its classification as a ULIRG depends on the value of Ho used. Pa shows a blue wing which could conceivably be broadened emission. [SiVI] is detected for this galaxy. Only two H2 emission lines were detected, from these we conclude shock excitation is the most likely excitation mechanism.
A.4 IRAS 20210+1121
This interacting Seyfert 2 [Perez et al. 1990, Vader et al. 1993] has been relatively well studied in the past. The spectra we have obtained for this system are the best of the sample with high S/N allowing identification of many emission lines, included fainter H2 excitation lines. Data in the optical, NIR, radio and X-ray exist for this object. In this work this object shows the broadest Pa emission of the sample with FWHM 700 km s-1. This line also shows a blue wing which could conceivably be further broadened emission. Analysis of the H2 emission points towards a mainly thermal origin with a fraction of fluorescence. [SiVI] emission is detected from this galaxy consistent with its classification as a Sy2. Spectra for the secondary nucleus of this system were also obtained for this work. These spectra show no emission lines. CO absorption bands were detected for both nuclei.
A.5 IRAS 23365+3604
This single nucleus object is generally classified as a LINER [Veilleux et al. 1995] but has also been labelled as a composite galaxy [Baan et al. 1998]. It is one of the objects in this sample classified as non-interacting but does show a disturbed morphology. Previous K band spectra exist for this object [Goldader et al. 1995, Veilleux et al. 1999b]. Unfortunately removal of atmospheric effects was not totally successful for this object, making the spectrum noisy between 1.82m and 1.95m (observed wavelength). However this region was free of expected emission due to the redshift of this object. Of the sample, IRAS 23365 showed some of the highest values for E(B-V) calculated using NIR lines. The Pa emission measured showed a blue wing seen on some many of this objects. This line was not broadened, consistent with previous work [Veilleux et al. 1999b]. Enough H2 lines were detected to allow some analysis of the potential excitation mechanism. Final conclusions attributed perhaps as much as 70 per cent of the total H2 emission to non-thermal mechanisms. Fairly strong CO absorption bands are observed are observed in this object.
A.6 IRAS 23420+2227
Little previous work and no classification exists for this relatively faint galaxy which shows no sign of interaction. The spectra shown here do not support the possibility that this galaxy containing an AGN. The Pa emission seen is narrow, possibly showing a blue wing. Three H2 lines are identified which indicate a mainly thermal excitation mechanism.
A.7 IRAS 23498+2423
This interacting Seyfert 2 [Veilleux et al. 1999a] has the highest redshift of our sample. We obtained only a H band spectrum for this object since K band spectra already exist [Veilleux et al. 1997]. Consistent with this previous work, our spectrum shows broadened Pa emission FWHM 5000 km s-1.